语音信号处理中英文翻译
- 格式:docx
- 大小:927.95 KB
- 文档页数:17
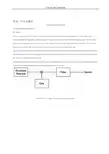
附录:中英文翻译15SpeechSignalProcessing15.3AnalysisandSynthesisJ esseW. FussellA fte r an acousti c spee ch s i gnal i s conve rte d to an ele ctri cal si gnal by a mi crophone, i t m ay be desi rable toanalyzetheelectricalsignaltoestimatesometime-varyingparameterswhichprovideinformationaboutamodel of the speech producti on me chanism. S peech a na ly sis i s the process of e stim ati ng such paramete rs. Simil arl y , g ive n some parametri c model of spee ch production and a se que nce of param eters for that m odel,speechsynthesis istheprocessofcreatinganelectricalsignalwhichapproximatesspeech.Whileanalysisandsynthesistechniques maybedoneeitheronthecontinuoussignaloronasampledversionofthesignal,mostmode rn anal y sis and sy nthesis methods are base d on di gital si gnal processing.Atypicalspeechproductionmodelisshownin Fig.15.6.Inthismodeltheoutputoftheexcitationfunctionisscaledbythegainparam eterandthenfilteredtoproducespeech.Allofthesefunctionsaretime-varying.F IGUR E 15 .6 A ge ne ra l spee ch productionmodel.F IGUR E 1 5 .7 W ave form of a spoken phone me /i/ as i nbeet.Formanymodels,theparametersarevariedataperiodicrate,typically50to100timespersecond.Mostspee ch inform ati on is containe d i n the porti on of the si gnal bel ow about 4 kHz.Theexcitationisusually modeledaseitheramixtureorachoiceofrandomnoiseandperiodicwaveform.For hum an spee ch, v oi ced e x citati on occurs w hen the vocal fol ds in the lary nx vibrate; unvoi ce d e x citati onoccurs at constri cti ons i n the vocal tract w hi ch cre ate turbulent a i r fl ow [Fl anagan, 1965] . The rel ati ve mi x ofthesetw o type s ofexcitationisterme d ‚v oicing.‛In addition,theperiodi c e xcitation i s characterizedby afundamentalfrequency,termed pitch orF0.Theexcitationisscaledbyafactordesignedtoproducetheproperampli tude or level of the spee ch si gnal . The scaled ex citati on function i s then fi ltere d to produce the properspe ctral characte risti cs. W hile the filter m ay be nonli near, i t i s usuall y m odele d as a li nearfunction.AnalysisofExcitationInasimplifiedform,theexcitationfunctionmaybeconsideredtobepurelyperiodic,forvoicedspeech,orpurel y random, for unvoi ce d. T hese tw o states correspond to voi ce d phoneti c cl asse s such as vow elsand nasalsandunvoicedsoundssuchasunvoicedfricatives.Thisbinaryvoicingmodelisanoversimplificationforsounds such as v oi ced fri cati ves, whi ch consist of a mi xture of peri odi c and random compone nts. Fi gure 15.7is an ex ample of a time w ave form of a spoke n /i/ phoneme , w hi ch is w ell m odeled by onl y pe riodi c e x citation.B oth ti me dom ai n and frequency dom ai n anal y s is te chni ques have bee n used to esti m ate the de greeofvoi ci ng for a short se gme nt or frame of spee ch. One ti me dom ain fe ature, te rme d the ze ro crossing rate,i sthenumberoftimesthesignalchangessigninashortinterval.AsshowninFig.15.7,thezerocrossingrateforvoicedsoundsisrelativ elylow.Sinceunvoicedspeechtypicallyhasalargerproportionofhigh-frequencyenergy than voi ce d spee ch, the ratio of high-fre que ncy to low -frequency e nergy is a fre que ncy dom aintechni que that provi des i nform ation on voi cing.A nothe r measure use d to estim ate the de gree of voi ci ng is the autocorrel ation functi on, w hi ch is de fine d fora sam pled speech se gment, S ,aswheres(n)isthevalueofthenthsamplewithinthesegmentoflengthN.Sincetheautocorrelationfunctionofa periodi c functi on is i tsel f pe ri odi c, voi ci ng can be e sti mated from the de gree of pe ri odi city oftheautocorrel ati on function. Fi gure 15. 8 i s a graph of the nonne gati ve te rms of the autocorrel ation functi on for a64 -ms frame of the w aveform of Fi g . 15. 7. Ex cept for the de cre ase i n amplitude w ith i ncre asi ng lag, whi chresultsfromtherectangularwindowfunctionwhichdelimitsthesegment,theautocorrelationfunctionisseento be quite pe riodi c for thi s voi ce dutterance.F IGUR E 1 5 .8 A utocorrel ati on functi on of one frame of /i/. Ifananalysisofthevoicingofthespeechsignalindicatesavoicedorperiodiccomponentispresent,another ste p i n the anal y si s process m ay be to estim ate the freque ncy ( or pe ri od) of the voi ce d component.Thereareanumberofwaysinwhichthismaybedone.Oneistomeasurethetimelapsebetweenpeaksinthetime dom ai n si gnal. For ex am ple i n Fi g . 15.7 the m aj or peaks are separate d by about 0. 00 71 s, for afundamentalfrequencyofabout141Hz.Note,itwouldbequitepossibletoerrintheestimateoffundamentalfre quency by mistaki ng the sm aller pe aks that occur betwee n the m a jor pe aks for the m aj or pe aks. Thesesmallerpeaksareproducedbyresonanceinthevocaltractwhich,inthisexample,happentobeatabouttwicethe ex citation fre quency . T his ty pe of e rror w ould re sult in an e sti m ate of pitch approxi m atel y tw i ce the corre ct fre quency.The di stance betw ee n m ajor pe ak s of the autocorrel ation functi on is a closel y rel ate d fe ature thatisfre quentl y use d to esti m ate the pitch pe ri od. In Fi g . 15. 8, the di stance between the m aj or peaks in the autocorrelationfunctionisabout0.0071s.Estimatesofpitchfromtheautocorrelationfunctionarealsosusce pti ble to mistaking the fi rst vocal track resonance for the g l ottal e x citati on frequency.The absol ute m agnitude di ffere nce functi on ( AM DF), de fi nedas,is another functi on w hi ch is often use d i n estim ating the pitch of voi ce d spee ch. A n ex ample of the AM DF isshownin Fig.15.9forthesame64-msframeofthe/i/phoneme.However,theminimaoftheAMDFisusedasanindicatorofthepitchperiod.TheAMDFhasbeenshownt obeagoodpitchperiodindicator[Rossetal.,19 74 ] and does not requi re multi pli cations.FourierAnalysisOne of the m ore comm on processe s for e stim ating the spe ctrum of a se gme nt of spee ch is the Fourie rtransform [ Oppenheim and S chafer, 1 97 5 ]. T he Fourie r transform of a seque nce is m athem ati call y de fine daswheres(n)representsthetermsofthesequence.Theshort-timeFouriertransformofasequenceisatimedependentfunction,definedasF IGUR E 1 5 .9 A bsolute m agnitude diffe rence functi on of one frame of /i/.wherethewindowfunctionw(n)isusuallyzeroexceptforsomefiniterange,andthevariablemisusedtoselectthesectionofthesequ enceforanalysis.ThediscreteFouriertransform(DFT)isobtainedbyuniformlysam pling the short-ti me Fourie r transform i n the fre quency dime nsi on. Thus an N-point DFT is computedusingEq.(15.14),wherethe setofNsamples,s(n),may have firstbeenmultiplied by a window function.Anexampleofthemagnitudeofa512-pointDFTofthewaveformofthe/i/from Fig.15.10isshowninFig.15.10.Noteforthisfi gure, the 512 poi nts in the se que nce have been m ulti plied by a Ham ming w i ndow de fi nedbyF IGUR E 1 5 .1 0 M agnitude of 51 2-point FFT of Ham mi ng window e d/i/.S ince the spe ctral characteristi cs of spee ch m ay change dram a ti call y in a fe w milli se conds, the le ngth, type,and l ocation of the wi ndow function are im portant consi derati ons. If the w indow is too long, changi ng spe ctralcharacteristicsmaycauseablurredresult;ifthewindowistooshort,spectralinaccuraciesresult.AHammingwi ndow of 16 to 32 m s durati on is com m onl y use d for spee ch analysis.S everal characte risti cs of a speech utte rance m ay be dete rmine d by ex amination of the DFT m agnitude. InFig.15.10,theDFTofavoicedutterancecontainsaseriesofsharppeaksinthefrequencydomain.Thesepeaks, caused by the peri odi c sampl ing acti on of the g lottal ex ci tation, are separated by the fundame ntalfrequencywhichisabout141Hz,inthisexample.Inaddition,broaderpeakscanbeseen,forexampleatabout300 Hz and at about 2300 Hz. T hese broad peaks, calle d formants, result from resonances in the vocaltract. LinearPredictiveAnalysisGivenasampled(discrete-time)signals(n),apowerfulandgeneralparametric modelfortimeseriesanalysisiswheres(n)istheoutputandu(n)istheinput(perhapsunknown).Themodelparametersare a(k)fork=1,p,b( l ) for l = 1, q, and G. b( 0) is assume d to be unity. Thi s m odel , describe d as an autore g ressi ve m ov ing average(ARM A)orpole-zeromodel,formsthefoundationfortheanalysismethodtermedlinearprediction.Anautoregressive(AR) orall-polemodel,forwhichallofthe‚b‛coe fficientsexceptb(0)arezero,isfrequentlyused for spee ch anal y si s [M arkel and Gray, 1976].In the standard A R formul ati on of li ne ar predi ction, the model paramete rs are sele cte d to mi ni mizethemean-squarederrorbetweenthemodelandthespeechdata.Inoneofthevariantsoflinearprediction,theautocorrelationmethod,themini mizationiscarriedoutforawindowedsegmentofdata.Intheautocorrelationmethod,minimizingthemean-squareerror of the time domain samples is equivalentto minimizing theintegratedratioofthesignalspectrumtothespectrumoftheall-polemodel.Thus,linearpredictiveanalysisisagoodmethod forspectralanalysiswheneverthesignalisproducedby an all-pole system.M ost speechsounds fi t thi s model w ell.One ke y consi deration for li near pre dicti ve anal y si s is the order of the model, p. For spee ch, if the orde ristoosmall,theformantstructureisnot well represented. If the orderis too large, pitch pulses as well asformantsbegintoberepresented.Tenth- or twelfth-order analysis is typical forspeech.Figures15.11 and15.12 provideexamplesof the spectrum produced by eighth-order and sixteenth-order linear predictiveanalysisofthe/i/waveformofFig.15.7.Figure15.11showstheretobethreeformantsatfrequenciesofabout30 0, 23 00, and 3200 Hz , whi ch are ty pi cal for an/i/.Homomorphic(Cepstral)AnalysisFor the speech m odel of Fi g. 15. 6, the e x citati on and filter i mpulse response are convol ved to produce thespeech.Oneoftheproblemsofspeechanalysisistoseparateordeconvolvethespeechintothesetw ocom ponents. Onesuch te chni que is called hom omorphi c filte ri ng [ Oppe nheim and S chafer, 1968 ]. Thecharacte risti c sy ste mfor a sy ste m for hom om orphi c deconvol ution conve rts a convolution operation to anadditi on ope ration. The output of such a characteristi c sy stem is calle d the com ple x cep str u m . The complexcepstrumisdefinedastheinverseFouriertransformofthecomplexlogarithmoftheFouriertransformoftheinput.Iftheinputseque nceisminimumphase(i.e.,thez-transformoftheinputsequencehasnopolesorzerosoutside the unit ci rcle), the se quence can be represe nted by the real portion of the transforms. Thus, the re alcepstrum can be com pute d by cal cul ati ng the inve rse Fourie r transform of the log- spe ctrum of theinput.FIGURE15.11Eighth-orderlinearpredictiveanalysisofan‚i‛.FIGURE15.12Sixteenth-orderlinearpredictiveanalysisofan‚i‛.Fi gure 1 5.1 3 show s an e x ample of the cepstrum for the voi ced /i/ utterance from Fi g. 15.7 . The cepstrum ofsuch a voi ce d utterance i s characte rized by rel ati vel y la rge v alues in the fi rst one or tw o milli se conds as w ellas。
移动通信常用英汉小词典AA模拟AB地址总线AC交流电ACCESS接入ACCESSORIER配件ACCTIVE FITER有源滤波ACTIVA TE激活ADC模数转换ADDRESS地址线ADDRESS ENFEMA 地址信息ADI邻近AFC自动频率控制AFMS来自音频信号AFPCB音频电路板AGC自动增益控制AGND模拟地AID区域识别标志AIR TIME通话时间AIR TIME COUNTER通话计时器AIS ALC告警指示信息ALARM告警ALERT振铃AM调幅AM ADJ调幅调整AMP放大器ANACLK模拟13MHZ时钟ANODE阳极ANT天线ANTSW天线开关APC自动功率控制APCM自适应型脉冲编码调整ASIC专用应用集成电路ATMS到移动台音频信号AUC鉴权中心AUDIO音频AUDIO BIT RATE音频比特率AUDIO MUTE音频静音AUDIO PCM SIGAL音频脉冲编码信号AUTO TEST自动测试AUX辅助A VCC音频供电A/D INTERFACE模数接口A/L音频/逻辑板B BACKLIGHT背光BACKUP后备电源BAND频段BARRING限制BASE基极BASEBAND基带BIAS偏压BIT比特BLKCK块时钟BOOT屏蔽罩BS基站BSC基站控制器BSI电池尺寸BSIC基站识别码BSS基站子系统BTS基站收发信台BUFFER缓冲放大器BURST突发脉冲串BUS总线BW带宽C CE片使能、激活芯片CELL小区CELLULAR蜂窝CHANNEL信道CHSW充电开关CINVERTER整机CLONE复制COL列地址线COMP补充数据D DB分贝DET检测DEV偏移DFMS(来自手机)数据DIMS(来自基站)数据DISTORTION失真DIVERT转换DSP数字信号处理器DTMF双音多频DUPLEX双工器DUPLX双工间隔E EL发光ERROR AMP误差放大器ESD静电放大ESN电子串号F FACCH信道FBUS外接信号线FDMA频分多址FEED BACK反馈FH跳频FILTER滤波器FOCC全双工FREQUENCY DRIFT频率漂移FUSE熔丝G GAIN增益GREEN绿色GRID栅极GV AP电源模块H HARMONIC谐波滤波器HOOK挂机检测HPF高通滤波器I IF中频信号IFLO中频本振IFIUAD中频输出IFVCO中频VCOINDUCTANCE电感INFRARED RAY红外线INITIAL初始INT中断INTERFACE接口L LATOR温补晶体振荡器LBQ滤波器LCD EN显示屏使能LCDRSTX LCD复位信号LDE发光二极管LO本振LOCATION UPDA TE位置登记LOOP GAIN环路增益LOGIC逻辑LOOP FILTER环路滤波LOST失步LPC线性预测编码器LPF低通滤波LSB最低有效位M MAIN DIVIDER主分频器MASH多级噪声整形MCLK主时钟MCU微处理器MOD调制MODEM调制解调器MONITOR监视器MPU中央处理器MS移动台MSC移动电话交换中心MULTIPLEX多路复用MUTE静音N NPC网络参数控制O OFST偏置OMC操作维护中心ONE FRAME一帧OP AMP运算放大器OSC振荡器P PA功率放大器PAD衬底PARAMETER参数PARITY奇偶校验PAUSE暂停PCH寻呼信道PCM脉冲编码调制PD光敏二极管PE相位编码PEL像素PK峰值PKL相位跟踪环路PLL锁相环路PM调相POINT点PPM百万分之一PRE AMP前置放大器PURX复位PWM脉冲宽度调制PWRON开机信号线Q QUADRATURE正交调制QUALIFY认证QUALITY质量R R/W读写控制RACH随机接入信道RADIO射频、无线电RAM随机存储器RANDOM随机RD读RECALL重呼RECC反向控制信道RED红色REDA TA射频频率合成器数据REDUCE减少REED干簧管REF参考REF ADJ基准频率调整REFERENCE OCILLATOR参考振荡器RESET复位RESISTANCE电阻RF射频RFAENB射频频率合成器启动RFC逻辑时钟信号RFCLK射频时钟信号RFLO射频本振RMS均方根ROAM漫游ROM只读存储器ROW行地址RSSI接收信号强度指示RST复位信号RTC时钟控制RVC反向话音信道RX接收RX ON接收启动RX OUT接收输出RX/IQ接收解调信号RXEN接收使能RXIFN接收中频信号负RXIFP接收中频信号正RXPWR接收电源控制RXQN接收Q信号负RXQP接收Q信号正RXVCO接收VCOS SAD-DET饱和度检测SAMPLE取样SAT音频监测音SAW声表面滤波器SCLK频率合成时钟信号SDATA频率合成数据SECCH标准专用控制信道SECURTITY CODE保密码SENA频率合成启动控制SENSITIVITY灵敏度SENSOR传感器SHORTCUT短路SIC信令接口芯片SID系统识别SIGNAL信号SPI外接串行接口SRAM静态随机存储器STANDBY待机SW开关SYB DAT频率合成数据SYNC同步T TANK回路TCXO温度补偿晶体振荡器TP测试点TS时隙TX发射TXEN发射使能、启动TXI/Q发射数据TXIN发射I信号负TXIP发射I信号正TXON发射启动TXQN发射Q信号负TXQP发射Q信号正TXRF发射射频TXVCO发射压控振荡器U UHF超高频UPDATA升级UPLINK上行链接V VCH语音信道VCO压控振荡器VCTCXO温补压控振荡器VCXOCONT基准振荡器频率控制VHF甚高频VLCD液晶显示器电压VLR访位置登记VSYN频率合成电源W WAN广域网络WARNING警告WA VEFORM波形WDG看门狗WIRELESS无线X XVCC射频供电。
语音信号处理毕业论文中英文资料外文翻译文献语音识别在计算机技术中,语音识别是指为了达到说话者发音而由计算机生成的功能,利用计算机识别人类语音的技术。
(例如,抄录讲话的文本,数据项;经营电子和机械设备;电话的自动化处理),是通过所谓的自然语言处理的计算机语音技术的一个重要元素。
通过计算机语音处理技术,来自语音发音系统的由人类创造的声音,包括肺,声带和舌头,通过接触,语音模式的变化在婴儿期、儿童学习认识有不同的模式,尽管由不同人的发音,例如,在音调,语气,强调,语调模式不同的发音相同的词或短语,大脑的认知能力,可以使人类实现这一非凡的能力。
在撰写本文时(2008年),我们可以重现,语音识别技术不只表现在有限程度的电脑能力上,在其他许多方面也是有用的。
语音识别技术的挑战古老的书写系统,要回溯到苏美尔人的六千年前。
他们可以将模拟录音通过留声机进行语音播放,直到1877年。
然而,由于与语音识别各种各样的问题,语音识别不得不等待着计算机的发展。
首先,演讲不是简单的口语文本——同样的道理,戴维斯很难捕捉到一个note-for-note曲作为乐谱。
人类所理解的词、短语或句子离散与清晰的边界实际上是将信号连续的流,而不是听起来: I went to the store yesterday昨天我去商店。
单词也可以混合,用Whadd ayawa吗?这代表着你想要做什么。
第二,没有一对一的声音和字母之间的相关性。
在英语,有略多于5个元音字母——a,e,i,o,u,有时y和w。
有超过二十多个不同的元音, 虽然,精确统计可以取决于演讲者的口音而定。
但相反的问题也会发生,在那里一个以上的信号能再现某一特定的声音。
字母C可以有相同的字母K的声音,如蛋糕,或作为字母S,如柑橘。
此外,说同一语言的人使用不相同的声音,即语言不同,他们的声音语音或模式的组织,有不同的口音。
例如“水”这个词,wadder可以显著watter,woader wattah等等。
数字信号处理英语Digital Signal Processing (DSP) is an essential technology used in various fields such as communication, media, control systems and audio signal processing. This technology uses algorithms to transform digital signals (numbers) into specific applications. In this article, wewill explore some common terminologies used in DSP in English.1. SamplingSampling is the process of converting a continuoussignal into a discrete signal. The sampled signal represents the original signal at specific intervals, known as the sampling frequency. The number of samples taken per unit time is called the sample rate. For example, in audio signal processing, the standard sample rate is 44.1 kilohertz (kHz), which means that the signal is sampled 44,100 times per second.2. QuantizationQuantization is the process of assigning a discretevalue to each sample. Each sample is rounded to the nearest value in a given set of discrete values. The interval between each value is known as the quantization step size. For example, in audio signal processing, the quantization stepsize is measured in bits. The most common quantization bitsize is 16 bits, which means that each sample can be represented by a 16-bit binary number.3. FilteringFiltering is the process of removing or attenuating specific frequencies in a signal. The filter can be designedto pass only the desired frequency range or to eliminate unwanted frequencies. There are two types of filters –analog filters and digital filters. Analog filters usepassive components such as capacitors and resistors, while digital filters use mathematical algorithms to process the signal.4. Fast Fourier Transform (FFT)The Fourier Transform is a mathematical technique usedto analyze signals in the frequency domain. FFT is aparticular algorithm that efficiently calculates the Fourier Transform of a discrete signal. It is widely used in digital signal processing to analyze and process signals in the frequency domain.5. Digital Signal Processors (DSPs)Digital Signal Processors (DSPs) are specialized microprocessors used to perform DSP operations. DSPs are used in devices such as cellphones, wireless modems, televisions, and audio devices. They are optimized for performing complex mathematical operations required in digital signal processing.In conclusion, digital signal processing has become an essential technology in many fields, from communications to audio signal processing. Understanding the terminologies used in DSP is vital in learning and applying this technology. The above-mentioned terminologies are some of the most common terms used in DSP, and having a good understanding of thesewill help you to get started in this exciting field.。
我收集到的最齐全的音频专业术语中英文对照表翻译交流AAAC automatic ampltiude control 自动幅度控制AB AB制立体声录音法Abeyancd 暂停,潜态A—B repeat A-B重复ABS absolute 绝对的,完全的,绝对时间ABS american bureau of standard 美国标准局ABSS auto blank secrion scanning 自动磁带空白部分扫描Abstime 绝对运行时间A.DEF audio defeat 音频降噪,噪声抑制,伴音静噪ADJ adjective 附属的,附件ADJ Adjust 调节ADJ acoustic delay line 声延迟线Admission 允许进入,供给ADP acoustic data processor 音响数据处理机ADP(T)adapter 延配器,转接器ADRES automatic dynamic range expansion system 动态范围扩展系统ADRM analog to digital remaster 模拟录音、数字处理数码唱盘ADS audio distribution system 音频分配系统A.DUB audio dubbing 配音,音频复制,后期录音ADV advance 送入,提升,前置量ADV adversum 对抗ADV advancer 相位超前补偿器Adventure 惊险效果AE audio erasing 音频(声音)擦除AE auxiliary equipment 辅助设备Aerial 天线AES audio engineering society 美国声频工程协会AF audio fidelity 音频保真度AF audio frequency 音频频率AFC active field control 自动频率控制AFC automatic frequency control 声场控制Affricate 塞擦音AFL aside fade listen 衰减后(推子后)监听A-fader 音频衰减AFM advance frequency modulation 高级调频AFS acoustic feedback speaker 声反馈扬声器AFT automatic fine tuning 自动微调AFTAAS advanced fast time acoustic analysis system 高级快速音响分析系统After 转移部分文件Afterglow 余辉,夕照时分音响效果Against 以……为背景AGC automatic gain control 自动增益控制AHD audio high density 音频高密度唱片系统AI advanced integrated 预汇流AI amplifier input 放大器输入AI artificial intelligence 人工智能AI azimuth indicator 方位指示器A—IN 音频输入A-INSEL audio input selection 音频输入选择Alarm 警报器ALC automatic level control 自动电平控制ALC automatic load control自动负载控制Alford loop 爱福特环形天线Algorithm 演示Aliasing 量化噪声,频谱混叠Aliasing distortion 折叠失真Align alignment 校正,补偿,微调,匹配Al-Si—Fe alloy head 铁硅铝合金磁头Allegretto 小快板,稍快地Allegro 快板,迅速地Allocation 配置,定位All rating 全(音)域ALM audio level meter 音频电平表ALT alternating 震荡,交替的ALT alternator 交流发电机ALT altertue 转路ALT—CH alternate channel 转换通道,交替声道Alter 转换,交流电,变换器AM amperemeter 安培计,电流表AM amplitude modulation 调幅(广播)AM auxiliary memory 辅助存储器Ambience 临场感,环绕感ABTD automatic bulk tape degausser 磁带自动整体去磁电路Ambient 环境的Ambiophonic system 环绕声系统Ambiophony 现场混响,环境立体声AMLS automatic music locate system 自动音乐定位系统AMP ampere 安培AMP amplifier 放大器AMPL amplification 放大AMP amplitude 幅度,距离Amorphous head 非晶态磁头Abort 终止,停止(录制或播放)A-B TEST AB比较试听Absorber 减震器Absorption 声音被物体吸收ABX acoustic bass extension 低音扩展AC accumulator 充电电池AC adjustment caliration 调节—校准AC alternating current 交流电,交流AC audio coding 数码声,音频编码AC audio center 音频中心AC azimuth comprator 方位比较器AC—3 杜比数码环绕声系统AC-3 RF 杜比数码环绕声数据流(接口)ACC Acceleration 加速Accel 渐快,加速Accent 重音,声调Accentuator 预加重电路Access 存取,进入,增加,通路Accessory 附件(接口),配件Acryl 丙基酰基Accompaniment 伴奏,合奏,伴随Accord 和谐,调和Accordion 手风琴ACD automatic call distributor 自动呼叫分配器ACE audio control erasing 音频控制消磁A—Channel A(左)声道Acoumeter 测听计Acoustical 声的,声音的Acoustic coloring 声染色Acoustic image 声像Across 交叉,并行,跨接Across frequency 交叉频率,分频频率ACST access time 存取时间Active 主动的,有源的,有效的,运行的Active crossover 主动分频,电子分频,有源分频Active loudsperker 有源音箱Armstrong MOD 阿姆斯特朗调制ARP azimuth reference pulse 方位基准脉冲Arpeggio 琶音Articulation 声音清晰度,发音Artificial 仿……的,人工的,手动(控制) AAD active acoustic devide 有源声学软件ABC auto base and chord 自动低音合弦Architectural acoustics 建筑声学Arm motor 唱臂唱机Arpeggio single 琶音和弦,分解和弦ARL aerial 天线ASC automatic sensitivity control 自动灵敏度控制ASGN Assign 分配,指定,设定ASP audio signal processing 音频信号处理ASS assembly 组件,装配,总成ASSEM assemble 汇编,剪辑ASSEM Assembly 组件,装配,总成Assign 指定,转发,分配Assist 辅助(装置)ASSY accessory 组件,附件AST active servo techonology 有源伺服技术A Tempo 回到原速Astigmatism methord 象散法BB band 频带B Bit 比特,存储单元B Button 按钮Babble 多路感应的复杂失真Back 返回Back clamping 反向钳位Back drop 交流哼声,干扰声Background noise 背景噪声,本底噪声Backing copy 副版Backoff 倒扣,补偿Back tracking 补录Back up 磁带备份,支持,预备Backward 快倒搜索Baffle box 音箱BAL balance 平衡,立体声左右声道音量比例,平衡连接Balanced 已平衡的Balancing 调零装置,补偿,中和Balun 平衡=不平衡转换器Banana jack 香蕉插头Banana bin 香蕉插座Banana pin 香蕉插头Banana plug 香蕉插头Band 频段,Band pass 带通滤波器Bandwidth 频带宽,误差,范围Band 存储单元Bar 小节,拉杆BAR barye 微巴Bargraph 线条Barrier 绝缘(套)Base 低音Bass 低音,倍司(低音提琴)Bass tube 低音号,大号Bassy 低音加重BATT battery 电池Baud 波特(信息传输速率的单位)Bazooka 导线平衡转接器BB base band 基带BBD Bucket brigade device 戽链器件(效果器)B BAT Battery 电池BBE 特指BBE公司设计的改善较高次谐波校正程度的系统BC balanced current 平衡电流BC Broadcast control 广播控制BCH band chorus 分频段合唱BCST broadcast (无线电)广播BD board 仪表板Beat 拍,脉动信号Beat cancel switch 差拍干扰消除开关Bel 贝尔Below 下列,向下Bench 工作台Bend 弯曲,滑音Bender 滑音器BER bit error rate 信息差错率BF back feed 反馈BF Backfeed flanger 反馈镶边BF Band filter 带通滤波器BGM background music 背景音乐Bias 偏置,偏磁,偏压,既定程序Bidirectional 双向性的,8字型指向的Bifess Bi—feedback sound system 双反馈系统Big bottom 低音扩展,加重低音Bin 接收器,仓室BNG BNC连接器(插头、插座),卡口同轴电缆连接器Binaural effect 双耳效应,立体声Binaural synthesis 双耳合成法Bin go 意外现象Bit binary digit 字节,二进制数字,位Bitstream 数码流,比特流Bit yield 存储单元Bi—AMP 双(通道)功放系统Bi-wire 双线(传输、分音)Bi—Wring 双线BK break 停顿,间断BKR breaker 断电器Blamp 两路电子分音Blanking 关闭,消隐,断路Blaster 爆裂效果器Blend 融合(度)、调和、混合Block 分程序,联动,中断Block Repeat 分段重复Block up 阻塞Bloop (磁带的)接头噪声,消音贴片BNC bayonet connector 卡口电缆连接器Body mike 小型话筒Bond 接头,连接器Bongo 双鼓Boom 混响,轰鸣声Boomy 嗡嗡声(指低音过强)Boost 提升(一般指低音),放大,增强Booth 控制室,录音棚Bootstrap 辅助程序,自举电路Both sides play disc stereo system双面演奏式唱片立体声系统Bottoming 底部切除,末端切除Bounce 合并Bourclon 单调低音Bowl 碗状体育场效果BP bridge bypass 电桥旁路BY bypass 旁通BPC basic pulse generator 基准脉冲发生器。
毕业设计(论文)外文文献翻译文献、资料中文题目:数字信号处理文献、资料英文题目:Digital Signal Processing 文献、资料来源:文献、资料发表(出版)日期:院(部):专业:班级:姓名:学号:指导教师:翻译日期: 2017.02.14数字信号处理一、导论数字信号处理(DSP)是由一系列的数字或符号来表示这些信号的处理的过程的。
数字信号处理与模拟信号处理属于信号处理领域。
DSP包括子域的音频和语音信号处理,雷达和声纳信号处理,传感器阵列处理,谱估计,统计信号处理,数字图像处理,通信信号处理,生物医学信号处理,地震数据处理等。
由于DSP的目标通常是对连续的真实世界的模拟信号进行测量或滤波,第一步通常是通过使用一个模拟到数字的转换器将信号从模拟信号转化到数字信号。
通常,所需的输出信号却是一个模拟输出信号,因此这就需要一个数字到模拟的转换器。
即使这个过程比模拟处理更复杂的和而且具有离散值,由于数字信号处理的错误检测和校正不易受噪声影响,它的稳定性使得它优于许多模拟信号处理的应用(虽然不是全部)。
DSP算法一直是运行在标准的计算机,被称为数字信号处理器(DSP)的专用处理器或在专用硬件如特殊应用集成电路(ASIC)。
目前有用于数字信号处理的附加技术包括更强大的通用微处理器,现场可编程门阵列(FPGA),数字信号控制器(大多为工业应用,如电机控制)和流处理器和其他相关技术。
在数字信号处理过程中,工程师通常研究数字信号的以下领域:时间域(一维信号),空间域(多维信号),频率域,域和小波域的自相关。
他们选择在哪个领域过程中的一个信号,做一个明智的猜测(或通过尝试不同的可能性)作为该域的最佳代表的信号的本质特征。
从测量装置对样品序列产生一个时间或空间域表示,而离散傅立叶变换产生的频谱的频率域信息。
自相关的定义是互相关的信号本身在不同时间间隔的时间或空间的相关情况。
二、信号采样随着计算机的应用越来越多地使用,数字信号处理的需要也增加了。
英语语音信号处理技术研究与应用在信息时代,语音处理技术(Speech Processing Technology)受到广泛关注。
其中,语音信号处理技术的研究与应用是一项重要的研究领域。
英语作为全球共通的语言之一,其语音信号处理技术的研究与应用也备受关注。
一、英语语音信号处理技术的研究现状英语语音信号处理技术的研究主要涉及到音频录制、音频分析、音频压缩、自然语言处理等方面。
其中,音频录制是语音信号处理技术的基础,音频质量的提高对于后续的分析与处理都有着至关重要的作用。
在音频分析方面,常见的方法有基于短时傅里叶变换(STFT)的频域分析方法、本质波形重建(PSOLA)方法、隐马尔科夫模型(HMM)方法等。
这些方法将语音信号转化为数字信号,从而进行后续的处理。
音频压缩是语音信号处理技术的另一个核心部分。
传统的音频压缩方法有短时傅里叶变换-反变换压缩(STFT-ICTF)方法、小波变换方法等。
这些方法的特点在于能够在保证音频质量的前提下,减小音频文件的大小,从而便于存储和传输。
自然语言处理是语音信号处理技术的重要应用领域之一。
自然语言处理技术的发展,对于智能语音助手等产品的应用非常有帮助。
如今,基于深度学习的自然语言处理方法已经成为研究热点之一。
这些方法主要通过对语音信号进行分析和处理,从而提取出语音中的特征及其语义信息,帮助智能语音助手更好地理解用户的需求。
二、英语语音信号处理技术的应用场景1、英语教育语音信号处理技术在英语教育中有着广泛的应用。
通过语音识别技术,可以帮助学生更好地学习英语发音;音频压缩技术可以将优秀的英语教育资源压缩传输到全球各地;自然语言处理技术也可以帮助学生更好地理解英语语言的意思,并且进行在线语音交流。
2、智能家居随着智能家居的发展,智能语音助手成为越来越多用户的选择。
语音信号处理技术在智能家居中扮演着很重要的角色。
它可以帮助智能语音助手更好地识别用户的语音指令,从而实现远程控制家居设备的功能。

鼻道,Nasal tract鼻音,Nasals谱分析法,Spectrum analysis methods谱平整,Spectrum flattening边界条件,Boundary condition声门处的,at glottis嘴唇端的,at lips并联式实现,Parallel form implementation爆破音,Plosive sounds比特率,Bit-rate半元音,Semivowels窗,Windows种类,classes of海明窗,Hamming window矩形窗,rectangular window窗宽,Window length差分量化,Differential quantization差分脉码调制,Differential PCM自适应差分脉码调制,Adaptive differential PCM冲激响应,Impulse response有限冲激响应,Finite impulse response(FIR)无限冲激响应,Infinite duration impulse response(IIR)传输线类比,Transmission line analogy清音,Unvoiced sounds抽样,Sampling抽样定理,sampling theorem抽样率,sampling rate抽取与插值,Decimation and interpolation叠加原理,Principles of superposition带宽,Bandwidth倒频谱,Cepstrum复倒频谱,Complex cepstrum对数面积比,log area ratio短时自相关函数,Short-time autocorrelation function 短时平均幅度,Short-time average magnitude短对平均幅度差函数,short-time average magnitude difference function短时平均过零率,short-time average zero-crossing rate短时傅里叶变换,Short-time Fourier transform短时能量,Short-time energy单位抽样响应,Unit sample response单位抽样(冲激)序列,Unit sample(impulse) sequence 单位阶跃序列,Unit step sequence分析-综合系统,Analysis-synthesis systems傅里叶变换,Fourier transform辐射,Radiation反射系数,Reflection coefficient识别,Recognition谈话人识别系绕,speaker recognition systems语音识别系统,speech recognition systems孤立数字识别,isolated digit recognition连续数字识别,continuous digit recognition说话人辨认,Speaker identification说话人确认,Speaker verification时间弯折,Time warping时间依赖傅里叶变换,Time-dependent Fourier transform 声道中的损耗,Losses in the vocal tract由于热传导,due to thermal conduction由于粘滞摩擦,due to viscous frictions由于屈服性管壁,due to yielding walls声门,Glottis声道,Vocal tract声导纳, Acoustic admittance声阻抗,Acoustic impedance声码器,Vocoders通道式声码器,channel vocoder共振峰声码器,formant vocoder同态声码器,homomorphic vocoder线性预测声码器,linear predictive vocoder相位声码器,phase vocoder声激励声码器,voice excited vocoder线性预测编码方程组的解,Solution of LPC equations 杜宾法,Durbin's method乔里斯基分解,Cholesky decomposition格型解,lattice solution线性预测编码,Linear predictive coding(LPC)线性预测分析,Linear predictive analysis自相关法,auto correlation method协方差法,covariance method线性预测谱,Linear predictive spectrum线性预测器,Liner predictor线性移不变系统,Linear shift-invariant systems信息率,Information rate信噪比,SNR双元音,Diphthongs塞音,Stops数字滤波器,Digital filters数字编码,Digital coding倒频谱的,of the cepstrum共振峰的,of formantLPC参数的,of LPC parameter时间依赖博里叶变换的,of the time-dependent Fourier transform利用自适应增量调制的,using adaptive delta modulation利用PCM的,using PCM滤波器组相加法, Filter bank summation method量化,Quantization瞬时量化,Instantaneous quantization均匀量化,uniform quantization反馈量化,Feedback quantization自适应量化,Adaptive quantization对数量化,Logarithmic quantization最佳量化,Optimum quantization上升-中点型量化器,Mid-riser quantizer水平一中点型最化器,Mid-tread quantizer离散傅里叶变换,Discrete Fourier transform。
频率范围 frequency range灵敏度 sensitivity线路输入 line input电压输出 line output信噪比 S/N signal/noise (ratio)谐波失真 harmonic distortion指向特性 directivity额定功率 rated power监听耳机 monitor earphone供电电源 power supply输入阻抗 input impedance录音输出 record output最大声压级 SPL ( supreme pressure level) 接收距离 receive distance测量话筒 measure microphone无线话筒 wireless microphone驻极话筒 electret microphone立体声话筒 stereo microphone传声器 microphone调音台 audio mixing control均衡器 EQ equalizer效果器 effector反馈抑制器 feedback control压限器 compress control (压缩器) limitr(限幅器)等效噪声级 equivalent noise level消声室 dead room数字技术 digital technic智能技术 Intelligence technic白噪声 white noise粉红噪声 pink noise计权网络 weighting network输出电平 output level幻像供电 phantom power极座标图 polar pattern防风罩 windscreen话筒底座 microphone table stand减振架 absorber话筒夹架 microphone clamp话筒线缆 microphone cable动圈话筒 dynamic microphone抗噪话筒 anti-noise microphone净重量 net weight外形尺寸 dimension电压放大器 voltage amplifier小膜片电容传声器 small diaphragm microphone 大膜片电容传声器 large diaphragm microphone 长枪式电容传声器 long shotgun microphone短枪式电容传声器 short shotgun电子管电容传声器 vacuum tube condenser microphone 调整率 adjustable radio恒定电压 constant voltage低音用扩音单元 woofer unit覆盖角度(水平×垂直)高音用扩声单元 tweeter unit体积 volume尺寸 dimension重量 weight串音衰减 attenuation阻尼系数 damping总谐波失真 harmonic distortion遥控功能 remote control调音台面版常用词汇英汉对照:out/in 输出/输入Line 线路Mic 传声器输入GAIN 增益调节TREBLE 高音调节MID 中音调节BASS 低音调节MONITOR 监听音量调节EFFECT 效果信号调节PAN 声象调节PEAK 峰值指示EFFECT SEND 效果送出EFFECT RTN 效果返回LEFT 左声道RIGHT 右声道SUM 混合OUT LEVEL 输出电平MUSIC 音乐STEREO 立体声CLIP 削波RECORD 录音BRIDGED是单声道桥接,BAL:左右声道RPT:话筒回声的重复次数。
基于人工智能的智能语音翻译系统设计与实现智能语音翻译系统是一种利用人工智能技术实现的语音识别与翻译的应用。
随着人工智能技术的不断发展和成熟,智能语音翻译系统在无论是商务会谈、旅游交流还是跨文化交流等领域都能起到重要的作用。
本文将从系统设计与实现两个方面进行介绍。
在智能语音翻译系统的设计上,首先需要考虑的是语音识别技术。
语音识别技术是将语音信号转化为文字的过程,常用的技术包括隐马尔可夫模型(HMM)、深度神经网络(DNN)和长短时记忆(LSTM)等。
根据不同的应用场景和需求,可以选择合适的语音识别技术进行系统设计。
其次,需要考虑的是翻译技术。
翻译技术是将识别到的文字翻译成目标语言的过程,常用的技术包括统计机器翻译(SMT)、神经机器翻译(NMT)和混合机器翻译(HMT)等。
不同的翻译技术具有不同的优势和适用范围,可以根据实际需要进行选择。
此外,智能语音翻译系统的设计还需要考虑用户界面和用户体验。
用户界面应简洁明了,方便用户进行操作和使用,可以提供语音输入、手写输入和键盘输入等多种输入方式。
同时,系统应提供实时翻译和离线翻译的功能,以满足不同用户的需求。
对于用户体验,可以通过优化翻译结果的准确性和流畅度,提高系统的可用性和用户满意度。
在智能语音翻译系统的实现上,关键技术包括语音信号处理、特征提取、语音识别和机器翻译等。
语音信号处理是对输入的语音信号进行预处理,包括消除噪声、降低干扰和增强信号等。
特征提取是将预处理后的信号转化为特征向量,常用的特征提取技术包括MFCC、PLP和LPCC 等。
语音识别是将特征向量转化为文字的过程,可以使用前文提到的语音识别技术进行实现。
机器翻译是将识别到的文字翻译为目标语言的过程,可以使用前文提到的翻译技术进行实现。
为了提高翻译结果的准确性和流畅度,可以引入注意力机制和上下文信息的处理。
注意力机制可以帮助模型更好地关注输入和输出之间的对应关系,提高翻译的准确性。
上下文信息的处理可以通过使用前后文的语境信息,提高翻译的连贯性和流畅度。
现在的AI技术发展很快,智能语音翻译机就是同声声控语音识别的,也就是说,你对着翻译界面的话筒说出一句话,就可以就可以及时翻译出对方懂的语言,同时有文字输出哦。
操作选用工具:在应用市场下载【录音转文字助手】
操作步骤:
第一步:首先我们在百度手机助手或者应用市场里面搜索:【录音转文字助手】找到以后进行下载并安装。
第二步:接着打开软件就可以看到【录音识别】、【文件识别】、【语音翻译】、【录音机】的四个功能,这里我们就举例说明下【语音翻译】。
第三步:点击橙色的【中文】按钮,开始说中文以后,下面就是翻译的英文。
第四步:点击蓝色的【English】按钮,开始说英文,就可以把你说的英语转成中文了。
以上就是语音翻译的操作步骤了,方法介绍到这里,希望可以对大家有帮助哦。
Efficient voice activity detection algorithmsusing long-term speech informationJavier Ram ırez *,Jos e C.Segura 1,Carmen Ben ıtez, Angel de la Torre,Antonio Rubio 2Dpto.Electr o nica y Tecnolog ıa de Computadores,Universidad de Granada,Campus Universitario Fuentenueva,18071Granada,SpainReceived 5May 2003;received in revised form 8October 2003;accepted 8October 2003AbstractCurrently,there are technology barriers inhibiting speech processing systems working under extreme noisy condi-tions.The emerging applications of speech technology,especially in the fields of wireless communications,digitalhearing aids or speech recognition,are examples of such systems and often require a noise reduction technique operating in combination with a precise voice activity detector (VAD).This paper presents a new VAD algorithm for improving speech detection robustness in noisy environments and the performance of speech recognition systems.The algorithm measures the long-term spectral divergence (LTSD)between speech and noise and formulates the speech/non-speech decision rule by comparing the long-term spectral envelope to the average noise spectrum,thus yielding a high discriminating decision rule and minimizing the average number of decision errors.The decision threshold is adapted to the measured noise energy while a controlled hang-over is activated only when the observed signal-to-noise ratio is low.It is shown by conducting an analysis of the speech/non-speech LTSD distributions that using long-term information about speech signals is beneficial for VAD.The proposed algorithm is compared to the most commonly used VADs in the field,in terms of speech/non-speech discrimination and in terms of recognition performance when the VAD is used for an automatic speech recognition system.Experimental results demonstrate a sustained advantage over standard VADs such as G.729and adaptive multi-rate (AMR)which were used as a reference,and over the VADs of the advanced front-end for distributed speech recognition.Ó2003Elsevier B.V.All rights reserved.Keywords:Speech/non-speech detection;Speech enhancement;Speech recognition;Long-term spectral envelope;Long-term spectral divergence1.IntroductionAn important problem in many areas of speech processing is the determination of presence of speech periods in a given signal.This task can be identified as a statistical hypothesis problem and its purpose is the determination to which category or class a given signal belongs.The decision is made based on an observation vector,frequently*Corresponding author.Tel.:+34-958243271;fax:+34-958243230.E-mail addresses:javierrp@ugr.es (J.Ram ırez),segura@ugr.es (J.C.Segura),carmen@ugr.es (C.Ben ıtez),atv@ugr.es ( A.de la Torre),rubio@ugr.es (A.Rubio).1Tel.:+34-958243283;fax:+34-958243230.2Tel.:+34-958243193;fax:+34-958243230.0167-6393/$-see front matter Ó2003Elsevier B.V.All rights reserved.doi:10.1016/j.specom.2003.10.002Speech Communication 42(2004)271–287/locate/specomcalled feature vector,which serves as the input to a decision rule that assigns a sample vector to one of the given classes.The classification task is often not as trivial as it appears since the increasing level of background noise degrades the classifier effec-tiveness,thus leading to numerous detection er-rors.The emerging applications of speech technolo-gies(particularly in mobile communications,ro-bust speech recognition or digital hearing aid devices)often require a noise reduction scheme working in combination with a precise voice activity detector(VAD)(Bouquin-Jeannes and Faucon,1994,1995).During the last decade numerous researchers have studied different strat-egies for detecting speech in noise and the influ-ence of the VAD decision on speech processing systems(Freeman et al.,1989;ITU,1996;Sohn and Sung,1998;ETSI,1999;Marzinzik and Kol-lmeier,2002;Sangwan et al.,2002;Karray and Martin,2003).Most authors reporting on noise reduction refer to speech pause detection when dealing with the problem of noise estimation.The non-speech detection algorithm is an important and sensitive part of most of the existing single-microphone noise reduction schemes.There exist well known noise suppression algorithms(Berouti et al.,1979;Boll,1979),such as Wienerfiltering (WF)or spectral subtraction,that are widely used for robust speech recognition,and for which,the VAD is critical in attaining a high level of per-formance.These techniques estimate the noise spectrum during non-speech periods in order to compensate its harmful effect on the speech signal. Thus,the VAD is more critical for non-stationary noise environments since it is needed to update the constantly varying noise statistics affecting a mis-classification error strongly to the system perfor-mance.In order to palliate the importance of the VAD in a noise suppression systems Martin pro-posed an algorithm(Martin,1993)that continu-ally updated the noise spectrum in order to prevent a misclassification of the speech signal causes a degradation of the enhanced signal.These tech-niques are faster in updating the noise but usually capture signal energy during speech periods,thus degrading the quality of the compensated speech signal.In this way,it is clearly better using an efficient VAD for most of the noise suppression systems and applications.VADs are employed in many areas of speech processing.Recently,various voice activity detec-tion procedures have been described in the litera-ture for several applications including mobile communication services(Freeman et al.,1989), real-time speech transmission on theInternet 272J.Ram ırez et al./Speech Communication42(2004)271–287(Sangwan et al.,2002)or noise reduction for dig-ital hearing aid devices(Itoh and Mizushima, 1997).Interest of research has focused on the development of robust algorithms,with special attention being paid to the study and derivation of noise robust features and decision rules.Sohn and Sung(1998)presented an algorithm that uses a novel noise spectrum adaptation employing soft decision techniques.The decision rule was derived from the generalized likelihood ratio test by assuming that the noise statistics are known a priori.An enhanced version(Sohn et al.,1999)of the original VAD was derived with the addition of a hang-over scheme which considers the previous observations of afirst-order Markov process modeling speech occurrences.The algorithm out-performed or at least was comparable to the G.729B VAD(ITU,1996)in terms of speech detection and false-alarm probabilities.Other researchers presented improvements over the algorithm proposed by Sohn et al.(1999).Cho et al.(2001a);Cho and Kondoz(2001)presented a smoothed likelihood ratio test to alleviate the detection errors,yielding better results than G.729B and comparable performance to adaptive multi-rate(AMR)option2.Cho et al.(2001b)also proposed a mixed decision-based noise adaptation yielding better results than the soft decision noise adaptation technique reported by Sohn and Sung (1998).Recently,a new standard incorporating noise suppression methods has been approved by the European Telecommunication Standards Institute(ETSI)for feature extraction and dis-tributed speech recognition(DSR).The so-called advanced front-end(AFE)(ETSI,2002)incorpo-rates an energy-based VAD(WF AFE VAD)for estimating the noise spectrum in Wienerfiltering speech enhancement,and a different VAD for non-speech frame dropping(FD AFE VAD).On the other hand,a VAD achieves silence compression in modern mobile telecommunication systems reducing the average bit rate by using the discontinuous transmission(DTX)mode.Many practical applications,such as the global system for mobile communications(GSM)telephony,use silence detection and comfort noise injection for higher coding efficiency.The International Tele-communication Union(ITU)adopted a toll-quality speech coding algorithm known as G.729 to work in combination with a VAD module in DTX mode.The recommendation G.729Annex B (ITU,1996)uses a feature vector consisting of the linear prediction(LP)spectrum,the full-band en-ergy,the low-band(0–1KHz)energy and the zero-crossing rate(ZCR).The standard was developed with the collaboration of researchers from France Telecom,the University of Sherbrooke,NTT and AT&T Bell Labs and the effectiveness of the VAD was evaluated in terms of subjective speech quality and bit rate savings(Benyassine et al.,1997). Objective performance tests were also conducted by hand-labelling a large speech database and assessing the correct identification of voiced,un-voiced,silence and transition periods.Another standard for DTX is the ETSI adaptive multi-rate speech coder(ETSI,1999)developed by the special mobile group for the GSM system.The standard specifies two options for the VAD to be used within the digital cellular telecommunications system.In option1,the signal is passed through a filterbank and the level of signal in each band is calculated.A measure of the signal-to-signal ratio (SNR)is used to make the VAD decision together with the output of a pitch detector,a tone detector and the correlated complex signal analysis module. An enhanced version of the original VAD is the AMR option2VAD.It uses parameters of the speech encoder being more robust against envi-ronmental noise than AMR1and G.729.These VADs have been used extensively in the open literature as a reference for assessing the perfor-mance of new algorithms.Marzinzik and Kol-lmeier(2002)proposed a new VAD algorithm for noise spectrum estimation based on tracking the power envelope dynamics.The algorithm was compared to the G.729VAD by means of the re-ceiver operating characteristic(ROC)curves showing a reduction in the non-speech false alarm rate together with an increase of the non-speech hit rate for a representative set of noises and condi-tions.Beritelli et al.(1998)proposed a fuzzy VAD with a pattern matching block consisting of a set of six fuzzy rules.The comparison was made using objective,psychoacoustic,and subjective parame-ters being G.729and AMR VADs used as a ref-erence(Beritelli et al.,2002).Nemer et al.(2001)J.Ram ırez et al./Speech Communication42(2004)271–287273presented a robust algorithm based on higher order statistics(HOS)in the linear prediction cod-ing coefficients(LPC)residual domain.Its perfor-mance was compared to the ITU-T G.729B VAD in various noise conditions,and quantified using the probability of correct and false classifications.The selection of an adequate feature vector for signal detection and a robust decision rule is a challenging problem that affects the performance of VADs working under noise conditions.Most algorithms are effective in numerous applications but often cause detection errors mainly due to the loss of discriminating power of the decision rule at low SNR levels(ITU,1996;ETSI,1999).For example,a simple energy level detector can work satisfactorily in high signal-to-noise ratio condi-tions,but would fail significantly when the SNR drops.Several algorithms have been proposed in order to palliate these drawbacks by means of the definition of more robust decision rules.This paper explores a new alternative towards improv-ing speech detection robustness in adverse envi-ronments and the performance of speech recognition systems.A new technique for speech/ non-speech detection(SND)using long-term information about the speech signal is studied.The algorithm is evaluated in the context of the AURORA project(Hirsch and Pearce,2000; ETSI,2000),and the recently approved Advanced Front-end standard(ETSI,2002)for distributed speech recognition.The quantifiable benefits of this approach are assessed by means of an exhaustive performance analysis conducted on the AURORA TIdigits(Hirsch and Pearce,2000)and SpeechDat-Car(SDC)(Moreno et al.,2000;No-kia,2000;Texas Instruments,2001)databases, with standard VADs such as the ITU G.729(ITU, 1996),ETSI AMR(ETSI,1999)and AFE(ETSI, 2002)used as a reference.2.VAD based on the long-term spectral divergenceVADs are generally characterized by the feature selection,noise estimation and classification methods.Various features and combinations of features have been proposed to be used in VAD algorithms(ITU,1996;Beritelli et al.,1998;Sohn and Sung,1998;Nemer et al.,2001).Typically, these features represent the variations in energy levels or spectral difference between noise and speech.The most discriminating parameters in speech detection are the signal energy,zero-cross-ing rates,periodicity measures,the entropy,or linear predictive coding coefficients.The proposed speech/non-speech detection algorithm assumes that the most significant information for detecting voice activity on a noisy speech signal remains on the time-varying signal spectrum magnitude. It uses a long-term speech window instead of instantaneous values of the spectrum to track the spectral envelope and is based on the estimation of the so-called long-term spectral envelope(LTSE). The decision rule is then formulated in terms of the long-term spectral divergence(LTSD)between speech and noise.The motivations for the pro-posed strategy will be clarified by studying the distributions of the LTSD as a function of the long-term window length and the misclassification errors of speech and non-speech segments.2.1.Definitions of the LTSE and LTSDLet xðnÞbe a noisy speech signal that is seg-mented into overlapped frames and,Xðk;lÞits amplitude spectrum for the k band at frame l.The N-order long-term spectral envelope is defined as LTSE Nðk;lÞ¼max f Xðk;lþjÞg j¼þNj¼ÀNð1ÞThe N-order long-term spectral divergence be-tween speech and noise is defined as the deviation of the LTSE respect to the average noise spec-trum magnitude NðkÞfor the k band,k¼0;1;...;NFFTÀ1,and is given byLTSD NðlÞ¼10log101NFFTXNFFTÀ1k¼0LTSE2ðk;lÞN2ðkÞ!ð2ÞIt will be shown in the rest of the paper that the LTSD is a robust feature defined as a long-term spectral distance measure between speech and noise.It will also be demonstrated that using long-term speech information increases the speech detection robustness in adverse environments and,274J.Ram ırez et al./Speech Communication42(2004)271–287when compared to VAD algorithms based on instantaneous measures of the SNR level,it will enable formulating noise robust decision rules with improved speech/non-speech discrimination.2.2.LTSD distributions of speech and silenceIn this section we study the distributions of the LTSD as a function of the long-term window length(N)in order to clarify the motivations for the algorithm proposed.A hand-labelled version of the Spanish SDC database was used in the analysis.This database contains recordings from close-talking and distant microphones at different driving conditions:(a)stopped car,motor run-ning,(b)town traffic,low speed,rough road and (c)high speed,good road.The most unfavourable noise environment(i.e.high speed,good road)was selected and recordings from the distant micro-phone were considered.Thus,the N-order LTSD was measured during speech and non-speech periods,and the histogram and probability distri-butions were built.The8kHz input signal was decomposed into overlapping frames with a10-ms window shift.Fig.1shows the LTSD distributions of speech and noise for N¼0,3,6and9.It is derived from Fig.1that speech and noise distri-butions are better separated when increasing the order of the long-term window.The noise is highly confined and exhibits a reduced variance,thus leading to high non-speech hit rates.This fact can be corroborated by calculating the classification error of speech and noise for an optimal Bayes classifier.Fig.2shows the classification errors as a function of the window length N.The speech classification error is approximately reduced by half from22%to9%when the order of the VAD is increased from0to6frames.This is motivated by the separation of the LTSD distributions that takes place when N is increased as shown in Fig.1. On the other hand,the increased speech detection robustness is only prejudiced by a moderate in-crease in the speech detection error.According to Fig.2,the optimal value of the order of the VADJ.Ram ırez et al./Speech Communication42(2004)271–287275would be N¼6.As a conclusion,the use of long-term spectral divergence is beneficial for VAD since it reduces importantly misclassification er-rors.2.3.Definition of the LTSD VAD algorithmAflowchart diagram of the proposed VADalgorithm is shown in Fig.3.The algorithm can be described as follows.During a short initialization period,the mean noise spectrum NðkÞ(k¼0;1;...;NFFTÀ1)is estimated by averaging the noise spectrum magnitude.After the initialization period,the LTSE VAD algorithm decomposes the input utterance into overlapped frames being their spectrum,namely Xðk;lÞ,processed by means of a ð2Nþ1Þ-frame window.The LTSD is obtained by computing the LTSE by means of Eq.(1).The VAD decision rule is based on the LTSD calcu-lated using Eq.(2)as the deviation of the LTSE with respect to the noise spectrum.Thus,the algorithm has an N-frame delay since it makes a decision for the l-th frame using a(2Nþ1)-frame window around the l-th frame.On the other hand, thefirst N frames of each utterance are assumed to be non-speech periods being used for the initiali-zation of the algorithm.The LTSD defined by Eq.(2)is a biased mag-nitude and needs to be compensated by a given offset.This value depends on the noise spectral variance and the order of the VAD and can be estimated during the initialization period or as-sumed to take afixed value.The VAD makes the SND by comparing the unbiased LTSD to an adaptive threshold c.The detection threshold is adapted to the observed noise energy E.It is as-sumed that the system will work at different noisy conditions characterized by the energy of the background noise.Optimal thresholds c0and c1 can be determined for the system working in the cleanest and noisiest conditions.These thresholds define a linear VAD calibration curve that is used during the initialization period for selecting an adequate threshold c as a function of the noise energy E:c¼cE6E0c0Àc1E0ÀE1Eþc0Àc0Àc11ÀE1=E0E0<E<E1c1E P E18><>:ð3Þwhere E0and E1are the energies of the back-ground noise for the cleanest and noisiest condi-276J.Ram ırez et al./Speech Communication42(2004)271–287tions that can be determined examining the speech databases being used.A high speech/non-speech discrimination is ensured with this model since silence detection is improved at high and medium SNR levels while maintaining a high precision detecting speech periods under high noise condi-tions.The VAD is defined to be adaptive to time-varying noise environments with the following algorithm for updating the noise spectrum NðkÞduring non-speech periods being used:Nðk;lÞ¼a Nðk;lÀ1Þþð1ÀaÞN KðkÞif speech pause is detectedNðk;lÀ1Þotherwise8>><>>:ð4Þwhere N K is the average spectrum magnitude over a K-frame neighbourhood:N KðkÞ¼12Kþ1X Kj¼ÀKXðk;lþjÞð5ÞFinally,a hangover was found to be beneficial to maintain a high accuracy detecting speech periods at low SNR levels.Thus,the VAD delays the speech to non-speech transition in order to prevent low-energy word endings being misclassified as silence.On the other hand,if the LTSD achieves a given threshold LTSD0the hangover mechanism is turned offto improve non-speech detection when the noise level is low.Thus,the LTSE VAD yields an excellent classification of speech and pause periods.Examples of the operation of the LTSE VAD on an utterance of the Spanish SDC data-base are shown in Fig.4a(N¼6)and Fig.4b (N¼0).The use of a long-term window for for-mulating the decision rule reports quantifiable benefits in speech/non-speech detection.It can be seen that using a6-frame window reduces the variability of the LTSD in the absence of speech, thus yielding to reduced noise variance and better speech/non-speech discrimination.Speech detec-tion is not affected by the smoothing process in-volved in the long-term spectral estimation algorithm and maintains good margins that cor-rectly separate speech and pauses.On the other hand,the inherent anticipation of the VAD deci-sion contributes to reduce speech clipping errors.3.Experimental frameworkSeveral experiments are commonly conducted to evaluate the performance of VAD algorithms. The analysis is normally focused on the deter-mination of misclassification errors at different SNR levels(Beritelli et al.,2002;Marzinzik and Kollmeier,2002),and the influence of the VAD zdecision on speech processing systems(Bouquin-Jeannes and Faucon,1995;Karray and Martin, 2003).The experimental framework and the objective performance tests conducted to evaluate the proposed algorithm are described in this sec-tion.3.1.Speech/non-speech discrimination analysisFirst,the proposed VAD was evaluated in terms of the ability to discriminate between speech and pause periods at different SNR levels.The original AURORA-2database(Hirsch and Pe-arce,2000)was used in this analysis since it uses the clean TIdigits database consisting of sequences of up to seven connected digits spoken by Ameri-can English talkers as source speech,and a selec-tion of eight different real-world noises that have been artificially added to the speech at SNRs of20, 15,10,5,0and)5dB.These noisy signals have been recorded at different places(suburban train, crowd of people(babble),car,exhibition hall, restaurant,street,airport and train station),and were selected to represent the most probable application scenarios for telecommunication ter-minals.In the discrimination analysis,the clean TIdigits database was used to manually label each utterance as speech or non-speech frames for ref-erence.Detection performance as a function of the SNR was assessed in terms of the non-speech hit-rate(HR0)and the speech hit-rate(HR1)defined as the fraction of all actual pause or speech frames that are correctly detected as pause or speech frames,respectively:HR0¼N0;0NHR1¼N1;1N1ð6Þwhere N refand N ref1are the number of real non-speech and speech frames in the whole database,J.Ram ırez et al./Speech Communication42(2004)271–287277respectively,while N0;0and N1;1are the number of non-speech and speech frames correctly classified.The LTSE VAD decomposes the input signal sample at8kHz into overlapping frames with a 10-ms shift.Thus,a13-frame long-term window and NFFT¼256was found to be good choices for the noise conditions being studied.Optimal detection threshold c0¼6dB and c1¼2:5dB278J.Ram ırez et al./Speech Communication42(2004)271–287were determined for clean and noisy conditions, respectively,while the threshold calibration curve was defined between E0¼30dB(low noise energy) and E1¼50dB(high noise energy).The hangover mechanism delays the speech to non-speech VAD transition during8frames while it is deactivated when the LTSD exceeds25dB.The offset isfixed and equal to5dB.Finally,it is used a forgotten factor a¼0:95,and a3-frame neighbourhood (K¼3)for the noise update algorithm.Fig.5provides the results of this analysis and compares the proposed LTSE VAD algorithm to standard G.729,AMR and AFE VADs in terms of non-speech hit-rate(Fig.5a)and speech hit-rate (Fig.5b)for clean conditions and SNR levels ranging from20to)5dB.Note that results for the two VADs defined in the AFE DSR standard (ETSI,2002)for estimating the noise spectrum in the Wienerfiltering stage and non-speech frame-dropping are provided.Note that the results shown in Fig.5are averaged values for the entire set of noises.Thus,the following conclusions can be derived from Fig.5about the behaviour of the different VADs analysed:(i)G.729VAD suffers poor speech detection accu-racy with the increasing noise level while non-speech detection is good in clean conditions (85%)and poor(20%)in noisy conditions. (ii)AMR1yields an extreme conservative behav-iour with high speech detection accuracy for the whole range of SNR levels but very poor non-speech detection results at increasing noise levels.Although AMR1seems to be well suited for speech detection at unfavourable noise conditions,its extremely conservative behaviour degrades its non-speech detection accuracy being HR0less than10%below10 dB,making it less useful in a practical speech processing system.(iii)AMR2leads to considerable improvements over G.729and AMR1yielding better non-speech detection accuracy while still suffering fast degradation of the speech detection abil-ity at unfavourable noisy conditions.(iv)The VAD used in the AFE standard for esti-mating the noise spectrum in the Wienerfilter-ing stage is based in the full energy band and yields a poor speech detection performance with a fast decay of the speech hit-rate at low SNR values.On the other hand,the VAD used in the AFE for frame-dropping achieves a high accuracy in speech detection but moderate results in non-speech detection. (v)LTSE achieves the best compromise among the different VADs tested.It obtains a good behaviour in detecting non-speech periods as well as exhibits a slow decay in performance at unfavourable noise conditions in speech detection.Table1summarizes the advantages provided by the LTSE-based VAD over the different VAD methods being evaluated by comparing them in terms of the average speech/non-speech hit-rates. LTSE yields a47.28%HR0average value,while the G.729,AMR1,AMR2,WF and FD AFE VADs yield31.77%,31.31%,42.77%,57.68%and 28.74%,respectively.On the other hand,LTSE attains a98.15%HR1average value in speechJ.Ram ırez et al./Speech Communication42(2004)271–287279detection while G.729,AMR1,AMR2,WF and FD AFE VADs provide93.00%,98.18%,93.76%, 88.72%and97.70%,respectively.Frequently VADs avoid losing speech periods leading to an extremely conservative behaviour in detecting speech pauses(for instance,the AMR1VAD). Thus,in order to correctly describe the VAD performance,both parameters have to be consid-ered.Thus,considering together speech and non-speech hit-rates,the proposed VAD yielded the best results when compared to the most represen-tative VADs analysed.3.2.Receiver operating characteristic curvesAn additional test was conducted to compare speech detection performance by means of the ROC curves(Madisetti and Williams,1999),a frequently used methodology in communications based on the hit and error detection probabilities (Marzinzik and Kollmeier,2002),that completely describes the VAD error rate.The AURORA subset of the original Spanish SDC database (Moreno et al.,2000)was used in this analysis. This database contains4914recordings using close-talking and distant microphones from more than160speakers.As in the whole SDC database, thefiles are categorized into three noisy condi-tions:quiet,low noisy and highly noisy conditions, which represent different driving conditions and average SNR values of12,9and5dB.The non-speech hit rate(HR0)and the false alarm rate(FAR0¼100)HR1)were determined in each noise condition for the proposed LTSE VAD and the G.729,AMR1,AMR2,and AFE VADs,which were used as a reference.For the calculation of the false-alarm rate as well as the hit rate,the‘‘real’’speech frames and‘‘real’’speech pauses were determined by hand-labelling the database on the close-talking microphone.The non-speech hit rate(HR0)as a function of the false alarm rate(FAR0¼100)HR1)for 0<c610dB is shown in Fig.6for recordings from the distant microphone in quiet,low and high noisy conditions.The working point of the adaptive LTSE,G.729,AMR and the recently approved AFE VADs(ETSI,2002)are also in-cluded.It can be derived from these plots that: (i)The working point of the G.729VAD shifts tothe right in the ROC space with decreasing SNR,while the proposed algorithm is less af-fected by the increasing level of background noise.(ii)AMR1VAD works on a low false alarm rate point of the ROC space but it exhibits poor non-speech hit rate.(iii)AMR2VAD yields clear advantages over G.729and AMR1exhibiting important reduction in the false alarm rate when com-pared to G.729and increase in the non-speech hit rate over AMR1.(iv)WF AFE VAD yields good non-speech detec-tion accuracy but works on a high false alarm rate point on the ROC space.It suffers rapid performance degradation when the driving conditions get noisier.On the other hand, FD AFE VAD has been planned to be conser-vative since it is only used in the DSR stan-dard for frame-dropping.Thus,it exhibits poor non-speech detection accuracy working on a low false alarm rate point of the ROC space.(v)LTSE VAD yields the lowest false alarm rate for afixed non-speech hit rate and also,the highest non-speech hit rate for a given false alarm rate.The ability of the adaptive LTSE VAD to tune the detection threshold by means the algorithm described in Eq.(3)en-ables working on the optimal point of the ROC curve for different noisy conditions.Thus,the algorithm automatically selects theTable1Average speech/non-speech hit rates for SNR levels ranging from clean conditions to)5dBVADG .729AMR1AMR2AFE(WF)AFE(FD)LTSEHR0(%)31.7731.3142.7757.6828.7447.28 HR1(%)93.0098.1893.7688.7297.7098.15 280J.Ram ırez et al./Speech Communication42(2004)271–287。
附录:中英文翻译15 S p eech S ig n a l P r ocessi ng15 .3 Ana l y si s a nd S y n the sisJ esse W. FussellA fte r an acousti c spee ch s i gnal i s conve rte d to an ele ctri cal si gnal by a mi crophone, i t m ay be desi rable to anal yze the ele ctri cal si gnal to e stim a te some time -v ary i ng paramete rs whi ch provide i nform ati on about a model of the speech producti on me chanism. S peech a na ly sis i s the process of e stim ati ng such paramete rs. S imil arl y , g ive n some parametri c model of spee ch production and a se que nce of param eters for that m ode l, speech sy n thesi s is the proce ss of cre ating an ele ctri cal s i gnal w hi ch approxim ate s spe ech. W hile anal y si s and sy nthesis te chni ques m ay be done eithe r on the continuous si gnal or on a sam pled ve rsi on of the si gnal, most mode rn anal y sis and sy nthesis methods are base d on di gital si gnal processing.A ty pi cal spee ch production m odel is shown in Fi g . 15 .6. In this m odel the output of the ex citati on function is scale d by the gai n paramete r and then filtere d to produce spee ch. A ll of these functions are ti me -v ary ing.F IGUR E 15 .6 A ge ne ra l spee ch production model.F IGUR E 1 5 .7 W ave form of a spoken phone me /i/ as i n beet.For m any models, the parame ters are v arie d at a pe riodi c rate, ty pi call y 5 0 to 100 time s pe r se cond. M ost spee ch inform ati on is containe d i n the porti on of the si gnal bel ow about 4 k Hz.The ex citati on is usuall y modele d as e ithe r a mi xture or a choi ce of random noise and periodi c w aveform . For hum an spee ch, v oi ced e x citati on occurs w hen the vocal fol ds in the lary nx vibrate; unvoi ce d e x citati on occurs at constri cti ons i n the vocal tract w hi ch cre ate turbulent a i r fl ow [Fl anagan, 1965] . The rel ati ve mi x of these tw o ty pe s of ex citati on is terme d “v oicing .”In addition, the periodi c e xcitation i s characte rized by a fundame ntal fre quency , te rmed p itch or F0 . The ex citati on is scaled by a factor de si gne d to produce the prope r ampli tude or level of the spee ch si gnal . The scaled ex citati on function i s then fi ltere d to produce the prope r spe ctral characte risti cs. W hile the filter m ay be nonli near, i t i s usuall y m odele d as a li near function.An a l y sis of Excit a t ionIn a si m plified form, the ex citati on function m ay be consi dere d to be purel y pe ri odi c, for v oi ced speech, or purel y random, for unvoi ce d. T hese tw o states correspond to voi ce d phoneti c cl asse s such as vow els and nasals and unvoi ce d sounds such as unvoi ce d fri catives. This binary voi ci ng m odel is an ove rsi mplifi cation for sounds such as v oi ced fri cati ves, whi ch consist of a mi xture of peri odi c and random compone nts. Fi gure 1 5.7 is an ex ample of a time w ave form of a spoke n /i/ phoneme , w hi ch is w ell m odeled by onl y pe riodi c e x citati on.B oth ti me dom ai n and frequency dom ai n anal y s is te chni ques have bee n used to esti m ate the de gree of voi ci ng for a short se gme nt or frame of spee ch. One ti me dom ain fe ature, te rme d the ze ro crossing rate, i s the numbe r of ti mes the si gnal changes si gn in a short i nte rv al . As show n i n Fi g . 1 5. 7, the z ero crossing rate for voi ce d sounds i s rel ati vel y low . S i nce unvoi ce d spee ch ty pi call y has a la rger proportion of hi gh-frequency energy than voi ce d spee ch, the ratio of high-fre que ncy to low -frequency e nergy is a fre que ncy dom ai n techni que that provi des i nform ation on voi ci ng.A nothe r measure use d to estim ate the de gree of voi ci ng is the autocorrel ation functi on, w hi ch is de fine d fora sam pled speech se gment, S , asw here s( n) is the val ue of the nth sam ple w i t hi n the se gme nt of le ngth N. S ince the autocorrel ati on function of a periodi c functi on is i tsel f pe ri odi c, voi ci ng can be e sti mated from the de gree of pe ri odi city of the autocorrel ati on function. Fi gure 15. 8 i s a graph of the nonne gati ve te rms of the autocorrel ation functi on for a 64 -ms frame of the w aveform of Fi g . 15. 7. Ex cept for the de cre ase i n amplitude w ith i ncre asi ng lag, whi ch results from the re ctangul ar wi ndow functi on w hi ch delim its the se gment, the autocorre lati on function i s see n to be quite pe riodi c for thi s voi ce d utterance.F IGUR E 1 5 .8 A utocorrel ati on functi on of one frame of /i /.If an anal y sis of the voicing of the spee ch si gnal i ndi cate s a voice d or pe ri odi c com ponent is prese nt, another ste p i n the anal y si s process m ay be to estim ate the freque ncy ( or pe ri od) of the voi ce d com ponent. There are a num ber of w ay s in whi ch this m ay be done. One is to me asure the ti me l apse between pe aks i n the time dom ai n si gnal. For ex am ple i n Fi g . 15.7 the m aj or peaks are separate d by about 0. 00 71 s, for a fundame ntal fre quency of about 1 41 Hz. Note, it w oul d be quite possible to e rr i n the e stim ate of fundame ntal fre quency by mistaki ng the sm aller pe aks that occur betwee n the m a jor pe aks for the m aj or pe aks. These sm alle r pe aks are produced by resonance i n the v ocal tract w hi ch, i n this e x ample , happen to be at about twi ce the ex ci tationfre quency . T his ty pe of e rror w ould re sult in an e sti m ate of pitch approxi m atel y tw i ce the corre ct fre quency .The di stance betw ee n m ajor pe ak s of the autocorrel ation functi on is a closel y rel ate d fe ature that isfre quentl y use d to esti m ate the pitch pe ri od. In Fi g . 15. 8, the di stance between the m aj or peaks in the autocorrel ati on function i s about 0. 00 71 s. Esti m ates of pi tch from the autocorrel ation functi on are alsosusce pti ble to mistaking the fi rst vocal track resonance for the g l ottal e x citati on freque ncy.The absol ute m agnitude di ffere nce functi on ( AM DF), de fi ned as,is another functi on w hi ch is often use d i n estim ating the pitch of voi ce d spee ch. A n ex ample of the AM DF is shown in Fi g. 15. 9 for the same 6 4 -m s frame of the /i / phoneme. How e ve r, the minim a of the AM DF i s used as an indi cator of the pitch pe ri od. The AM DF has been show n to be a good pitch pe riod i ndi cator [R oss et al. ,19 74 ] and does not requi re multi pli cati ons.F ou r ie r An a ly sisOne of the m ore comm on processe s for e stim ating the spe ctrum of a se gme nt of spee ch is the Fourie r transform [ Oppenheim and S chafer, 1 97 5 ]. T he Fourie r transform of a seque nce is m athem ati call y de fine d asw here s( n) represe nts the terms of the sequence. The short-ti me Fourier transform of a seque nce i s atimede pende nt functi on, de fi ned asF IGUR E 1 5 .9 A bsolute m agnitude diffe rence functi on of one frame of /i/.w here the w indow function w( n) is usuall y ze ro ex ce pt for some fi nite range, and the vari able m is used to select the se cti on of the se que nce for anal y sis . The di screte Fourier transform ( DFT) i s obtai ned by uni forml y sam pling the short-ti me Fourie r transform i n the fre quency dime nsi on. Thus an N-point DFT is computed usi ng Eq. ( 15 .1 4),w here the set of N sample s, s( n), m ay have first been multiplie d by a window function. A n e x am ple of the m agnitude of a 5 12 -poi nt DFT of the w aveform of the /i/ from Fi g . 15. 10 i s show n i n Fi g. 15 .10. Note for this fi gure, the 512 poi nts in the se que nce have been m ulti plied by a Ham ming w i ndow de fi ned byF IGUR E 1 5 .1 0 M agnitude of 51 2-point FFT of Ham mi ng window e d /i/.S ince the spe ctral characteristi cs of spee ch m ay change dram a ti call y in a fe w milli se conds, the le ngth, ty pe, and l ocation of the wi ndow function are im portant consi derati ons. If the w indow is too long, changi ng spe ctral characte risti cs m ay cause a blurred result; if the w indow is too short, spe ctral i naccuracies re sult. A Ham ming wi ndow of 16 to 32 m s durati on is com m onl y use d for spee ch anal ysis.S everal characte risti cs of a speech utte rance m ay be dete rmine d by ex amination of the DFT m agnitude. In Fi g. 1 5. 10, the DFT of a v oi ce d utterance contai ns a se ries of sharp pe aks i n the fre quency dom ai n. T hese peaks, caused by the peri odi c sampl ing acti on of the g lottal ex ci tation, are separated by the fundame ntal fre quency w hi ch is about 141 Hz, i n this e x am ple. In addi tion, broader pe aks can be se en, for e x ample a t about 300 Hz and at about 2300 Hz. T hese broad peaks, calle d formants, result from resonances in the vocal tract.L in ea r P r ed ictive An a l y sisGi ven a sam pled ( discrete-ti me) si gnal s( n), a pow e rful and ge ne ral parame tri c model for ti me se ries anal y s is isw here s( n) i s the output and u( n) i s the input ( perhaps unknow n). The model parameters are a( k) for k = 1, p, b( l ) for l = 1, q, and G. b( 0) is assume d to be unity. Thi s m odel , describe d as an autore g ressi ve m ov ing average ( AR M A) or pole -ze ro m odel , forms the foundation for the anal y s is method te rme d li ne ar pre di ction. An autore gressive ( AR ) or all -pole model, for w hi ch all of the “b”coe ffi cie nts ex ce pt b( 0 ) are ze ro, i s freque ntl y used for spee ch anal y si s [M arkel and Gray, 1976 ].In the standard A R formul ati on of li ne ar predi ction, the model paramete rs are sele cte d to mi ni mize the me an-square d error betw ee n the m ode l and the speech data. In one of the v ariants of line ar pre di cti on, the autocorrel ati on method, the mi nimiz ation is carrie d out for a wi ndowe d se gment of data. In the autocorrel ation method, mi nimizi ng the me an-square e rror of the ti me dom ai n sam ples is equivalent to mi nimizing the inte grate d rati o of the si gnal spectrum to the spe ctrum of the all -pole m odel. Thus, line ar predi ctive anal y sis i s a good method for spe ctral anal y sis w hene ver the si gnal is produce d by an a ll -pol e sy ste m. M ost spee ch sounds fi t thi s model w ell .One ke y consi deration for li near pre dicti ve anal y si s is the order of the model, p. For spee ch, if the orde r is too sm all , the form ant s tructure is not we ll re pre sente d. If the order i s too l arge , pitch pul ses as well as form ants be g in to be represe nted. Tenth- or tw el fth-orde r anal y si s is ty pi cal for spe ech. Fi gures 1 5. 11 and 15.1 2 provi de e x amples of the spe ctrum produced by ei ghth-orde r and si xteenth-order line ar predi cti ve anal y sis of the /i / w ave form of Fi g . 1 5.7 . Fi gure 15 .11 show s there to be three form ants at fre que ncies of about 30 0,23 00, and 3200 Hz , whi ch are ty pi cal for an /i/.H om om or p h ic ( C epst r a l) A n a l y si sFor the speech m odel of Fi g. 15. 6, the e x citati on and filter i mpulse response are convol ved to produce thespee ch. One of the problem s of speech anal y sis is to separate or de convolve the spee ch into the se tw o com ponents. One such te chni que is called hom omorphi c filte ri ng [ Oppe nheim and S chafer, 1968 ]. The characte risti c sy ste m for a sy ste m for hom om orphi c deconvol ution conve rts a convolution operation to anadditi on ope ration. The output of such a characteristi c sy stem is calle d the com ple x cep str u m . The com plexcepstrum i s defi ned as the i nve rse Fourie r transform of the com plex logarithm of the Fourie r transform of the input. If the i nput sequence is mi nim um phase ( i .e., the z-transform of the input se que nce has no poles or ze ros outside the unit ci rcle), the se quence can be represe nted by the real portion of the transforms. Thus, the re al cepstrum can be com pute d by cal cul ati ng the inve rse Fourie r transform of the log- spe ctrum of the input.F IGUR E 15 .11 Eig hth-orde r li ne ar predi ctive anal y sis of an “i”.F IGUR E 1 5 .1 2 S ixteenth-orde r l ine ar pre di cti ve anal y si s of an “i”.Fi gure 1 5.1 3 show s an e x ample of the cepstrum for the voi ced /i/ utterance from Fi g. 15.7 . The cepstrum of such a voi ce d utterance i s characte rized by rel ati vel y la rge v alues in the fi rst one or tw o milli se conds as w ell asby pulses of de cayi ng am plitude s at m ulti ples of the pitch pe riod. T he fi rst tw o of these pulses can cle arl y be seen i n Fi g . 15. 13 at ti me l ags of 7 .1 and 1 4. 2 ms. The locati on and ampl itudes of these pulses m ay be used to estim ate pitch and v oi cing [R abi ner and S chafe r, 1978 ].In additi on to pitch and voi cing estim ation, a smooth log m agnitude function m ay be obtaine d bywi ndow i ng or “l i fte ring ”the ce pstrum to eli mi nate the te rm s w hi ch contain the pitch i nform ation. Fi gure 15. 14 is one such smoothed spectrum . It w as obtai ned from the DFT of the ce pstrum of Fi g . 15.1 3 afte r fi rst setting all terms ofthe cepstrum to ze ro ex ce pt for the fi rst 16.F IGUR E 15 .13 R eal ce pstrum of /i /.F IGUR E 15 .14 S moothe d spe ctrum of /i/ from 16 poi nts of ce pstrum.S p eech S y nth esisS pee ch sy nthesis is the cre ati on of spee ch-li ke w aveform s from te xtual w ords or sy m bols. In gene ral, the spee ch sy nthesi s process m ay be divi ded into three le vels of processi ng [ Kl att, 1 98 2] . T he first le vel transform s the te xt i nto a se ries of acousti c phoneti c sy m bols, the se cond transforms those sy mbols to。