
图表式作文的几种形式:
一是以表格形式,将统计的数据或被说明的事物直接用表格形式体现出来,即统计表。Statistics table
【例析】请你根据下表提供的信息描述近5年人们饮食的变化,并说明变化的原因.
二是以图形形式
A 表示数据变化的曲线图;
B 表示数据的大小或数量之间的差异的柱状图;
C 表示总体内部结构变化的扇形图。
Curve diagram;Bar chart ;Pie chart
●【技巧点拨】
● 1.读懂柱状图坐标刻线及图例说明与文字,比较柱状高低和颜色表示的内容及数据。
● 2.学会看趋势、找规律,从整体看图表有何发展变化,找出特点、规律。
● 3.引用图表包含信息,使你的文章“由图而发”,言之有据。
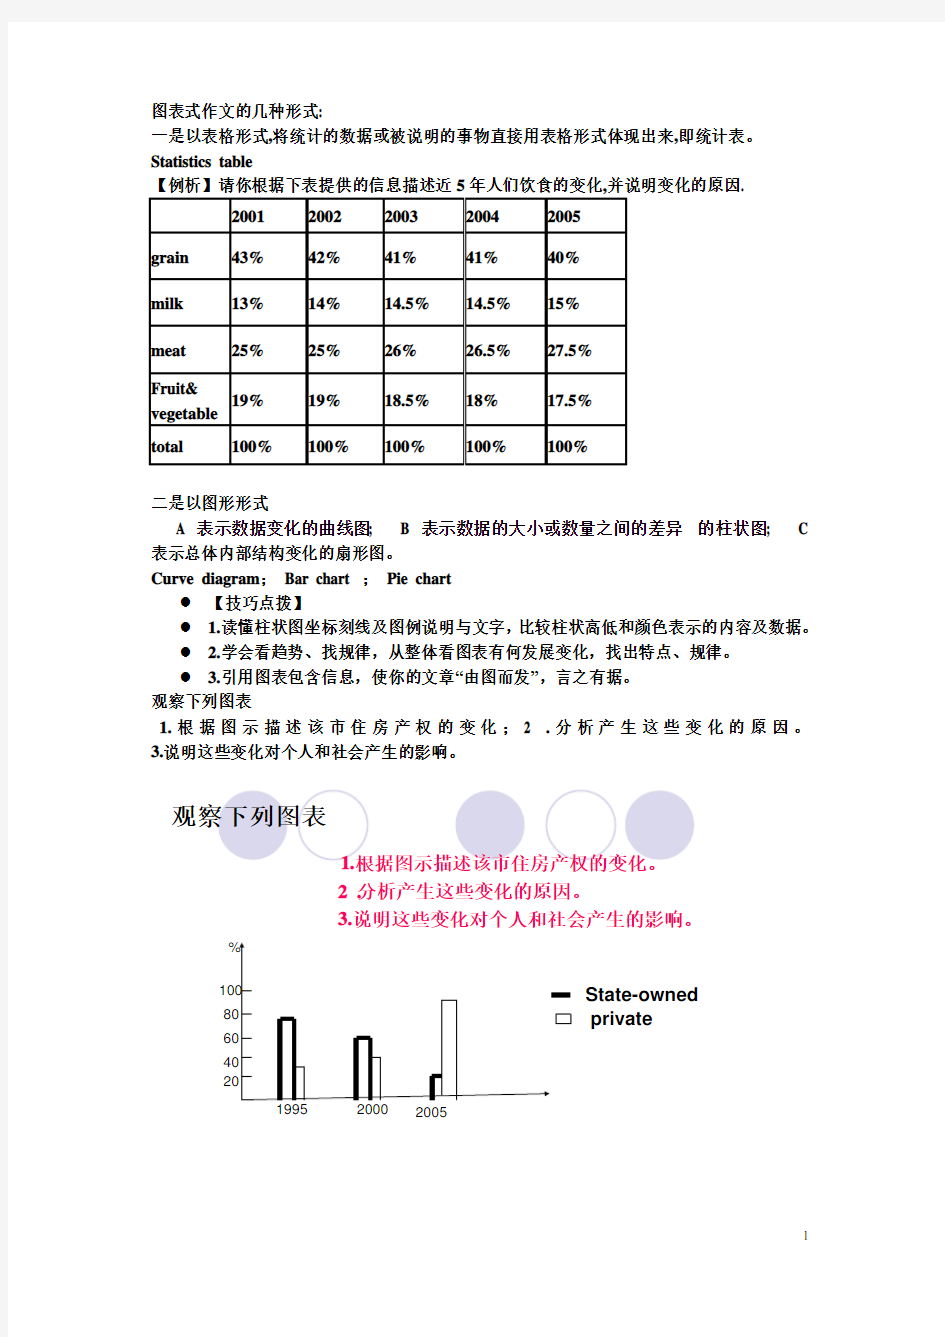
观察下列图表
1.根据图示描述该市住房产权的变化;2 .分析产生这些变化的原因。
3.说明这些变化对个人和社会产生的影响。
●Ownership of Houses in a Big City in China
●As can be seen from the chart,ownership of houses in a big city in China changed a
lot in the past ten years. In 1995,75 percent of the houses were state-owned. Five years later,the rate of state-owned houses to private ones was 3 to 2. But from then on,the ownership of houses changed rapidly and so far 80 percent of houses have been private.
●What caused the changes?(What are the major reasons responsible for (behind) the
changes?) There might have been two main reasons. First,from 1995 up to now, people's living standards have been improving (on the rise). Most of them can afford to buy their own houses. Second,most people do not save a lot of money in the bank for their children as their parents did in the past. They want to have their own home and enjoy a better life.
●Such changes have had a great effect on the development of society. It does good to both
the citizens and the government
Good points
● 1.structure
●第一段:描述图表,得出结论。
●第二段:紧扣主题,根据图表比较分析原因,论证结论。
●第三段:发表议论,提出自己的看法。
● 2.link words
技巧指导
图表式作文写作分三步:
第一、开门见山地点明本图表所反映的主题
经常使用的词汇有:table, chart, figure, graph, describe, tell, show, represent等等。
●【常用句式】
● 1. As can be seen from the chart,...As is shown in the chart,...
● 2. The chart shows that about 60 percent of students want to go to college...
● 3. From the graph/data/results/information above,
● 4. The graph shows the changes in the number of...over the period from...to...
● 5. Compared with...,the number of the students of...
第二、分析数据间的主要差异及趋势,然后描写
rise drop reduce increase decrease fall
while but on the contrary however compare... to/ with... in contrast to as...as the same as similar to different from, difference between among more than less than
第三、归纳总结或发表评论。有时第三步可省略
In a word, in short,
Generally speaking,
It's clear from the chart that...,
We can draw the conclusion that..., We can learn/know...等等。
第一步:点明此表格所表明的主题
As can be seen from the table, there are a lot of changes in people’s diet in the past five years.
第二步:观察图表中数据的增减总趋势, 阐明原因
2. Grain, the main food of the most people in China, is now playing a less important role and the amount of fruit and vegetables in the average people’s diet has also dropped by 1.5 percent from 2001 to 2005.
At the same period of time, however, the amount of milk and meat has been on the rise.
4. These changes are t he signs of the improvement in people’s lives
Grain, the main food of the most people in China for thousands of years, is now playing a less important role and the amount of fruit and vegetables in the average people’s diet has also dropped by 1.5 percent from 2001 to 2005. In contrast to them, the amount of milk and meat has increased by 2 percent and 2.5percent.It is clear from the table that great improvement in people’s lives has been made in these years.
第三步:归纳总结并得出结论。
In a word ,there is no doubt th at there will be great changes in people’s diet in the future.
In a word ,there is no doubt that people will enjoy a more scientific and balanced diet in the future and much happier life.
A possible version
This table displays the result of a survey on how students spend their two-day weekend. It says that few students are glued to their schoolwork any more. Instead, they prefer to surf on the internet, watch TV, go shopping rather than involve in sports games. Library and interest groups are available but not favorable.
.
Personally I think, students are now freed from heavy burden of study, but their spare time is not well arranged .They are expected to spend more time on what they learn instead of hanging out. More time should be spent not only on green field but also in the libraries to build up themselves physically and mentally .
Besides, more interest groups should be established for students to broaden their horizons and sharpen their brains so that they can become more creative eventually .All these will contribute a lot to a well-informed and highly qualified college students.
In conclusion, students should be more scheduled with colorful and fruitful activities
●图表作文注意事项1.图表和数据内容不必全部描述
● 2.善于抓住总的规律、趋势,归纳增减率;
● 3.时态:特定时间用过去时,经常出现的情况和自己的评论用一般现在时。
● 4.要适当运用一些高级词汇并灵活使用图标类写作常用的经典好句型
语意要合情合理,过渡自然;语句要有简有繁,随“意”而安
语法要结构正确,无懈可击;语言要地道流畅,书写规范
根据所给图表,用5句话写一篇题为“电影与电视”的短文。
短文须包括以下要求:
A. 电影观众人数呈逐年下降趋势;
B. 电视观众人数越来越多(原因:方便、经济、选
择范围);
C. 然而还是有人喜欢看电影(原因:气氛、娱乐)。
参考词汇: decrease v.下降
atmosphere n. 氛围 entertainment n. 娱乐 film goer/TV watcher
电影/电视观众
1020304050607080901001995
1997
1999
2001
2003
2005
A
B
(a): Number of TV watchers (b): Number of film goers Number of People (in thousand)
参考范文:
1 From the table, we can see that film is giving way to TV in our city.
2 For example, in 1992, there were only less than 10 thousand TV watchers, and the number of film goers was nearly 90,000. However, as time went on, the trend changed abruptly, the number of movie goers plummeted, while that of the TV watchers rose vertically. In 2002, we had nearly 1 million TV watchers but only about 10 thousand film goers.
? 3. Possible reasons behind such a considerable change can be summarized as
follows.
? In the first place, televisions are quite common nowadays and so more and
more people turn to TV because it is convenient and cheap and watchers have a wide range of programs for them to choose from.
? 4. At the same time, there are still some people who prefer films because they like
the atmosphere in the cinema as well as the entertainment
图表式作文模式:
模 式 第一段:
From ... we can see the increase of/decrease of
(或:According to the figures shown in the graph, over the past...
By contrast and it also shows a tendency to continue...)
(描述数字的句型)... added up to ... in (时间), while it increases/
decreases to ... in (时间). Therefore, it can be predicted that ... is/are
to be on the rise/decrease.
第二大段:
There are chiefly three reasons for the rise/decrease. Firstly, ...
Secondly ..., Apart from the above reasons, ...
第三段:
In spite of what is mentioned above, there are .... ... indicates ...
Hence, the situation is still serious and how to ... is still a challenging
task.
How many people still get married in the European Union - and how many people prefer to live together but remain unmarried? The following graph shows how trends have changed over the past few decades
The table shows the number of marriages taking place each year in the European Union. In 1960, the number of marriages totaled 2.20 million. By 1964, the figure had increased slightly to 2.30 million.
The number of marriages reached a peak of almost 2.45 million in 1972, but between then and 1976, the number fell sharply to around the 2.10 million mark. Over the following years, there was a steady decrease, falling in 1980 to 2.00 million and then down to 1.85 million in 1986.
After this period of steady decline, there was a slow recovery and the graph shows the number climbed to 1.90 million in 1988 and 1.95 million two years later. This figure remained stable for a year and a half. In the early nineties, however, figures fluctuated, and since then the trend has again been downwards.
?Graphs
? 类类俱到、选取典型数据;简单明确、说明一个问题;套用模板、牢记表达方式 1. Templates & Samples 2Expressions & Class work
Sample 1
Year
N u m b e r o f P e o p l e
250
150
50
People Below Poverty Line
Sample 1
? People Below Poverty Line ? Outline:
1. 下图所示为中国三年中贫困线以下人口的 变化,请描述其变化
2. 请说明发生这些变化的原因
3. 解决目前中国贫困人口问题还有什么困难
Template 1The graph describes (点题) . As can be seen from the graph, (概括描述). (展开一句).
Several factors contribute to the change. First of all, (第一原因). In addition, (第二原因). Perhaps the main cause is (第三原因).
From the analysis above, we can safely conclude that (得出结论) . (结尾句).
? Recently, the issue of people below poverty line has aroused much interest. As can be
seen from the graph, the number of people below poverty line decreased during the years of 1978 to 1997. In 1978, there were 250 million throughout the country while in 1997 only 50 million people were under the line.
? Several factors contribute to the decrease. First of all, the government’s policy of reform
and opening up has accelerated the country’s developm ent and prospered its economy. Second, people’s living condition has been improved remarkably. All this results in a drop in the poverty-stricken population.
? From the analysis above, we can safely conclude that this change will bring us much
benefit. How ever, there are still many people living below poverty line due to China’s
overpopulation, limited resources and relatively low employment, to name just a few. Of course, the government is making every effort to solve those problems.
?Changes in the Way of Travel
?Outline:
1.下图所示为某城市1990年至2003年间人们旅行乘车方式的变化,请描述其变化
2.简述你从中得出的结论
The graph describes (点题) . As can be seen from the graph, (概括描述). (展开一句).
As can be seen from the table, there are several remarkable tendencies: (对图表进行细节描述).
I think two things caused the changes. (对原因的分析或自己的结论). So, we may predict that (得出结论或对未来的展望) .
?The table shows the changes in the way people travel. During the years between 1990 and 2003, the number of people traveling by train, by air and by private car has changed a great deal.
?As can be seen from the table, there are two remarkable tendencies: one is the rate of traveling by air, and the other is that by private cars. The former rose from 8% in 1990 to 25% in 2003, while the latter from 10% to 32%, both increasing more than 3 times. The table also shows that the number of people traveling by train decreased by 23% though it is still many people’s first choice.
?I think two things caused the changes. First, people are better off. They can afford to travel by air or in their own cars. Second, traveling by train is still favored by the majority, since it is cheaper. So, we may predict that as people’s living standard is improving, trains, cars and planes will be three main forms of transportation for long-distance travel.
Expressions
that of…
as +adj. (sth.) +as…(1) The gross value of industrial output last year was
estimated to be 2.5 times that of2000.
(2)By that time they will produce three times as much grain as they did in 2001.
(3) The foreign trade turnover increased 3.5 times compared with that of 2002.
Fire Causes in London
–The graph shows the fire causes in London. As can be seen from the graph, careless smokers, defective insulations and children playing with matches are the
three major causes of fires in London.
–Among the three major causes, smoking and children playing with matches accounts for 50 % and 37.5% of the fires respectively. Defective insulation is a
less serious cause which is responsible for only 12.5% of the fires.
–From this we can conclude that whatever causes the fire, carelessness seems to be the root cause. Therefore, people should be more careful with fire. Children
should be warned of the danger of playing with matches and electric workers
should be instructed to take good care of insulation.
?The above line graph describes changes in the average income of Chinese farmers between the year of 1975 and 2000. As illustrated by the graph, Chinese farmers’ income has been increasing since 1975. The graph shows that the years between 1995 and 2000 witnessed a dramatic rise by 84%.
?What caused the changes? There are two major factors contributing to this. First, with the policy of reform and opening up, farmers are more activated by the household contract responsibility system, which offers many policies favorable to farmers. Second, the government has increased its subsidies to famous and reduced taxes on farmers.
?
?Estimated EarningsThe bar graph describes the estimated earning of people with different education at different ages. As can be seen from the graph, the estimated income of a person is closely related to his or her age and the education he or she has received.
?
?As far as one’s age is concerned, according to the graph, people in their 40s can earn a lot more than those in their 60s or 70s, with people in their 30s and 50s somewhere in between.
?When one’s educ ation is taken into account, it seems that the higher degree one gets, the more he or she will earn after graduation.
?All this seems to point to the conclusion that if we want to earn more money, we have to get a higher degree and that we had better work hard when we are young so as to put some money aside for the days when we can hardly earn any.
?
2020年大学英语四级写作模板:图表作文框架 图表作文的框架 as is shown/indicated/illustrated by the figure/percentage in the table(graph/picture/pie/chart), ___作文题目的议题_____ has been on rise/ decrease (goesup/increases/drops/decreases),significantly/dramatically /steadily rising/decreasing from______ in _______ to ______ in _____. From the sharp/marked decline/ rise in the chart, it goes without saying that ________. There are at least two good reasons accounting for ______. On the one hand, ________. On the other hand, _______ is due to the fact that ________. In addition, ________ is responsible for _______. Maybe there are some other reasons to show ________. But it is generally believed that the above mentioned reasons are commonly convincing. As far as I am concerned, I hold the point of view that _______. I am sure my opinion is both sound and well-grounded.
六级之图表作文 Prepared on 22 November 2020
图表作文图表是科学文献中常用的一种表达手段。四六级图表作文利用图形(figure)、表格(table)、曲线图(graph)、柱状图(pie chart)和饼状图(pie chart)等作为写作提示,并以此为依据要求用简洁生动的语言把图标中所给出的信息完整而准确地表达出来。 这一类作文通常前半部分说明图标所表达的信息,后半部分进行议论,不论以何种方式出现,图标作文还是遵循一定的模式。最常见的模式是:第一段:描述现状。简要地描述图表,概括图表所表现的社会问题。第二段:分析原因。剖析图表所反映的深层次问题。用图表来论证第一段提出的主题,或者分析各个数据产生的原因。第三段:结论和启示。从图表中所体现的现象获得结论或者启示,或者对图标所表现的趋势加以预测。 图表作文模式 ①As is shown/depicted/described in the picture/chart, 概括图表内容。②For one thing, 支持这一内容的一个方面。③For another, 支持这一内容的另外一个方面。④It is obvious that 图表所反映的内容。 ⑤Many remarkable factors contribute to主题。⑥First of all, 理由一。⑦In addition, 理由二。⑧Thirdly,理由三。 ⑨Considering all these, I believe that我的看法或偏好。⑩First of all, 个人看法的依据一。⑾Furthermore, 个人看法的依据二。⑿Therefore, 个人的结论或文章的结论。 Example As is shown in the chart, the number of Chinese people traveling abroad increased gradually. For one thing, in 2001, the number of people traveling abroad was seven point five million, which was increased to ten million in 2002. For another, in 2003, there were twelve point one million Chinese people traveling abroad. It is obvious that China is witnessing an ever prosperous overseas tourism. The reasons of the increase lie in several aspects.First of all, with the implementation of China’s reform and opening policy, china’s economy has been growing rapidly and steadily. In addition, people’s income has increased tremendously, so more and more people are now eager to see the outside world with their own eyes. Thirdly, the Chinese government has been simplifying the formalities of traveling abroad and has opened more overseas tourist destinations.
英语图表常用句型词组. 英语图表作文写作常识50例 一、图表作文写作常识 1、图形种类及概述法: 泛指一份数据图表:a data graph/chart/diagram/illustration/table 饼图:pie chart 直方图或柱形图:bar chart / histogram 趋势曲线图:line chart / curve diagram 表格图:table
流程图或过程图:flow chart / sequence diagram 程序图:processing/procedures diagram 2、常用的描述用法 The table/chart diagram/graph shows (that) According to the table/chart diagram/graph As (is) shown in the table/chart diagram/graph As can be seen from the table/chart/diagram/graph/figures,figures/statistics shows (that)…… It can be seen from the figures/statistics We can see from the figures/statistics It is clear from the figures/statistics It is apparent from the figures/statistics table/chart/diagram/graph figures (that) …… table/chart/diagram/graph shows/describes/illustrates
雅思图表作文经典套句50句1.该表格描述了在…年之…年间…数量的变化。 2.该柱状图展示了… 3.该图为我们提供了有关…有趣数据。 4.该图向我们展示了… 5.该圆形图揭示了… 6.这个曲线图描述了…的趋势。 7.数据(字)表明… 8.该树型图向我们揭示了怎样… 9.该数据(字)可以这样理解… 10.这些数据资料令我们得出结论… 11.如图所示… 12.根据这些表(数字)… 13.如表格所示… 14.从图中可以看出,…发生了巨大变化。 15.从图表我们可以很清楚(明显)看到… 16.这个图表向我们展示了… 17.该表格描述了…年到…年间a与b的比例关系。 18.该图以圆形图形式描述了…总的趋势。
19.这是个柱型图,描述了… 20.如图所示,两条曲线描述了…的波动情况。 21.在…至…期间,…基本不变。 22.在…年到…期间… 23. 1995年至1998三年里… 24.从那时起… 25.…月(年)至…月(年)…的数量基本不变。 26.数字急剧上升至… 27.…至…期间…的比率维持不变。 28.…的数目在…月(年)达到顶点,为… 29.比率维持在… 30.…的比例比…的比例略高(低)。 31.…与…的区别不大。 32.该图表表明…的数目增长了三倍。 33…逐年减少,而…逐步上升。 34.…的情况(局势)到达顶(高)点,为…百分点。 35.数字(情况)在…达到底部。 36.数字(情况)达到底部(低谷)。
37. a是b的…倍。 38. a增长了… 39. a增长到… 40.比例高(低) 41.…数字呈上升趋势。 42. …到…发生急剧上升。 43.从…到…,下降速率减慢。 44.从这年起,…逐渐下降至… 45.与…相似 46.与…相同 47.…与…之间有许多相似(不同)之处 48. a于b有共同之处。 49. a与b之间的差别在于… 50.…年…急剧上升。
小学生作文批改方法及 步骤 Company number:【WTUT-WT88Y-W8BBGB-BWYTT-19998】
小学生作文批改方法及步骤 第一步:学生自改作文 学生在练习本上写完自己的作文后,自己阅读、修改自己的作文。 但是,学生个人修改,往往“只缘身在此山中”,而且限于水平,文章中的毛病,作者常常自己看不出来。首先要求学生对自己的作文进行复看审核,查找出标点、错别字以及不通顺的句子,并进行改正。接着从题意、中心、内容、感情、结构、语言等方面来一个“回头望”,多问几个“是什么”或“怎么样”,对自己的作文进行从点到面,实事求是的评价。最后,对文章再次阅读,寻找出自己本次作文的最大亮点,或指出今后作文中应该改进的地方,在这样的自我修改,自我反思的过程中,学生的写作能力也在不断提高着。正如叶圣陶先生所说:“批改固教者之要务,然须进一步想,必使学生能自改其文,或文成达而竟不须改,乃有济也。” 第二步:小组内互改作文 组内成员都完成作文后,在组长的带领下,针对每一个组员的作文进行一一的共同阅读,共同修改。修改时要注意: 1格式是否正确。 2找出错别字。将错字在原文处打下标记,在后面写上正确的字。 3找出病句。挑出病句划上横线,修改正确。 4标点符号。强调句号、引号、叹号、问号的使用。 5看文章的中心是否鲜明、集中。 以上五点是写文章最低的要求。学生经过三四篇文章的批文实践,就能够掌握这几条要求了。修改后,组员再次阅读自己修改后的作文,最后抄写在课堂作文本上。 第三步:各小组互改互评作文 互改互评课上,各小组间交换作文。同样,在组长的带领下,对四本作文进行一一阅读、批改。在以前的作文批改中,我首先对所有学生的作文通览一遍,找出其中具有代表性的文章,在作文课上和学生一起进行批改。同时,注意向学生介绍规范性的批改符号,讲解具体的批改方法,从点到面,对典型作文进行全方位的改评。这样做,不但使学生学到了别人作文的长处,起到取长补短,互相促进的作用,而且也使学生学到了作文修改的方法。 1、各小组互改的操作方法: ①格式是否正确。打开作文一看正确,拿出红笔,写上批语,格式正确;不正确的要批语指出,并修改出正确格式。比如:书信、建议书等等格式。格式不正确扣2分。 ②页面是否整洁。希望学生批改别人作文指出书面不整洁或书写不工整时,下次自己写作文也要注意,达到自己教育自己的目的。酌情扣2—3分。
考研英语作文范文和模板:图表作文 图表作文 1.写作攻略图表作文是考研英语写作中较为常见的题型之一,也是难度较大的一种写作题型。这类作文可综合提供题目、数据、图像、提纲,形式多样,但实际上只涉及5个方面:描述图表、指明寓意、分析原因、联系实际、给出建议,而每次考试只是从这5个方面的内容中选出3个结合在一起。从写作类型来看,基本上属于说明文。要求考生围绕题目将有关信息转化为文字形式,考生应该具有一定数据分析和材料归纳的能力,同时会运用一定的写作方法。考研试题一般以三段式写作方法来组织文章,第一段总结归纳信息反映的整体情况,点出主题思想,第二段回答第一段所得出的问题,对数字、数据等做出有条理的分析比较,第三段做出总结或给以简单的评论。表格和图表题型写作要点:(1)考生应仔细研究题目以及提示信息,认清图表中的数字、线条、阴影等部分的变化趋势和走向,抓住其主要特点,然后根据图表所显示的中心信息确定内容层次以及主题句。(2)考生应该仔细研究图表所给出的大量信息,从中选取最重要,最有代表性的信息,然后根据全文的主旨去组织运用所获取的关键信息。切忌简单
地罗列图表所给出的信息。(3)图表作文一般采用的时态为一般现在时,但如果图表中给出了具体时间参照,考生则应对时态进行相应的调整。(4)图表作文有一些固定句型和表达法,考生应对此融会贯通。(5)图表作文可以细分为表格,曲线图、柱形图和饼形图。除了上述共同要点,考生还应了解这四种图在写作方面的不同特点。——表格可以表示多种事物的相互关系,所以考生要对表格中所给出的大量数字进行比较分析,从中找出其变化规律。——曲线图常表示事物的变化趋势,考生应认真观察坐标系所显示的数据信息,并且密切注意交汇在坐标横轴和纵轴上的数字及单位。——柱形图用来表示各种事物的变化情况及相互关系,要求考生通过宽度相等的柱形的高度或长度差别来判断事物的动态发展趋势,因此考生应密切关注坐标线上的刻度单位及图表旁边的提示说明与文字。——饼形图表示各事物在总体中所占的比例及相互关系,旨在要求考生准确理解并阐述一个被分割成大小不等切片的饼形图所传达的信息。考生应清楚掌握部分与整体,部分与部分之间的相互关系,这种关系通常是以百分比的数字形式给出的。(6)列出各段主题句。考生可以根据所给提纲或已知信息列出每段的主题句,为全文的展开做好铺垫。(7)围绕主题句完成段落的展开。尽量做到主题明确、条理清楚、文字简练。(8)检查与修改。对图
一、图表作文写作常1、图形种类及概述法: 泛指一份数据图表:a data graph/chart/diagram/illustration/table饼图:pie chart 直方图或柱形图:bar chart / histogram 趋势曲线图:line chart / curve diagram 表格图:table 流程图或过程图:flow chart / sequence diagram 程序图:processing/procedures diagram 2、常用的描述用法 The table/chart diagram/graph shows (that) According to the table/chart diagram/graph As (is) shown in the table/chart diagram/graph As can be seen from the table/chart/diagram/graph/figures, figures/statistics shows (that)…… It can be seen from the figures/statistics We can see from the figures/statistics It is clear from the figures/statistics It is apparent from the figures/statistics table/chart/diagram/graph figures (that) …… table/chart/diagram/graph shows/describes/illustrates how…… 3、雅思考试图表中的数据(Data)具体表达法 数据(Data)在某一个时间段固定不变:fixed in time 在一系列的时间段中转变:changes over time 持续变化的data在不同情况下: 增加:increase / raise / rise / go up …… 减少:decrease / grow down / drop / fall …… 波动:fluctuate / rebound / undulate / wave …… 稳定:remain stable / stabilize / level off …… 最常用的两种表达法: 动词+副词形式(Verb+Adverb form) 形容词+名词形式(Adjective+Noun form) 二、雅思图表作文相关常用词组 1、主章开头 图表类型:table、chart、diagraph、column chart、pie graph 描述:show、describe、illustrate、can be seen from、clear、apparent、reveal、represent 内容:figure、statistic、number、percentage、proportion 2、表示数据变化的单词或者词组 rapid/rapidly 迅速的,飞快的,险峻的
一、图表作文写作常识 1、图形种类及概述法: 泛指一份数据图表:a data graph/chart/diagram/illustration/table 饼图:pie chart 直方图或柱形图:bar chart / histogram 趋势曲线图:line chart / curve diagram 表格图:table 流程图或过程图:flow chart / sequence diagram 程序图:processing/procedures diagram 2、常用的描述用法 The table/chart diagram/graph shows (that) According to the table/chart diagram/graph As (is) shown in the table/chart diagram/graph As can be seen from the table/chart/diagram/graph/figures, Figures/statistics shows (that)…… It can be seen from the figures/statistics We can see from the figures/statistics It is clear from the figures/statistics It is apparent from the figures/statistics Table/chart/diagram/graph figures (that) …… Table/chart/diagram/graph shows/describes/illus trates how…… 3、图表中的数据(Data)具体表达法 数据(Data)在某一个时间段固定不变:fixed in time 在一系列的时间段中转变:changes over time 持续变化的data在不同情况下: 增加:increase / raise / rise / go up …… 减少:decrease / grow down / drop / fall …… 波动:fluctuate / rebound / undulate / wave …… 稳定:remain stable / stabilize / level off …… 最常用的两种表达法: 动词+副词形式(Verb+Adverb form) 形容词+名词形式(Adjective+Noun form)
2 The first point to note is the huge increase in the number of 需要注意的第一点就是…的急剧增长 3 The statistics show that 这些数据表明 4 占百分之几Form/comprise/make up/constitute/ account for ….percen t 5 This cure graph describes the trend of 该曲线图描述了…的趋势 6 The statistics lead us to the conclusion that 由这些数据,我们可以做出如下结论 7 As can be seen from the line graph, 由线状图我们可以看出 8 增加:Increase / raise / rise / go up/ soar/ ascend/ mount/ climb 9 减少:Decrease / grow down / drop / fall/ reduce/ descend/ shrink to/decline 10 稳定:Remain stable / stabilize / level off/ remain unchanged 11 It can be seen from the table that 由表格我们可以看出 12 The table shows the changes in the number of… over the period from…to…该表格展示了从…到…数据的变化 13 The table provides some data of 该表格提供了有关…的数据 14 As can be seen clearly from the table, 从表格中我们可以清楚地看出, 15 As can be seen from the table, great changes have taken place in... 从表格中可以看出,...发生了巨大变化 16 This table illustrates the changing proportion of A and B from...to... 该表格描述了...年到...年间a与b的比例关系 17 急剧地sharply, steeply, dramatically, drastically, suddenly 18 显著地,considerably, significantly, noticeably, remarkably, rapidly 19 稳步地, 逐渐地steadily, moderately, gradually, smoothly 20 轻微地, 缓慢地slightly, slowly, mildly, moderately 21 The following diagram shows the structure of...... 以下的图展示了...的结构 22 The picture illustrates...... 该图展示了... 23 It mainly consists of following steps. 它主要包括以下步骤 24 The whole procedure can be divided into...stages. 整个的过程可以分为...步 25 The first step is to 第一步是...
作文批改的多种方式及效果 欧阳晶 内容摘要: 本文论述作文批改是作文教学的重要环节,也是提高学生习作水平的有效手段,而作文批改的方式多种多样,本文根据教学实践对不同的批改方式及其效果进行了探讨,便于中小学教师在自己的教学实践过程中根据不同目的选择恰当的作文批改方式,提高教师劳动的效率和学生写作水平。 关键词: 批改方式效果运用 一、研究背景: 长期以来不少的中小学教师致力于作文教学研究,各种方式方法推陈出新,但有不少囿于自我封闭的框架中:命题——写作——批改——讲评。而这一程序都是在教师作用下完成的,如果不破除这个老的作文教学套路,就不能摆脱习作教学低效、习作评改无效的现状。古人云:三分文章七分改。我国著名作家赵树理曾说过,好文章是改出来的。这些都说明写好作文,是离不开“修改”过程中的严格锤炼的。对于有了一定作文基础的中学生来说,下功夫于“修改”,是非常重要的。长期以来,在作文教学研究领域,一直侧重于“写前指导”的研究,忽略对作文的“批改与评价”。教师在作文评改中耗费大量时间与精力却收效甚微。叶圣陶先生曾说过:“我当过语文教师,改过学生作文不计其数,得到一个深切体会:徒劳无功。”作文教学是语文教学活动中的重要内容,作文训练是学生学习语文的一个重要环节,批改学生作文是语文教师提高学生语文能力,增强学生全面素质的主要任务和重要手段,同时也是教师普遍感到费劲和头痛的事情。如何通过教师悉心的“训”,学生勤奋的“练”,达到事半功倍的作文教学效果,使学生的听、说、读、写等各方面的综合能力在每周一次的作文训练中得到提高。要做到这一点,达到这一效果,有一点是不能回避的,也是非常重要的。这就是教师要恰如其分、择机适时地对学生作文加以肯定和指导,给予学生作文正确而中肯客观的评价,通过逐字、逐句、逐篇的分析、批改,一步一步地实现这一目标,彰显这一效果。 二、作文批改现状与思考 我们学习语文的最终目的是驾驭语文,是为了表达,而作文说是表达重要方式之一,作文在语文能力的评价中所占的分量也是自不言喻。广大的语文教师也清醒地认识到:没有一定的写作量的积累是很难让作文出水平的,而学生写作后及时有效的获取评价信息又是学生获得再次作文的动力所在,但超长的作业量使语文教师很难尽快满足学生的需求。在部分教育主管部门和教学检查人员的规定下,传统的评价方式为教师全收
图表式作文写作技巧指引 一、图表类型 二、要点分析 A. 表格图 1横向比较: 介绍横向各个数据的区别,变化和趋势 2纵向比较:介绍横向各个数据的区别,变化和趋势 3无需将每一个数据分别说明,突出强调数据最大值和最小值,对比时要总结出数据对比最悬殊的和最小的 说明:考察例举数字的能力和方法。注意怎样通过举一些有代表性的数据来有效地说明问题。 B. 曲线图 1极点说明: 对图表当中最高的,最低的点要单独进行说明 2趋势说明: 对图表当中曲线的连续变化进行说明,如上升,下降,波动,持平 3交点说明: 对图表当中多根曲线的交点进行对比说明 说明:关键是把握好曲线的走向和趋势,学会general classification,即在第二段的开头部分对整个曲线进行一个阶段式的总分类,使写作层次清晰。接下来在分类描述每个阶段的specific trend,同时导入数据作为你分类的依据。注意不要不做任何说明就机械性的导入数据!可以使用一些比较native的单词和短语来描述trend。 C. 饼状图 1介绍各扇面及总体的关系 2各个扇面之间的比较,同类扇面在不同时间,不同地点的比较 3重点突出特点最明显的扇面:最大的,最小的,互相成倍的 D. 柱状图 1.比较: similarity 2.对比: difference) 3.横向总结所有柱状图表的共性特征 & 分别描写各个柱子的个性特征 E. 流程图 1.首先说明:做什么工作的过程,目的是什么 2.准备工作 3.按时间/过程先后描述
4.结果 5.简单总结(可有可无) 说明:注意流程图里的“因果关系”或每一流程的“承前启后”关系;表达每一流程的主体内容,阐明这种关系;揭示其内在联系或规律;最后,给予简要归纳和总结。 F. 实物/器具工作过程 1.实物的名称,功能 2.基本结构 3.工作过程 4.简单总结 G. 综合图 1不求甚解,不拘泥于细节 2分门别类,分段落详细介绍各个图表 3不画蛇添足,主观臆断或猜测图表之间的关系 三、框架结构 1.开头:该图阐述的是______的______.共有以下几个部分组成。 shows (that) / According to / As (is) shown in … / As can be seen from / It can be seen from /We can see from / It is clear / apparent from the figures/statistics / It is from / This …tells us the main story about / concerning / concerned with / on / related to… 2.分析:首先看到的是____, 在_____年呈现出____的趋势 / 占______; 其次,……第三[比 较分析] 1)内容:figure、statistic、number、percentage、proportion 2)用语:
图表题必背短语及词汇 开头段(改写原题,替换) 1.Show/ compare/ illustrate 2.Proportion/ percentage 3.Categories/kinds/types 4.The UK/Britain/the United Kingdom https://www.doczj.com/doc/8518437831.html,rmation/data(注意data不能加s) 6.Males/men females/women 7.From(年代)to(年代)/between(年代)and(年代)/over a period of …years 8.Subway system/underground railway system/underground train system 9.Store/shop 10.The number of+可数名词复数形式/the figure for+可数名词复数形式 11.The amount of something+不可数名词/ the figure for+不可数名词 主体段 上升:go up / increase/rise/grow/show an upward trend/show a downward trend 下降:decline/fall/drop/decrease/fall back to 回落到……/fell steadily平稳的下降从。。。上升或者下降。。。的介词搭配from…to…/by(表幅度) 波动:fluctuate(没有被动形式)常见搭配:fluctuate between…and… 表示稳定某一水平的短语:remain stable at/level off at(后面都要跟具体的数字或百分比) 经历了某种变化的及物动词:see/experience/witness(只要图里存在着时间上的跨度就一定能够用的上) 例如:see an opposite trend呈现出相反的趋势/experience a sharp rise from 到达最高点:peak at/reach its peak at 介绍趋势时表示达到。。。或者位于。。。的动词:reach达到/stand at位于 表示占多少份额的动词:account for/make up/represent/constitute 表示对将来预测的动词:expect/predict/project(这三个词经常以被动形式出现。而且,尽管是描述未来的数字,be动词仍然用一般现在时be expected to) 表示变成原来数值的两倍或者三倍的词:double/increase twofold/triple三倍(全都是及物动词,但要注意的这几个词都是表达同一个事物在不同时间的倍数关系) 表示是另一个事物的两倍或者三倍的表达:be twice as high/long/fast/popular as Be three times as……as 表示始终高于或者始终低于的句型:be consistently higher/lower than 表示原有差距变小或者变大的句型:the gap between …and…narrows(narrowed)/widens(widened) 表示原来少于但后来超过的及物动词:exceed(后边跟阿拉伯数字或者百分数) Overtake (过去式overtook,后面跟比较对象) 表示急剧的形容词sharp(ly)/rapid(ly)/dramatic(ally) 表示持续的形容词gradual(ly)/consistent(ly)/steady(steadily) 表示显著的。大幅度的形容词:significant(ly)/noticeable(去e加ly)/considerable(去e加ly) 表示很小幅度的词:slight(ly)
Stepl.示例 例 1: Changes in the Ownership of Houses 要求:1、根据上图描述该市住房产权的变化; 2、 分析产生这些变化的原因; 3、 说明这些变化对个人和社会产生的彫响。 Step2.图表作文分析 1、 出题形式 图表作文一般给出作文的标题和一个表格,要求: 1) 用文字描述图表,客观解释图表中所传递的信息,并找出某种规律或趋势; 2) 就图表中所反映的某种趋势或问题分析其原因或后果。 写好图表作文,关键在于能否读懂图表中所提供的信息,把握各信息间的联系,用准确流畅的语 言把这一信息表达出来,并就这一信息发表自己的看法。 2、 写作步骤 1) 认真分析图表的含义,弄清所含信息及不同信息间的关系; 2) 确定主题,构思框架,筛选能说明主题的典型数据; 3) 列提纲; 4) 扩展成段落,注意段与段Z 间的衔接与过渡; 5) 检查与修改。 3、 篇章结构…三段式 第一段:分析图表中的数据变化反映什么问题或趋势,概述图表所揭示的信息。 第二段:分析产生的原因 第三段:展望未来或提出方法或建议 Step3.请你分析上面这篇作文,构思提纲 第一段: __________________________________________________________________________ 第二段: __________________________________________________________________________ 第三段: 图表作文写作练习 2015.01 ■ privet e O s t a. t oiiwae dL
BEC中高级图表作文数据发展趋势词组 句型和套句 (自己总结,经典实用) 一、上升趋势的动词或词组有: 1、动词:increase、go up、rise、grow、jump、leap、sore、shoot、pick up 2、常用的名词an increase、a growth、a jump、a sore、an upward、trend 3、上升到某个位置 ①上升动词+to加具体数 ②上升动词+to加the peak of+具体数 ③To peak at+具体数 ④to climb to+具体数 二、下降趋势 1、常用的下降趋势动词词组:to fall、to decrease、to go down、to go down、to slide、the collapse、the decline、to drop 2、可以使用的名词:a collapse、a decrease、a fall、a decline、 a drop 3、对于下降到某个位置的描述:下降动词+to+具体数、 下降动词+to+ the bottom of+具体数、下降动词+reaching the bottom of+具体数 三、平稳趋势 hardly change、have little change、keep steady、level off、remain constant、stay the same。
四、表程度的副词 1、程度较大:considerably、dramatically、greatly、markedly、obviously、quickly、rapidly、sharply、significantly、suddenly。 2、长度较小:slightly、gradually、slowly、steadily。 五、上升和下降趋势的组合描述 1、先上升后下降的句型 ①Sth increased slowly during 年月and年月,but fell sharply in+时间。 ②A steady fall in +年during月and月, followed the sharp increase in...。 2、先下降后上升的就行 ①Sth fell before sth began to make a recovery ②Sth continue the recovery, climbing to... ③Sth dropped the during+时间, but increased again in+时间 ④Sth fell and then picked up during+时间。 六、起伏波动的句型 1、起伏大的句型: ①Sth fluctuated sharply all through+... ②Sth suffered the sharp fluctuation all the way during the period 2、起伏小的句型: Sth hardly changed through the period between... and... 七、数据的修饰: 1、表示不足的词:up to、below、under 、almost 、nearly
xx 口语常用句型 考试套话 1. 与考官见面语 Glad to meet you here. How nice to see you. Fancy seeing you. How are you? I 'm glad to have had the opportunity to meet you here. I 'm glad to meet you. I ' pmleased to meet you. It 's a pleasure to meet you. 2. 完全没听懂问题 Could you please rephrase that question/topic? I ' m not exactly sure what you mean … 3. 对问题似懂非懂 Do you mean …? If I understand right I ' m sorry if I ' m being a little slow, but …? So am I right in saying …? If I ' ve got the picture, then So what you mean is …,right? I ' m sorry,I m nIout nsduerers tand. Do you mean (that ) …?
Sorry, I don ' t quite catch you. You mean …? Can I get one thing clear? Would I be correct in supposing …? 4. 对问题内容不熟悉 I ' m not exactly sure how to answer that question, but (perhaps) That ' s a rather difficult question, but (maybe) … I ' m sorry, but I don ' t know much about … 5. 评价考官所提问题 That ' s difficult to answer, but maybe … I ' m sorry, but I don ' t know much about … ,but perhaps … Maybe I can answer your question by telling you about a personal experience I had. That ' s an interesting question … let me see. Well, I suppose that Yes, that ' s a big issue. 6. 连接词 Well, … Actually … In fact … You see … You know, …
图表作文(一) 第一节图表作文的类型 图表作文可分为两大类:表作文和图作文。 表作文 表格(Table)可以使大量数据系统化,便于阅读、比较。表格常由标题(Title)、表头(Boxhead)(表格的第一行)、侧目(Stub)(表格左边的第一列)和主体(Body)部分(表格的其余部分)等部分组成。如下表: 用表格表达的信息具体准确,而且表格中的各项均按一定规律排列。阅读表格时要注意找出表格中各个项目的相互关系,表格中各个项目的变化规律。例如,上面的表格中的数字说明,和1978年相比,1983年大学入学的人数在增加,而小学的入学人数在减少。搞清楚这些变化规律也就读懂了表格的内容。 图作文 图作文又可分为三种:圆形图作文、曲线图作文和条状图作文。 (1) 圆形图作文 圆形图(Pie chart)也称为饼状图或圆面分割图。圆形图因为比较形象和直观,各部分空间大小差别容易分辨,所以常用来表示总量和各分量之间的百分比关系。整个圆表示总量,楔形块表示分量。有时圆形图还有数值表,两者结合可把各分量表示得更准确、清楚。例如:This is a pie chart of the average weekly expenditure of a family in Great Britain. As can be see from the chart, the main expenditure of an average British family is spent on food, which accounts for 25% of its total expenditure. The next two significant expending items are transport and housing, which are 15% and 12% respectively. If we take into account clothing and footwear, which makes up 10%, the four essentials of life, that is, food, transport, housing, and clothing and footwear, amount to 62% of the total expenditure. (2) 曲线图作文 曲线图(Line graph)也称为线性图或坐标图。曲线图最适合表示两个变量之间关系的发展过程和趋势。一般来说,曲线所呈现的形状比某一点所代表的变量的值更有意义。曲线图有横轴和纵轴。一般先看横轴所代表的数量或时间等,然后再看纵轴所显示的意义。同时必须找出线条所反映的最高或最低的变化。例如: 这个曲线图的横轴代表1990年的不同的月份,纵轴代表交通事故的数量。从交通事故曲线图上可知,前八个月的交通事故的数量有升有降。曲线图在八月份升到了最高点(39),此后一直呈下降的趋势,十二月份降到了最低点(16)。可见,1990年的交通事故的数量总体上呈下降的趋势。 (3) 条形图作文 条形图(Bar graph)也称为立柱图或圆柱图。条形图由宽度相同但长度不同的条块代表不同的量。当要比较几个项目或量时,常用不同颜色来区分。条形图主要用来表示:1)同一项目在不同时间的量;2)同一时间不同项目的量。阅读条形图时,要先看图例,再看横轴、纵横各代表什么量,每一个刻度所代表的值是多少,最后找出图中各长条所表示的数据及各长条间的相互关系。例如: 左边的条形图的横轴代表时间,纵轴代表期望寿命(Life Expectancy),这一条形图想要体现的是同一项目(期望寿命)在不同时间的量。右边的条形图的横轴也是代表时间,纵轴是代表婴儿的死亡率(Infant Mortality),这一条形图想要体现的也是同一项目(婴儿的死亡率)在不同时间的量。左边的条形图表明1990年的人均期望寿命比1960年的人均期望寿命长20岁,而1990年的婴儿死亡率比1960年的婴儿死亡率下降了50%。