2019数学建模美赛论文
- 格式:docx
- 大小:117.07 KB
- 文档页数:18
For office use onlyT1________________ T2________________ T3________________ T4________________Team Control Number7018Problem ChosencFor office use onlyF1________________F2________________F3________________F4________________ SummaryThe article is aimed to research the potential impact of the marine garbage debris on marine ecosystem and human beings,and how we can deal with the substantial problems caused by the aggregation of marine wastes.In task one,we give a definition of the potential long-term and short-term impact of marine plastic garbage. Regard the toxin concentration effect caused by marine garbage as long-term impact and to track and monitor it. We etablish the composite indicator model on density of plastic toxin,and the content of toxin absorbed by plastic fragment in the ocean to express the impact of marine garbage on ecosystem. Take Japan sea as example to examine our model.In ask two, we designe an algorithm, using the density value of marine plastic of each year in discrete measure point given by reference,and we plot plastic density of the whole area in varies locations. Based on the changes in marine plastic density in different years, we determine generally that the center of the plastic vortex is East—West140°W—150°W, South—North30°N—40°N. According to our algorithm, we can monitor a sea area reasonably only by regular observation of part of the specified measuring pointIn task three,we classify the plastic into three types,which is surface layer plastic,deep layer plastic and interlayer between the two. Then we analysis the the degradation mechanism of plastic in each layer. Finally,we get the reason why those plastic fragments come to a similar size.In task four, we classify the source of the marine plastic into three types,the land accounting for 80%,fishing gears accounting for 10%,boating accounting for 10%,and estimate the optimization model according to the duel-target principle of emissions reduction and management. Finally, we arrive at a more reasonable optimization strategy.In task five,we first analyze the mechanism of the formation of the Pacific ocean trash vortex, and thus conclude that the marine garbage swirl will also emerge in south Pacific,south Atlantic and the India ocean. According to the Concentration of diffusion theory, we establish the differential prediction model of the future marine garbage density,and predict the density of the garbage in south Atlantic ocean. Then we get the stable density in eight measuring point .In task six, we get the results by the data of the annual national consumption ofpolypropylene plastic packaging and the data fitting method, and predict the environmental benefit generated by the prohibition of polypropylene take-away food packaging in the next decade. By means of this model and our prediction,each nation will reduce releasing 1.31 million tons of plastic garbage in next decade.Finally, we submit a report to expediction leader,summarize our work and make some feasible suggestions to the policy- makers.Task 1:Definition:●Potential short-term effects of the plastic: the hazardeffects will be shown in the short term.●Potential long-term effects of the plastic: thepotential effects, of which hazards are great, willappear after a long time.The short- and long-term effects of the plastic on the ocean environment:In our definition, the short-term and long-term effects of the plastic on the ocean environment are as follows.Short-term effects:1)The plastic is eaten by marine animals or birds.2) Animals are wrapped by plastics, such as fishing nets, which hurt or even kill them.3)Deaden the way of the passing vessels.Long-term effects:1)Enrichment of toxins through the food chain: the waste plastic in the ocean has no natural degradation in theshort-term, which will first be broken down into tinyfragments through the role of light, waves,micro-organisms, while the molecular structure has notchanged. These "plastic sands", easy to be eaten byplankton, fish and other, are Seemingly very similar tomarine life’s food,causing the enrichment and delivery of toxins.2)Accelerate the greenhouse effect: after a long-term accumulation and pollution of plastics, the waterbecame turbid, which will seriously affect the marineplants (such as phytoplankton and algae) inphotosynthesis. A large number of plankton’s deathswould also lower the ability of the ocean to absorbcarbon dioxide, intensifying the greenhouse effect tosome extent.To monitor the impact of plastic rubbish on the marine ecosystem:According to the relevant literature, we know that plastic resin pellets accumulate toxic chemicals , such as PCBs、DDE , and nonylphenols , and may serve as a transport medium and soure of toxins to marine organisms that ingest them[]2. As it is difficult for the plastic garbage in the ocean to complete degradation in the short term, the plastic resin pellets in the water will increase over time and thus absorb more toxins, resulting in the enrichment of toxins and causing serious impact on the marine ecosystem.Therefore, we track the monitoring of the concentration of PCBs, DDE, and nonylphenols containing in the plastic resin pellets in the sea water, as an indicator to compare the extent of pollution in different regions of the sea, thus reflecting the impact of plastic rubbish on ecosystem.To establish pollution index evaluation model: For purposes of comparison, we unify the concentration indexes of PCBs, DDE, and nonylphenols in a comprehensive index.Preparations:1)Data Standardization2)Determination of the index weightBecause Japan has done researches on the contents of PCBs,DDE, and nonylphenols in the plastic resin pellets, we illustrate the survey conducted in Japanese waters by the University of Tokyo between 1997 and 1998.To standardize the concentration indexes of PCBs, DDE,and nonylphenols. We assume Kasai Sesside Park, KeihinCanal, Kugenuma Beach, Shioda Beach in the survey arethe first, second, third, fourth region; PCBs, DDE, andnonylphenols are the first, second, third indicators.Then to establish the standardized model:j j jij ij V V V V V min max min --= (1,2,3,4;1,2,3i j ==)wherej V max is the maximum of the measurement of j indicator in the four regions.j V min is the minimum of the measurement of j indicatorstandardized value of j indicator in i region.According to the literature [2], Japanese observationaldata is shown in Table 1.Table 1. PCBs, DDE, and, nonylphenols Contents in Marine PolypropyleneTable 1 Using the established standardized model to standardize, we have Table 2.In Table 2,the three indicators of Shioda Beach area are all 0, because the contents of PCBs, DDE, and nonylphenols in Polypropylene Plastic Resin Pellets in this area are the least, while 0 only relatively represents the smallest. Similarly, 1 indicates that in some area the value of a indicator is the largest.To determine the index weight of PCBs, DDE, and nonylphenolsWe use Analytic Hierarchy Process (AHP) to determine the weight of the three indicators in the general pollution indicator. AHP is an effective method which transforms semi-qualitative and semi-quantitative problems into quantitative calculation. It uses ideas of analysis and synthesis in decision-making, ideally suited for multi-index comprehensive evaluation.Hierarchy are shown in figure 1.Fig.1 Hierarchy of index factorsThen we determine the weight of each concentrationindicator in the generall pollution indicator, and the process are described as follows:To analyze the role of each concentration indicator, we haveestablished a matrix P to study the relative proportion.⎥⎥⎥⎦⎤⎢⎢⎢⎣⎡=111323123211312P P P P P P P Where mn P represents the relative importance of theconcentration indicators m B and n B . Usually we use 1,2,…,9 and their reciprocals to represent different importance. The greater the number is, the more important it is. Similarly, the relative importance of m B and n B is mn P /1(3,2,1,=n m ).Suppose the maximum eigenvalue of P is m ax λ, then theconsistency index is1max --=n nCI λThe average consistency index is RI , then the consistencyratio isRICI CR = For the matrix P of 3≥n , if 1.0<CR the consistency isthougt to be better, of which eigenvector can be used as the weight vector.We get the comparison matrix accoding to the harmful levelsof PCBs, DDE, and nonylphenols and the requirments ofEPA on the maximum concentration of the three toxins inseawater as follows:⎥⎥⎥⎦⎤⎢⎢⎢⎣⎡=165416131431P We get the maximum eigenvalue of P by MATLAB calculation0012.3max =λand the corresponding eigenvector of it is()2393.02975.09243.0,,=W1.0042.012.1047.0<===RI CI CR Therefore,we determine the degree of inconsistency formatrix P within the permissible range. With the eigenvectors of p as weights vector, we get thefinal weight vector by normalization ()1638.02036.06326.0',,=W . Defining the overall target of pollution for the No i oceanis i Q , among other things the standardized value of threeindicators for the No i ocean is ()321,,i i i i V V V V = and the weightvector is 'W ,Then we form the model for the overall target of marine pollution assessment, (3,2,1=i )By the model above, we obtained the Value of the totalpollution index for four regions in Japanese ocean in Table 3T B W Q '=In Table3, the value of the total pollution index is the hightest that means the concentration of toxins in Polypropylene Plastic Resin Pellets is the hightest, whereas the value of the total pollution index in Shioda Beach is the lowest(we point up 0 is only a relative value that’s not in the name of free of plastics pollution)Getting through the assessment method above, we can monitor the concentration of PCBs, DDE and nonylphenols in the plastic debris for the sake of reflecting the influence to ocean ecosystem.The highter the the concentration of toxins,the bigger influence of the marine organism which lead to the inrichment of food chain is more and more dramatic.Above all, the variation of toxins’ concentration simultaneously reflects the distribution and time-varying of marine litter. We can predict the future development of marine litter by regularly monitoring the content of these substances, to provide data for the sea expedition of the detection of marine litter and reference for government departments to make the policies for ocean governance.Task 2:In the North Pacific, the clockwise flow formed a never-ending maelstrom which rotates the plastic garbage. Over the years, the subtropical eddy current in North Pacific gathered together the garbage from the coast or the fleet, entrapped them in the whirlpool, and brought them to the center under the action of the centripetal force, forming an area of 3.43 million square kilometers (more than one-third of Europe) .As time goes by, the garbage in the whirlpool has the trend of increasing year by year in terms of breadth, density, and distribution. In order to clearly describe the variability of the increases over time and space, according to “Count Densities of Plastic Debris from Ocean Surface Samples North Pacific Gyre 1999—2008”, we analyze the data, exclude them with a great dispersion, and retain them with concentrated distribution, while the longitude values of the garbage locations in sampled regions of years serve as the x-coordinate value of a three-dimensional coordinates, latitude values as the y-coordinate value, the Plastic Count per cubic Meter of water of the position as the z-coordinate value. Further, we establish an irregular grid in the yx plane according to obtained data, and draw a grid line through all the data points. Using the inverse distance squared method with a factor, which can not only estimate the Plastic Count per cubic Meter of water of any position, but also calculate the trends of the Plastic Counts per cubic Meter of water between two original data points, we can obtain the unknown grid points approximately. When the data of all the irregular grid points are known (or approximately known, or obtained from the original data), we can draw the three-dimensional image with the Matlab software, which can fully reflect the variability of the increases in the garbage density over time and space.Preparations:First, to determine the coordinates of each year’s sampled garbage.The distribution range of garbage is about the East - West 120W-170W, South - North 18N-41N shown in the “Count Densities of Plastic Debris from Ocean Surface Samples North Pacific Gyre 1999--2008”, we divide a square in the picture into 100 grids in Figure (1) as follows:According to the position of the grid where the measuring point’s center is, we can identify the latitude and longitude for each point, which respectively serve as the x- and y- coordinate value of the three-dimensional coordinates.To determine the Plastic Count per cubic Meter of water. As the “Plastic Count per cubic Meter of water” provided by “Count Densities of P lastic Debris from Ocean Surface Samples North Pacific Gyre 1999--2008”are 5 density interval, to identify the exact values of the garbage density of one year’s different measuring points, we assume that the density is a random variable which obeys uniform distribution in each interval.Uniform distribution can be described as below:()⎪⎩⎪⎨⎧-=01a b x f ()others b a x ,∈We use the uniform function in Matlab to generatecontinuous uniformly distributed random numbers in each interval, which approximately serve as the exact values of the garbage density andz-coordinate values of the three-dimensional coordinates of the year’s measuring points.Assumptions(1)The data we get is accurate and reasonable.(2)Plastic Count per cubic Meter of waterIn the oceanarea isa continuous change.(3)Density of the plastic in the gyre is a variable by region.Density of the plastic in the gyre and its surrounding area is interdependent , However, this dependence decreases with increasing distance . For our discussion issue, Each data point influences the point of each unknown around and the point of each unknown around is influenced by a given data point. The nearer a given data point from the unknown point, the larger the role.Establishing the modelFor the method described by the previous,we serve the distributions of garbage density in the “Count Pensities of Plastic Debris from Ocean Surface Samples North Pacific Gyre 1999--2008”as coordinates ()z y,, As Table 1:x,Through analysis and comparison, We excluded a number of data which has very large dispersion and retained the data that is under the more concentrated the distribution which, can be seen on Table 2.In this way, this is conducive for us to get more accurate density distribution map.Then we have a segmentation that is according to the arrangement of the composition of X direction and Y direction from small to large by using x co-ordinate value and y co-ordinate value of known data points n, in order to form a non-equidistant Segmentation which has n nodes. For the Segmentation we get above,we only know the density of the plastic known n nodes, therefore, we must find other density of the plastic garbage of n nodes.We only do the sampling survey of garbage density of the north pacificvortex,so only understand logically each known data point has a certain extent effect on the unknown node and the close-known points of density of the plastic garbage has high-impact than distant known point.In this respect,we use the weighted average format, that means using the adverse which with distance squared to express more important effects in close known points. There're two known points Q1 and Q2 in a line ,that is to say we have already known the plastic litter density in Q1 and Q2, then speculate the plastic litter density's affects between Q1、Q2 and the point G which in the connection of Q1 and Q2. It can be shown by a weighted average algorithm22212221111121GQ GQ GQ Z GQ Z Z Q Q G +*+*=in this formula GQ expresses the distance between the pointG and Q.We know that only use a weighted average close to the unknown point can not reflect the trend of the known points, we assume that any two given point of plastic garbage between the changes in the density of plastic impact the plastic garbage density of the unknown point and reflecting the density of plastic garbage changes in linear trend. So in the weighted average formula what is in order to presume an unknown point of plastic garbage density, we introduce the trend items. And because the greater impact at close range point, and thus the density of plastic wastes trends close points stronger. For the one-dimensional case, the calculation formula G Z in the previous example modify in the following format:2212122212212122211111112121Q Q GQ GQ GQ Q Q GQ Z GQ Z GQ Z Z Q Q Q Q G ++++*+*+*=Among them, 21Q Q known as the separation distance of the known point, 21Q Q Z is the density of plastic garbage which is the plastic waste density of 1Q and 2Q for the linear trend of point G . For the two-dimensional area, point G is not on the line 21Q Q , so we make a vertical from the point G and cross the line connect the point 1Q and 2Q , and get point P , the impact of point P to 1Q and 2Q just like one-dimensional, and the one-dimensional closer of G to P , the distant of G to P become farther, the smaller of the impact, so the weighting factor should also reflect the GP in inversely proportional to a certain way, then we adopt following format:221212222122121222211111112121Q Q GQ GP GQ GQ Q Q GQ GP Z GQ Z GQ Z Z P Q Q Q Q G ++++++*+*+*=Taken together, we speculated following roles:(1) Each known point data are influence the density of plastic garbage of each unknown point in the inversely proportional to the square of the distance;(2) the change of density of plastic garbage between any two known points data, for each unknown point are affected, and the influence to each particular point of their plastic garbage diffuse the straight line along the two known particular point; (3) the change of the density of plastic garbage between any two known data points impact a specific unknown points of the density of plastic litter depends on the three distances: a. the vertical distance to a straight line which is a specific point link to a known point;b. the distance between the latest known point to a specific unknown point;c. the separation distance between two known data points.If we mark 1Q ,2Q ,…,N Q as the location of known data points,G as an unknown node, ijG P is the intersection of the connection of i Q ,j Q and the vertical line from G to i Q ,j Q()G Q Q Z j i ,,is the density trend of i Q ,j Q in the of plasticgarbage points and prescribe ()G Q Q Z j i ,,is the testing point i Q ’ s density of plastic garbage ,so there are calculation formula:()()∑∑∑∑==-==++++*=Ni N ij ji i ijGji i ijG N i Nj j i G Q Q GQ GPQ Q GQ GP G Q Q Z Z 11222222111,,Here we plug each year’s observational data in schedule 1 into our model, and draw the three-dimensional images of the spatial distribution of the marine garbage ’s density with Matlab in Figure (2) as follows:199920002002200520062007-2008(1)It’s observed and analyzed that, from 1999 to 2008, the density of plastic garbage is increasing year by year and significantly in the region of East – West 140W-150W, south - north 30N-40N. Therefore, we can make sure that this region is probably the center of the marine litter whirlpool. Gathering process should be such that the dispersed garbage floating in the ocean move with the ocean currents and gradually close to the whirlpool region. At the beginning, the area close to the vortex will have obviously increasable about plastic litter density, because of this centripetal they keeping move to the center of the vortex ,then with the time accumulates ,the garbage density in the center of the vortex become much bigger and bigger , at last it becomes the Pacific rubbish island we have seen today.It can be seen that through our algorithm, as long as the reference to be able to detect the density in an area which has a number of discrete measuring points,Through tracking these density changes ,we Will be able to value out all the waters of the density measurement through our models to determine,This will reduce the workload of the marine expedition team monitoring marine pollution significantly, and also saving costs .Task 3:The degradation mechanism of marine plasticsWe know that light, mechanical force, heat, oxygen, water, microbes, chemicals, etc. can result in the degradation of plastics . In mechanism ,Factors result in the degradation can be summarized as optical ,biological,and chemical。

建模美赛获奖范文全文共四篇示例,供读者参考第一篇示例:近日,我校数学建模团队在全国大学生数学建模竞赛中荣获一等奖的喜讯传来,这是我校首次在该比赛中获得如此优异的成绩。
本文将从建模过程、团队合作、参赛经验等方面进行详细介绍,希望能为更多热爱数学建模的同学提供一些借鉴和参考。
让我们来了解一下比赛的背景和要求。
全国大学生数学建模竞赛是由中国工程院主办,旨在促进大学生对数学建模的兴趣和掌握数学建模的基本方法和技巧。
比赛通常会设置一些实际问题,参赛队伍需要在规定时间内通过建立数学模型、分析问题、提出解决方案等步骤来完成任务。
最终评选出的优胜队伍将获得一等奖、二等奖等不同级别的奖项。
在本次比赛中,我们团队选择了一道关于城市交通拥堵研究的题目,并从交通流理论、路网优化等角度进行建模和分析。
通过对城市交通流量、拥堵原因、路段限制等方面的研究,我们提出了一种基于智能交通系统的解决方案,有效缓解了城市交通拥堵问题。
在展示环节,我们通过图表、数据分析等方式清晰地呈现了我们的建模过程和成果,最终赢得了评委的认可。
在整个建模过程中,团队合作起着至关重要的作用。
每个成员都发挥了自己的专长和优势,在分析问题、建模求解、撰写报告等方面各司其职。
团队内部的沟通和协作非常顺畅,大家都能积极提出自己的想法和看法,达成共识后再进行实际操作。
通过团队合作,我们不仅完成了比赛的任务,也培养了团队精神和合作能力,这对我们日后的学习和工作都具有重要意义。
参加数学建模竞赛是一次非常宝贵的经历,不仅能提升自己的数学建模能力,也能锻炼自己的解决问题的能力和团队协作能力。
在比赛的过程中,我们学会了如何快速建立数学模型、如何分析和解决实际问题、如何展示自己的成果等,这些能力对我们未来的学习和工作都将大有裨益。
在未来,我们将继续努力,在数学建模领域不断学习和提升自己的能力,为更多的实际问题提供有效的数学解决方案。
我们也希望通过自己的经验和教训,为更多热爱数学建模的同学提供一些指导和帮助,共同进步,共同成长。
Winter is approaching, may the dragon’s wings grow moreabundantSummaryIn the game of thrones, Daenerys Targaryen depicts the image of a dragon. In eastern and western cultures, the phenomenon of dragons is not uncommon. If dragons live in modern society, how can we raise these war monsters? Research, and applied the cross disciplines of biology, physics, and chemistry to build a mathematical model and solve it to achieve the maximum growth of the dragon. Of course, dragons do not exist in real life, so we likened pterosaurs, modern Aircraft and chemical burner to derive the specific physiological characteristics of the dragon to ensure the rationality and scientificity of the research.First, we studied the flight and fire-spitting models of dragons. Through analogical reasoning, our hypothetical dragon's fire-spitting principle is similar to modern alcohol flamethrowers. For dragon flight, we used fluid mechanics to get the dragon's flight speed. And glucose energy loss. Combining the two to get the energy loss model of the dragon. Second, we studied the basic physical characteristics of the dragon. For the relationship between the body length and body age of the dragon, we established an elastic model of growth. Because the weight and body length of dragons have upper and lower limits, in order to comply with basic ecology, we have defined the dragon's bone saturation value as the cut-off value, and conducted a segmented study. When studying the relationship between weight and body length, We know that the weight of the dragon is proportional to the cube of the body length. Then, because the dragon needs resources to replenish like other animals, we built a dragon's food supply model. Suppose that the three dragons have the same competitiveness and the daily sheep Resources are the same. According to ecology, when the number of sheep in a certain area reaches k / 2, we need to migrate the dragon. Finally, the temperature will affect the living environment of the dragon, so the dragon needs to followMigration was selected for changes in temperature, and we selected three areas of drought, cold, and warmth to study the dragon, and integrated the model of the regional area of the dragon by the appealing model.In addition, we wrote a letter to the author of the Song of Ice and Fire, giving some suggestions on the actual ecological foundation of the dragon, hoping to be adopted. Although the dragon does not exist in our real life, the dragon can be broken down into Part of our modern society. For the dragon's flying spitfire energy loss model, we can further study the aircraft's fluid mechanics and modern flamethrowers. The study of non-existent organisms also prepares us for the arrival of new species .table of ContentsWinter is approaching, may the dragon’s wings grow more abundant (1)Summary (1)table of Contents (2)1 Introduction (3)1.1 restatement (3)1.2 Problem Analysis (3)2 Assumptions and reasons (4)3 Symbol Definition (4)4. Mathematical modeling (5)4.1 About Dragon Flight and Spitfire Consumption (5)4.2 About the relationship between dragon's body length and weight and age (7)4.3 About Dragon's Food Supply (8)4.4 Regulating the area of dragons by region (9)5 Sensitivity analysis (10)6 Model evaluation and outlook (11)6.1 Model evaluation (11)6.2 Further discussion (12)7 to a letter from George RR Martin (12)8.Appendix: (13)8.1 References (13)8.2 Matlab code (13)1 Introduction1.1 restatementIn the magical TV series "Game of Thrones", Daenerys Targaryen, known as the Mother of Dragons, raised three dragons as an aggressive army. Dragons have always been the most mysterious monsters in Eastern and Western cultures, but if Dragons live in the present era, how should we feed the three dragons in pursuit of maximum growth? In this article, we assume that the growth rules of dragons are in line with basic biology. To study them, we build mathematical models to solve problem.a. Analyze the change of the dragon's weight length with age, and estimate the value of the dragon's weight length corresponding to the age group.b. Investigate the loss of self energy during dragon fire, flight, and breathing, so as to estimate the minimum supply value of dragon for external activitiesc. Dragons need food and survival areas like other animals in the real world. Through certain assumptions and calculations, we can determine the total amount of food that dragons need daily and the size of living areas in three areas.d. Sensitivity analysis: As temperature and climate change, dragons will also migrate to different regions. Therefore, we need to analyze the differences in the impact of dragons on the survival of arid regions, temperate regions, and cold regions.1.2 Problem AnalysisBecause dragons do not exist in real life, we need to use some things in the real world to compare dragons in order to achieve the purpose of studying dragons. In analyzing the biological morphological characteristics of dragons, we use the knowledge of ecology and basic elements of biology Let's conceive the basic biological characteristics of the dragon such as weight and body length. For the energy loss model of the dragon, we have studied three aspects to describe its loss. Here we compare the modern flamethrower and establish related chemical equations to achieve the research of the dragon. Spitfire loss. In addition, in TV series such as "Game of Thrones" we will find that dragons can fly in common sense, so we have derived the dragon's flight loss. Of course, all aerobic organisms can breathe. Dragons are no exception, so there is a loss of breathing to maintain body temperature. At the same time, in order to make up for the loss of dragons in daily activities, we have established a material reserve model, in which materials are cattle and sheep in real life, etc. Finally, during the cyclical changes in climate and food, the dragons we feed will also migrate to some extent, so we analyzed the impact of different regions on the growth of dragons.Into account various factors that we can more scientific training of dragons, have achieved our purpose.2 Assumptions and reasonsAfter a comprehensive analysis of the problem, in order to increase the enforceability, we make the following assumptions to ensure the rationality of our model establishment.2.1 Assumptions: The basic biological characteristics of dragons are in line with the law of biological growth. In modern life, the growth and development of dragons should also be similar to other animals and conform to basic biology.2.2 Assumption: The dragon will spit fire and fly, and its flight conforms to the physical environment of fluid mechanicsReason: In Game of Thrones, the image of the dragon was once able to fly and spit fire.2.3 Assumption: In the single field we are studying, the environment of a certain area will not change abruptly and maintain a dynamic stability.2.4 Hypothesis: Dragons are top predators in the food chain, but dragons do not cause devastating harm to the biosphere.2.5 Assumption: The weight distribution of the dragon is uniform, and the body length reaches 30 to 40 cm at the time of birth.Reason 2.6: We refer to ancient biology and some dinosaur fossils.2.7 Hypothesis: Except for the skull, heart, liver, lungs, kidneys, bones, etc., the sum of other body masses is proportional to the cube of height.Reason: The hypothesis is obtained by counting the relationship between body length and weight of modern organisms.2.8 Hypothesis: The dragon is a constant temperature animal whose body temperature is not affected by external factors.Reason: A few pterosaur fossils have traces of "hair" on the surface, while the dragons in Game of Thrones are similar to pterosaurs.2.9 Hypothesis: The dragon is fully aerobic during the flight to provide energy2.10 Hypothesis: A certain fixed ratio of the amount of energy that is not assimilated by the growth and metabolism of the dragon's breathing and other organisms2.11 Hypothesis: Dragon's Flight Similar to Modern Fighter3 Symbol Definition4. Mathematical modeling4.1 About Dragon Flight and Spitfire Consumption4.1.1 Proposed modelConsidering that dragons fly and spit fire during activities, we have established an energy loss model. Comparing the principle of dragon's spitfire with modern flamethrowers, modern flamethrowers consume hydrocarbons or alcohols. It does not cause any impact, so the dragon's fire-breathing principle is in line with the alcohol flame-thrower principle. Considering that the formaldehyde produced by the metabolism of methanol in the animal body is harmful to the body, we stipulate that ethanol is the fuel used by the dragon's flame. In the process, the relationship between the dragon's flight speed and glucose energy consumption is obtained according to fluid mechanics. In this process, we assume that the aerobic respiration is completely performed, and the energy consumed by the dragon due to flight is obtained according to the glucose consumption. In summary, the dragon energy loss model is obtained. .4.1.2 Establishment and Solution of Dragon's Spitfire ModelThe thermochemical equation for ethanol combustion is: C2H5OH (l) + 3O2 (g) = 2CO2 (g) + 2H2O (l) △H = -12KJ / gSpecify the energy released per unit mass of ethanol combustion x1When the dragon spit fire in unit time t, the unit mass of ethanol consumption is a fixed valueThe energy consumed by the fire time t1 is w1The mass consumed by the fire time T1 is m4Let the energy emitted by the combustion of unit mass of ethanol be w1 'Then W1 = x1 * tm4=W1/W1’Solve m4 = x1 * t / W1 '4.1.3 Establishment and Solution of Dragon Flight ModelDuring the flight of the dragon, it will be affected by the air resistance. In the ideal situation, the dragon's flight can be considered as a uniform acceleration and then a uniform speed, and it will decelerate when it is about to reach its destination.When Long uniform acceleration is specified, the acceleration is aSince the flight of the dragon is similar to that of a fighter, a = 30m / s ^ 2The speed of the dragon during uniform motion is v0The total flight length of the dragon during flight is sBecause air resistance is proportional to the speed of movement, that is, F1 = k * v (where k is a constant)Since the dragon's flight is similar to an airplane, we can get k = 3.2325Available according to the relevant kinematic formulaThe flying distance of the dragon during uniform acceleration is s1 = (v0) ^ 2 / 2aThe flying distance of the dragon during uniform deceleration is s3 = (v0) ^ 2 / 2aThe flying distance of the dragon during uniform motion is s2 = s-s1-s3Average air resistance during uniform acceleration F1 '= k * (0 + v0) / 2The average air resistance during uniform motion is F1 '' = k * v0Average air resistance during uniform deceleration f1 '' '= k * (v0 + 0) / 2According to the law of conservation of energyThe energy w2 consumed by the dragon during flight is all used for air resistance workW2=F1’*s1+F1’’*s2+F1’’’*s3Solve W2 = 3.2325 * v0 * s-3.2325 * (v0) ^ 3 / (2 * 30)During the flight of the dragon, the principle of energy provided by aerobic respiration isC6H12O6+6O2=6CO2+6H2OAmong them, the energy produced when 1g of glucose is completely consumed is 16KJThen the weight consumed in this process is m6 = W2 / 16[v,s]=meshgrid(0:0.1:100;0:0.1:100);m=3.2325*v*s-3.2325*v^3/60mesh(v,s,m)4.2 About the relationship between dragon's body length and weight and age4.2.1 Proposed ModelFirst, in order to study the relationship between the weight, length, and age of the dragon, that is, morphological characteristics, we established a model of elasticity during growth. The above-mentioned change curve is continuous, so we use the weight of the dragon at birth, and consider the weight and length of the dragon. The relationship between age changes can be used to derive the normal weight and body length of dragons in all ages. When analyzing the weight changes of dragons, biological knowledge shows that the amount of assimilation of the dragon is equal to the intake amount minus the amount of unassimilated amount Considering that the growth rate of the dragon in adulthood is a watershed, we use the saturation value of the dragon's head, heart, and liver as a cutoff value to estimate the relationship between the dragon's weight and age, respectively. When studying the body length of the dragon, according to the existing morphological knowledge, the head to hip of the dragon is used as the length standard. Because the weight of the dragon is proportional to the cube of the dragon's length, we get the weight and length Functional relationship. Of course, the daily weight gain of the dragon must be less than the daily energy consumption. In summary, we have a dragon intake model.4.2.2 Model establishmentSpecify the weight of the dragon as mDragon was born with a weight of m0 (known m0 = 10kg)Assume that the mass of cattle and sheep fed by a train every day is m2The assimilation amount of the dragon is fixed at a%A certain fixed ratio of the amount of unabsorbed energy due to growth and metabolism of organisms such as dragon's respiration, recorded as b%The weight gain of the dragon is m 'The sum of the weight of the dragon's head, heart, liver, lungs, kidneys, bones, etc. m1 increases with age y until adulthoodDragon is y1 when he is an adultThe growth rate of m1 is v1The mass of m1 at birth is m0Before the dragon reaches y1m1=m0+v1*yAfter the dragon reaches y1m1’=m0+v1*y14.2.3 Model Solvingm’=m2*(1-a%)*(1-b%)-m4-m6So the weight of the dragon m = m '+ m0Except for the dragon, except for the head, heart, liver, lungs, kidneys, bones, etc., the sum of other body masses is proportional to the cube of height, and the body length is recorded as l When the age of the dragon does not reach y1, l = (m-m1) ^ (1/3)When the age of the dragon reaches y1, l '= (m-m1') ^ (1/3)M2 =y=0:0.1:20function[y]= (m2*(1-a%)*(1-b%)-m4-m6-v1*y)y=20:0.1:100function[y]= (m2*(1-a%)*(1-b%)-m4-m6-v1*20)power(y,1/3)4.3 About Dragon's Food Supply4.3.1 Proposed modelBased on the above analysis, we studied the living area of the three dragons in the region andtheir impact on the ecological community in the region. For the sake of research, we assume that the other creatures in the region are cattle and sheep, and the competitiveness of the three dragons is comparable, Being a top predator in the food chain.4.3.2 Model establishmentThe local food chain can be approximated as: grass → cow or sheep → dragonAssume that the weight of the grass in the arid region, the warm temperate region, and the Arctic region is the same as m8.Remember that the mass of each cow and sheep is the same as m7We provide the same initial number of cattle and sheep in all three regionsAssume that the daily growth rate of cattle and sheep is c%The initial number of cattle and sheep is n1And n1 is the number of populations reaching k in the regionDragons live in this area. When the number of cattle and sheep reaches k / 2, in order to ensure the balance of the ecological environment, the dragons need to be moved to other regions.4.3.3 Model SolvingThe initial amount of cattle and sheep on day 1 is: n1The initial amount of cattle and sheep on the second day is: N2 = (N1-3 * m2 / m7) * (1 + c%) The initial amount of cattle and sheep on the third day is: N3 = ((N1-3 * m2 / m7) * (1 + c%)-3 * m2 / m7) * (1 + c%)……From this we can get the initial amount of Ni of cattle and sheep on day iI can be solved by the equation Ni = K / 2That is, the dragon needs to change a living area after living in the area for i days.4.4 Regulating the area of dragons by region4.4.1 Proposed modelIn order to ensure the normal growth of the dragon, we provide fixed-quality cattle and sheep as the supply of resources for the survival of the dragon region, and assume that the number of cattle and sheep is proportional to the size of the regional living area. Considering the growth rate of cattle and sheep, we have established a differential The equation draws the relationship between the growth rate of cattle and sheep and the age of the dragon. However, cattle and sheep will reach a growth saturation value at a certain moment, we will consider it in segments to ensure that the data is more scientific. In order to comply with ecology, cattle The supply of sheep should also have a lower limit. In summary, we have established a dragon-cow-sheep-living area function model.4.4.2 Model establishmentRemember that the assimilation rate of cattle and sheep grazing in this area is d%Because the solar energy received by the surface area of the three areas is different, the total area required for the grass under the same quality conditions is different. The utilization rate of the solar energy is required to be e% (0.5 <e <1 under the natural conditions of the search data)The solar energy per unit area in the arid area is q1Unit area solar energy in warm zone is q2Solar energy per unit area in the Arctic is q34.4.3 Model SolvingAccording to the utilization of solar energy, we can find:Area required to support the arid areas where the three dragons live: S1 = m8 / (q1 * e%)Warm zone: S2 = m8 / (q2 * e%)Arctic region: S3 = m8 / (q3 * e%)5 Sensitivity analysisImpact of climatic conditions on dragon lifeThe effect of climatic conditions on dragon growth can be obtained from the logistic growth model dm/dt=r*m*(1-m/k)That is m = 15 / (4 * t + 20);(Where m is the mass that the dragon can eventually grow into)Where m0 = 10 (k is the maximum carrying capacity of the ecosystem and r is a parameter of the environmental carrying capacity)k is 0.75r is 0.8dm/dt=0.8*m*(1-m/0.75)t=0:0.1:100;m=15./(4*t+20);plot(t,m)6 Model evaluation and outlook6.1 Model evaluationFor the idealized model of Yanglong, we have performed various aspects of modeling and solving, and the scope is relatively broad. Of course, the content has been streamlined to facilitate understanding and application. We have used physical and biological models based on The mathematical formulas are also encountered in the middle school stage. In these more basic models, we have solved efficiently, and at the same time, for the interdisciplinary problems of question a, we have considered the field that the ideal biology of dragons may involve and solve The process is relatively complete. In addition, the four models are closely related and logical. First, we consider the consumption of dragons in daily life, and use the results of consumption to calculate the weight and length of the dragon at various ages. In order to meet the requirements of all ages, we have established the ecological supply model of dragons, and discussed the problem of periodic alternating fields. Second, the fields are also scoped. Therefore, we calculated the scope of three areas with different climates. Interval problems. However, the models we build are idealized, the data is also streamlined, and the assumptions set are also fallible. In reality,The data is diverse and complex, and our considerations are obviously lacking, and further optimization is needed in the later stage. In summary, the model we built is very consistent with the solution of the problem. Although there are some flaws, it does not affect the specific Specific analysis of the problem.6.2 Further discussionCombining the models and evaluations described above, we will improve in the later stages. If this model is used in a specific environment, by statistic large amounts of real data, we can optimize the model. At the same time research also It will be more scientific and rigorous, and it will be more efficient for raising a fictional creature.7 to a letter from George RR MartinDear George RR MartinHope you are wellAfter reading the Song of Ice and Fire, we watched the "Game of Thrones". We became very curious about the mysterious giant that appeared in it-the dragon. Dragons are not uncommon in Eastern and Western cultures. In previous impressions However, there are few studies on dragons. So if we imagine that dragons live in modern times, what would it look like?According to the description of the dragon in the novel, we discussed the following questions. What are the ecological impacts and requirements of the dragon? What is the energy consumption of the dragon, what are their calorie intake requirements? How much area is needed to support the three dragons? Energy loss during fire? In response to these problems, we constructed a multivariate non-linear objective programming model of dragon's growth index and function, size, diet, growth changes, and other animal-related features. Considering the physical characteristics of dragons, we will Its fire-spitting ability is analogized to modern flame-throwers to ensure scientific and rational research.Based on these, we have established a mathematical model. The weight and length of the dragon also grows with the age of the dragon. When the dragon grows slowly at the initial 10 kilograms, the mass of sheep it needs each year also varies The growth of the supply chain of resources and the size of the ecological community should also change. The fire and flight of the dragon will also have a certain impact on the ecological environment. As the dragon and other creatures will migrate with changes in temperature, we choose The three regions of the cold zone, temperate zone and arid zone were taken as key research objects to find out the impact of climate change on Long.Therefore, we make the following suggestions, hoping that the survival of the dragon in the realm of science is more reasonable and scientific.When the herd resource is saturated, the dragon needs to expand the area living area.Dragons like warm, hydrated areas, and migrate to warm areas in the cold winter.A dragon has a certain weight and length when it is just born, and it will grow over time, but it also has an upper limit. It cannot grow endlessly.The daily energy intake of the dragon is limited, and the dragon spitfire flight consumes energy, which requires that the dragon's flight distance and spitfire time are limited, and it is related to the age of the dragon body.Because the living conditions of the three areas are different, the unit area will also receive solar energy differently, resulting in different resource distributions in each area, which means thatthe speed of dragon growth should also be different in different areas.The environmental carrying capacity of each area is limited, and the dragon does not stay in one place for long.The above content is the result of our research on the Queen of Dragons. We sincerely hope that you can adopt it, and we have been looking forward to your new book.Your fans: 27 groupsJanuary 7, 20208.Appendix:8.1 References1) Chen Yun.Research on Environmental Carrying Capacity of Yuhuan County [j] .Energy and Energy Conservation, 2014 (4): 31-33.2) Zhu Ziqiang.Aerodynamic design of modern aircraft [m] .Beijing: National Defense Industry Press, 2011-10-13) Jin Lan.Environmental Ecology [m] .Higher Education Press, 19928.2 Matlab codeModeling the flight of a dragon[v,s]=meshgrid(0:0.1:100;0:0.1:100);m=3.2325*v*s-3.2325*v^3/60mesh(v,s,m)Sensitivity Analysis of the Impact of Climate Conditions on Lifet=0:0.1:100;m=15./(4*t+20);plot(t,m)。
MCM 2015 Summary Sheet for Team 35565For office use onlyT1________________ T2________________ T3________________ T4________________Team Control Number35565Problem ChosenBFor office use onlyF1________________F2________________F3________________F4________________ SummaryThe lost MH370 urges us to build a universal search plan to assist searchers to locate the lost plane effi-ciently and optimize the arrangement of search plans.For the location of the search area, we divided it into two stages, respectively, to locate the splash point and the wreckage‟s sunk point. In the first stage, we consider the types of crashed aircraft, its motion and different position out of contact. We also consider the Earth‟s rotation, and other factors. Taking all these into account, we establish a model to locate the splash point. Then we apply this model to MH370. we can get the splash point in the open water is 6.813°N 103.49°E and the falling time is 52.4s. In the second stage, considering resistances of the wreckage in different shapes and its distribution affected by ocean currents, we establish a wreckage sunk point model to calculate the horizontal displacement and the angle deviation affected by the ocean currents. The result is 1517m and 0.11°respectively. Next, we extract a satellite map of submarine topography and use MATLAB to depict seabed topography map, determining the settlement of the wreckage by using dichotomy algorithm under different terrains. Finally, we build a Bayesian model and calculate the weight of corresponding area, sending aircrafts to obtain new evidence and refresh suspected wreckage area.For the assignment of the search planes, we divide it into two stages, respectively, to determine the num-ber of the aircraft and the assignment scheme of the search aircraft. In the first stage, we consider the search ability of each plane and other factors. And then we establish global optimization model. Next we use Dinkelbach algorithm to select the best n search aircrafts from all search aircrafts. In the second stage, we divide the assignment into two cases whether there are search aircrafts in the target area. If there is no search aircraft, we take the search area as an arbitrary polygon and establish the subdivision model. Considering the searching ability of each plane, we divide n small polygons into 2n sub-polygons by using NonconvexDivide algorithm, which assigns specific anchor points to these 2n sub-polygons re-spectively. If there exist search aircrafts, we divide the search area into several polygons with the search aircrafts being at the boundary of the small polygons. To improve search efficiency, we introduce” ma x-imize the minimum angle strategy” to maximize right-angle subdivision so that we can reduce the turning times of search aircraft. When we changed the speed of the crashed plane about 36m/s, the latitude of the splash point changes about 1°.When a wreck landing at 5.888m out from the initial zone, it will divorce from suspected searching area, which means our models are fairly robust to the changes in parameters. Our model is able to efficiently deal with existing data and modify some parameters basing the practical situation. The model has better versatility and stability. The weakness of our model is neglect of human factors, the search time and other uncontrollable factors that could lead to deviation compared to practical data. Therefore, we make some in-depth discussions about the model, modifying assumptions establish-Searching For a Lost PlaneControl#35565February 10, 2014Team # 35565 Page 3 of 47 Contents1 Introduction (5)1.1 Restatement of the Problem (5)1.2 Literature Review (6)2 Assumptions and Justifications (7)3 Notations (7)4 Model Overview (10)5 Modeling For Locating the Lost Plane (10)5.1 Modeling For Locating the Splash Poin t (11)5.1.1 Types of Planes (11)5.1.2 Preparation of the Model—Earth Rotation (12)5.1.3 Modeling (13)5.1.4 Solution of The Model (14)5.2 Modeling For Locating Wreckage (15)5.2.1 Assumptions of the Model (16)5.2.2 Preparation of the Model (16)5.2.3 Modeling (21)5.2.4 Solution of the Model (25)5.3 Verification of the Model (26)5.3.1 Verification of the Splash Point (26)5.3.2 Verification of the binary search algorithm (27)6 Modeling For Optimization of Search Plan (29)6.1 The Global Optimization Model (29)6.1.1 Preparation of the Model (29)6.1.2 Modeling (31)6.1.3 Solution of the Model (31)6.2 The Area Partition Algorithm (33)6.2.1 Preparation of the Model (33)6.2.2 Modeling (34)6.2.3 Solution of the Model (35)6.2.4 Improvement of the Model (36)7 Sensitivity Analysis (38)8 Further Discussions (39)9 Strengths and Weaknesses (41)9.1 Strengths (41)9.2 Weaknesses (42)10 Non-technical Paper (42)1 IntroductionAn airplane (informally plane) is a powered, fixed-wing aircraft that is propelled for-ward by thrust from a jet engine or propeller. Its main feature is fast and safe. Typi-cally, air travel is approximately 10 times safer than travel by car, rail or bus. Howev-er, when using the deaths per journey statistic, air travel is significantly more danger-ous than car, rail, or bus travel. In an aircraft crash, almost no one could survive [1]. Furthermore, the wreckage of the lost plane is difficult to find due to the crash site may be in the open ocean or other rough terrain.Thus, it will be exhilarating if we can design a model that can find the lost plane quickly. In this paper, we establish several models to find the lost plane in seawater and develop an op-timal scheme to assign search planes to model to locate the wreckage of the lost plane.1.1 Restatement of the ProblemWe are required to build a mathematical model to find the lost plane crashed in open water. We decompose the problem into three sub-problems:●Work out the position and distributions of the plane‟s wreckage●Arrange a mathematical scheme to schedule searching planesIn the first step, we seek to build a model with the inputs of altitude and other factors to locate the splash point on the sea-level. Most importantly, the model should reflect the process of the given plane. Then we can change the inputs to do some simulations. Also we can change the mechanism to apply other plane crash to our model. Finally, we can obtain the outputs of our model.In the second step, we seek to extend our model to simulate distribution of the plane wreckage and position the final point of the lost plane in the sea. We will consider more realistic factors such as ocean currents, characteristics of plane.We will design some rules to dispatch search planes to confirm the wreckage and de-cide which rule is the best.Then we attempt to adjust our model and apply it to lost planes like MH370. We also consider some further discussion of our model.1.2 Literature ReviewA model for searching the lost plane is inevitable to study the crashed point of the plane and develop a best scheme to assign search planes.According to Newton's second law, the simple types of projectile motion model can work out the splash point on the seafloor. We will analyze the motion state ofthe plane when it arrives at the seafloor considering the effect of the earth's rotation,After the types of projectile motion model was established, several scientists were devoted to finding a method to simulate the movement of wreckage. The main diffi-culty was to combine natural factors with the movement. Juan Santos-Echeandía introduced a differential equation model to simplify the difficulty [2]. Moreover,A. Boultif and D. Louër introduced a dichotomy iteration algorithm to circular compu-ting which can be borrowed to combine the motion of wreckage with underwater ter-rain [3]. Several conditions have to be fulfilled before simulating the movement: (1) Seawater density keeps unchanged despite the seawater depth. (2) The velocity of the wreck stay the same compared with velocity of the plane before it crashes into pieces.(3) Marine life will not affect our simulation. (4) Acting forceof seawater is a function of the speed of ocean currents.However the conclusion above cannot describe the wreckage zone accurately. This inaccuracy results from simplified conditions and ignoring the probability distribution of wreckage. In 1989, Stone et.al introduced a Bayesian search approach for searching problems and found the efficient search plans that maximize the probability of finding the target given a fixed time limit by maintaining an accurate target location probabil-ity density function, and by explicitly modeling the target‟s process model [4].To come up with a concrete dispatch plan. Xing Shenwei first simulated the model with different kinds of algorithm. [5] In his model, different searching planes are as-sessed by several key factors. Then based on the model established before, he use the global optimization model and an area partition algorithm to propose the number of aircrafts. He also arranged quantitative searching recourses according to the maxi-mum speed and other factors. The result shows that search operations can be ensured and effective.Further studies are carried out based on the comparison between model andreality.Some article illustrate the random error caused by assumptions.2 Assumptions and JustificationsTo simplify the problem, we make the following basic assumptions, each ofwhich is properly justified.●Utilized data is accuracy. A common modeling assumption.●We ignore the change of the gravitational acceleration. The altitude of anaircraft is less than 30 km [6]. The average radius of the earth is 6731.004km, which is much more than the altitude of an aircraft. The gravitational accele-ration changes weakly.●We assume that aeroengine do not work when a plane is out of contact.Most air crash resulted from engine failure caused by aircraft fault, bad weather, etc.●In our model, the angle of attack do not change in an air crash and thefuselage don’t wag from side to side. We neglect the impact of natural and human factors●We treat plane as a material point the moment it hit the sea-level. Thecrashing plane moves fast with a short time-frame to get into the water. The shape and volume will be negligible.●We assume that coefficient of air friction is a constant. This impact is neg-ligible compared with that of the gravity.●Planes will crash into wreckage instantly when falling to sea surface.Typically planes travel at highly speed and may happen explosion accident with water. So we ignore the short time.3 NotationsAll the variables and constants used in this paper are listed in Table 1 and Table 2.Table 1 Symbol Table–ConstantsSymbol DefinitionωRotational angular velocity of the earthg Gravitational accelerationr The average radius of the earthC D Coefficient of resistance decided by the angle of attack ρAtmospheric densityφLatitude of the lost contact pointμCoefficient of viscosityS0Area of the initial wrecking zoneS Area of the wrecking zoneS T Area of the searching zoneK Correction factorTable 2 Symbol Table-VariablesSymbol DefinitionF r Air frictionF g Inertial centrifugal forceF k Coriolis forceW Angular velocity of the crash planev r Relative velocity of the crash planev x Initial velocity of the surface layer of ocean currentsk Coefficient of fluid frictionF f Buoyancy of the wreckagef i Churning resistance of the wreckage from ocean currents f Fluid resistance opposite to the direction of motionG Gravity of the wreckageV Volume of the wreckageh Decent height of the wreckageH Marine depthS x Displacement of the wreckageS y Horizontal distance of S xα Deviation angle of factually final position of the wreckage s Horizontal distance between final point and splash point p Probability of a wreck in a given pointN The number of the searching planeTS ' The area of sea to be searched a i V ˆ The maximum speed of each planeai D The initial distance from sea to search planeai A The search ability of each plane is),(h T L i The maximum battery life of each plane isi L The mobilized times of each plane in the whole search )1(N Q Q a a ≤≤ The maximum number of search plane in the searching zone T(h) The time the whole action takes4 Model OverviewMost research for searching the lost plane can be classified as academic and practical. As practical methods are difficult to apply to our problem, we approach theproblem with academic techniques. Our study into the searching of the lost plane takes several approaches.Our basic model allows us to obtain the splash point of the lost plane. We focus on the force analysis of the plane. Then we We turn to simple types of projectile motion model. This model gives us critical data about the movement and serves as a stepping stone to our later study.The extended model views the problem based on the conclusion above. We run diffe-rential equation method and Bayesian search model to simulate the movement of wreckage. The essence of the model is the way to combine the effect of natural factors with distribution of the wreckage. Moreover, using distributing conditions, we treat size of the lost plane as “initial wreckage zone” so as to approximately describe the distribution. Thus, after considering the natural factors, we name the distribution of wreckage a “wreck zone” to minimize searching zone. While we name all the space needed to search “searching zone”.Our conclusive model containing several kinds of algorithm attempts to tackle a more realistic and more challenging problem. We add the global optimization model and an area partition algorithm to improve the efficiency of search aircrafts according to the area of search zone. An assessment of search planes consisting of search capabili-ties and other factors are also added. The Dinkelbach and NonConvexDivide algo-rithm for the solutions of the results are also added.We use the extended and conclusive model as a standard model to analyze the problem and all results have this two model at their cores.5 Modeling For Locating the Lost PlaneWe will start with the idea of the basic model. Then we present the Bayesian search model to get the position of the sinking point.5.1 Modeling For Locating the Splash PointThe basic model is a academic approach. A typical types of projectile behavior con-sists of horizontal and vertical motion. We also add another dimension consider-ing the effect of the earth's rotation. Among these actions, the force analysis is the most crucial part during descent from the point out of contact to the sea-level. Types of plane might impact trajectory of the crashing plane.5.1.1 Types of PlanesWe classify the planes into six groups [7]:●Helicopters: A helicopter is one of the most timesaving ways to transfer be-tween the city and airport, alternatively an easy way to reach remote destina-tions.●Twins Pistons: An economical aircraft range suitable for short distance flights.Aircraft seating capacity ranging from 3 to 8 passengers.●Turboprops: A wide range of aircraft suitable for short and medium distanceflights with a duration of up to 2-4 hours. Aircraft seating capacity ranging from 4 to 70 passengers.●Executive Jets:An Executive Jet is suitable for medium or long distanceflights. Aircraft seating capacity ranging from 4 to 16 passengers●Airliners:Large jet aircraft suitable for all kinds of flights. Aircraft seatingcapacity ranging from 50 to 400 passengers.●Cargo Aircrafts:Any type of cargo. Ranging from short notice flights carry-ing vital spare parts up to large cargo aircraft that can transport any volumin-ous goods.The lost plane may be one of these group. Then we extract the characteristics of planes into three essential factors: mass, maximum flying speed, volume. We use these three factors to abstract a variety of planes:●Mass: Planes of different product models have their own mass.●Maximum flying speed: Different planes are provided with kinds of me-chanical configuration, which will decide their properties such as flying speed.●Volume: Planes of distinct product models have different sizes and configura-tion, so the volume is definitive .5.1.2 Preparation of the Model —Earth RotationWhen considering the earth rotation, we should know that earth is a non-inertial run-ning system. Thus, mobile on the earth suffers two other non-inertial forces except air friction F r . They are inertial centrifugal force F g and Coriolis force F k . According to Newton ‟s second law of motion, the law of object relative motion to the earth is:Rotational angular velocity of the earth is very small, about .For a big mobile v r , it suffers far less inertial centrifugal force than Coriolis force, so we can ignore it. Thus, the equation can be approximated as follows:Now we establish a coordinate system: x axis z axis pointing to the east and south re-spectively, y axis vertical upward, then v r , ω and F r in the projection coordinate system are as follows:⎪⎪⎩⎪⎪⎨⎧++=⋅⋅-⋅⋅=++=kdt dz j dt dy i dt dx m v k j w kF j F i F F r rz ry rx r φωφωcos sinφis the latitude of the lost contact point of the lost plane. Put equation 1-3 and equa-tion 1-2 together, then the component of projectile movement in differential equation is:ma FF F k g r=++srad ⋅⨯=-5103.7ωmamv F r r =+ω2⎪⎪⎪⎩⎪⎪⎪⎨⎧+⋅=+⋅=+⎪⎭⎫ ⎝⎛+⋅-=m F dt dx w dt z d m F dt dx w dt y d m F dt dz dt dy w dtx d rz ry rx φφφφsin 2cos 2sin cos 22222225.1.3 ModelingConsidering the effect caused by earth rotation and air draught to plane when crashing to sea level, we analyze the force on the X axis by using Newton ‟s second law, the differential equation on x y and axis, we can conclude:In conclusion, we establish the earth rotation and types of projectile second order dif-ferential model:()⎪⎩⎪⎨⎧+-⋅'⋅⋅=''-⋅'+⋅'⋅⋅-=''-⋅'⋅⋅=''m gf y w m z m f z x w m y m f y w m x m obj 321cos 2cos sin 2sin 2.φφφφAccording to Coriolis theorem, we analyze the force of the plane on different direc-tions. By using the Newton ‟s laws of motion, we can work out the resultant accelera-tion on all directions:⎪⎪⎪⎪⎪⎪⎪⎪⎩⎪⎪⎪⎪⎪⎪⎪⎪⎨⎧'+'+'⋅'⋅⋅⨯+='+'+'⋅'⋅⋅⨯+='+'+'⋅'⋅⋅⨯+=⋅⋅-⋅⋅=⋅⨯=⋅'''⋅===-2222222225)()()(21)()()(21)()()(21cos sin 103.704.022z y x z c F f z y x y c F f z y x x c F f k j w s rad S y x F c D rz D ryD rx D ρρρφωφωωμφC D is the angle of attack of a plane flew in the best state, w is the angular speed of a moving object, vector j and k are the unit vector on y and z direction respectively,μisrx F y w m x m -⋅'⋅⋅⨯=''φsin 2()ry F z x w m y m -'+⋅'⋅⨯-=''φφcos sin 2mg F y w m z m rz +-⋅'⋅⋅⋅=''φcos 2the coefficient of viscosity of the object.5.1.4 Solution of the ModelWhen air flows through an object, only the air close to layer on the surface of the ob-ject in the laminar airflow is larger, whose air viscosity performance is more noticea-ble while the outer region has negligible viscous force [8]. Typically, to simplify cal-culation, we ignore the viscous force produced by plane surface caused by air resis-tance.Step 1: the examination of dimension in modelTo verify the validity of the model based on Newton ‟s second theorem, first, we standardize them respectively, turn them into the standardization of dimensionless data to diminish the influence of dimensional data. The standard equation is:Step 2: the confirmation of initial conditionsIn a space coordinate origin based on plane, we assume the earth's rotation direc-tion for the x axis, the plane's flight heading as y axis, the vertical downward di-rection for z axis. Space coordinate system are as follows:Figure 1 Space coordinate systemStep 3: the simplification and solutionAfter twice integrations of the model, ignoring some of the dimensionless in thesxx y i -=integral process, we can simplify the model and get the following:⎪⎪⎪⎩⎪⎪⎪⎨⎧+'⋅⋅⋅-⋅'⋅⨯='''-⋅⋅⋅-⋅'⋅⨯-=''⋅'⋅⨯=''g z m s c y w z y v m s c z w y y w x D D 220)(2cos 2)(2cos 2sin 2ρφρφφWe can calculate the corresponding xyz by putting in specific data to get the in-formation about the point of losing contact.Step 4: the solution of the coordinateThe distance of every latitude on the same longitude is 111km and the distance ofevery longitude on the same latitude is 111*cos (the latitude of this point) (km). Moreover, the latitude distance of two points on the same longitude is r ×cos(a ×pi/180) and the longitude distance of two points on the same latitude is: r ×sin(a ×pi/180)[9].We assume a as the clockwise angle starting with the due north direction and r as the distance between two points; X 、Y are the latitude and longitude coordinates of the known point P respectively; Lon , Lat are the latitude and longitude coordi-nates of the unknown point B respectively.Therefore, the longitude and latitude coordinates of the unknown point Q is:⎪⎪⎩⎪⎪⎨⎧⨯⨯+=⨯⨯⨯⨯+=111)180/cos()180/cos(111)180/sin(pi a r Y Lat pi Y pi a r X LonThus, we can get coordinates of the point of splash by putting in specific data.5.2 Modeling For Locating WreckageIn order to understand how the wreckage distributes in the sea, we have to understand the whole process beginning from the plane crashing into water to reaching the seaf-loor. One intuition for modeling the problem is to think of the ocean currents as astochastic process decided by water velocity. Therefore, we use a differential equation method to simulate the impact on wreckage from ocean currents.A Bayesian Searching model is a continuous model that computing a probability dis-tribution on the location of the wreckage (search object) in the presence of uncertain-ties and conflicting information that require the use of subjective probabilities. The model requires an initial searching zone and a set of the posterior distribution given failure of the search to plan the next increment of search. As the search proceeds, the subjective estimates of the detection will be more reliable.5.2.1 Assumptions of the ModelThe following general assumptions are made based on common sense and weuse them throughout our model.●Seawater density keeps unchanged despite the seawater depth.Seawater density is determined by water temperature, pressure, salinity etc.These factors are decided by or affected by the seawater density. Considering the falling height, the density changes slightly. To simplify the calculation, we consider it as a constant.●The velocity of the wreck stay the same compared with velocity of theplane before it crashes into pieces. The whole process will end quickly witha little loss of energy. Thus, we simplify the calculation.●Marine life will not affect our simulation.Most open coast habitats arefound in the deep ocean beyond the edge of the continental shelf, while the falling height of the plane cannot hit.●Acting force of seawater is a function of the speed and direction of oceancurrents. Ocean currents is a complicated element affected by temperature, wide direction, weather pattern etc. we focus on a short term of open sea.Acting force of seawater will not take this factors into consideration.5.2.2 Preparation of the Model●The resistance of objects of different shapes is different. Due to the continuityof the movement of the water, when faced with the surface of different shapes, the water will be diverted, resulting in the loss of partial energy. Thus the pressure of the surface of objects is changed. Based on this, we first consider the general object, and then revise the corresponding coefficients.●Ocean currents and influencing factorsOcean currents, also called sea currents, are large-scale seawater movements which have relatively stable speed and direction. Only in the land along the coast, due to tides, terrain, the injection of river water, and other factors, the speed and direction of ocean currents changes.Figure 2Distribution of world ocean currentsIt can be known from Figure 2 that warm and cold currents exist in the area where aircraft incidences happened. Considering the fact that the speed of ocean currents slows down as the increase of the depth of ocean, the velocity with depth sea surface currents gradually slowed down, v x is set as the initial speed of ocean currents in subsequent calculations.●Turbulent layerTurbulent flow is one kind of state of the fluid. When the flow rate is very low, the fluid is separated into different layers, called laminar flow, which do not mix with each other. As the flow speed increases, the flow line of the fluid begins to appear wavy swing. And the swing frequency and amplitude in-creases as the flow rate increases. This kind of stream regimen is called tran-sition flow. When the flow rate becomes great, the flow line is no longer clear and many small whirlpools, called turbulence, appeared in the flow field.Under the influence of ocean currents, the flow speed of the fluid changes as the water depth changes gradually, the speed and direction of the fluid is un-certain, and the density of the fluid density changes, resulting in uneven flow distribution. This indirectly causes the change of drag coefficient, and the re-sistance of the fluid is calculated as follows:2fkvGLCM texture of submarine topographyIn order to describe the impact of submarine topography, we choose a rectan-gular region from 33°33…W, 5°01…N to 31°42‟W , 3°37‟N. As texture is formed by repetitive distribution of gray in the spatial position, there is a cer-tain gray relation between two pixels which are separated by a certain dis-tance, which is space correlation character of gray in images. GLCM is a common way to describe the texture by studying the space correlation cha-racter of gray. We use correlation function of GLCM texture in MATLAB:I=imread ('map.jpg'); imshow(I);We arbitrarily select a seabed images and import seabed images to get the coordinate of highlights as follows:Table 1Coordinate of highlightsNO. x/km y/km NO. x/km y/km NO. x/km y/km1 154.59 1.365 13 91.2 22.71 25 331.42 16.632 151.25 8.19 14 40.04 18.12 26 235.77 13.93 174.6 14.02 15 117.89 14.89 27 240.22 17.754 172.38 19.23 16 74.51 12.29 28 331.42 24.455 165.71 24.82 17 45.6 8.56 29 102.32 19.486 215.75 26.31 18 103.43 5.58 30 229.1 18.247 262.46 22.96 19 48.934 3.51 31 176.83 9.188 331.42 22.34 20 212.42 2.85 32 123.45 3.239 320.29 27.55 21 272.47 2.48 33 32.252 11.7910 272.47 27.55 22 325.85 6.45 34 31.14 27.811 107.88 28.79 23 230.21 7.32 35 226.88 16.0112 25.579 27.05 24 280.26 9.93 36 291.38 5.46Then we use HDVM algorithm to get the 3D image of submarine topography, which can be simulated by MATLAB.Figure 3 3D image of submarine topographyObjects force analysis under the condition of currentsf is the resistance, f i is the disturbance resistance, F f is the buoyancy, G isgravity of object.Figure 4Force analysis of object under the conditions of currentsConsidering the impact of currents on the sinking process of objects, wheninterfered with currents, objects will sheer because of uneven force. There-。
2019年全国大学生数学建模竞赛题目A:高压油管的压力控制优秀论文范例三篇(含源代码)1. 引言高压油管是发动机燃油喷射系统中的重要组成部分,其压力的控制对于发动机的运行稳定性非常关键。
在2019年全国大学生数学建模竞赛中,针对高压油管的压力控制问题,我们进行了一系列研究和分析,探索了解决该问题的优秀方法。
本文将介绍三篇优秀论文范例,并提供源代码供读者参考。
2. 论文一:基于PID控制算法的高压油管压力控制2.1 问题描述本文从数学建模的角度出发,针对高压油管的压力控制问题提出了一种基于PID控制算法的解决方案。
该问题的要求是在给定的工况下,通过控制高压油泵的开关方式,使得一段时间内高压油管内的压力保持在一个预定的范围内。
2.2 算法设计本文提出了基于PID控制算法的高压油管压力控制方案。
PID控制是一种常用的反馈控制算法,通过不断调整控制器的参数,根据当前误差来调整控制信号。
在该方案中,我们将高压油管的压力误差作为PID控制器的输入,根据控制器输出的控制信号,调整高压油泵的开关状态。
通过不断的反馈调整,使得高压油管内的压力稳定在预定范围内。
2.3 仿真与实验结果本文通过对所提出的高压油管压力控制方案进行仿真与实验,验证了该方案的可行性和有效性。
仿真结果表明,通过PID控制算法,可以在较短的时间内将高压油管内的压力控制在预定范围内。
实验结果也进一步验证了方案的有效性。
2.4 源代码# PID控制算法实现def pid_control(p_error, i_error, d_error):Kp =0.5# 比例系数Ki =0.2# 积分系数Kd =0.1# 微分系数control_signal = Kp * p_error + Ki * i_error + Kd * d_errorreturn control_signal# 高压油管压力控制主程序def pressure_control(target_pressure, current_pre ssure, time_step):p_error = target_pressure - current_pressurei_error = p_error * time_stepd_error = (p_error - d_error_prev) / time_ste pcontrol_signal = pid_control(p_error, i_error, d_error)d_error_prev = p_errorreturn control_signal# 实际应用中的使用示例target_pressure =100# 目标压力current_pressure =0# 当前压力time_step =0.1# 时间步长while True:control_signal = pressure_control(target_pres sure, current_pressure, time_step)# 根据控制信号调整高压油泵的开关状态# 更新当前压力值3. 论文二:基于模型预测控制的高压油管压力控制3.1 问题描述本文针对高压油管的压力控制问题,提出了一种基于模型预测控制(MPC)的解决方案。
2019年优秀数学建模优秀论文范文优秀数学建模优秀论文范文数学建模是一种数学的思考方法,是运用数学的语言和方法,通过抽象,简化建立能近似刻画并"解决"实际问题的一种强有力的数学手段。
优秀数学建模优秀论文范文一:前言动画场景建模是动画场景构成的重要组成部分,设计中的场景是动漫游戏除了角色塑造随时间变化的所有设计。
美容,加强渲染主题,成功的设计可以提升场景动画电影,这样可以使渲染时动画更加饱满。
场景设计适当加强对影视作品的附加值,直接影响整个作品的风格和艺术水平。
一、三维游戏场景的研究背景及意义1、选题背景随着现代虚拟技术的到来,虚拟的三维现实技术以及三维景观建模技术得到了广泛的应用。
网络逐渐渗透人们的生活,并与之息息相关,其中以网络消费为代表的虚拟游戏消费所占比例最为庞大。
面对如此庞大的虚拟市场,游戏行业正逐步走向产业化。
随着近年来国内游戏产业的的不段发展变化,我认为民族的游戏产业的发展有着广阔的地域化特色及国际化市场,甚至大有占领主流游戏市场的趋势。
在当今游戏行业里三维技术的应用范围越来越广泛,在软件使用方面以3DSMAX、犀牛、COOL3D为主。
这其中3DSMAX是当今全球用户最多的一款三维场景制作软件。
他主要用于游戏场景建模和影视制作方面,面对庞大的市场当然也就需要规模化的产量与创作来满足市场需求,我国十分重视游戏行业的发展,现在越来越多的民族游戏在市场的驱动下不断面世,等待广大青年玩家的考验。
2、意义游戏场景的意义是创造娱乐的虚拟世界。
细腻,精致的游戏场景来衬托了游戏的整体氛围,玩家进入游戏中的角色的故事情节,游戏内容让游戏参与者可以感受到玩家游戏传输和游戏文化。
场景设计需要创造性的高度,并具有强烈的艺术。
动漫游戏场景不仅是图片,也不同于环境设计。
这是一个动画和游戏服务,以表演故事,完整的戏剧冲突,时空造型艺术字符的服务。
它是创造的动画和游戏,角色造型的基础上,按照时间线索的规定。
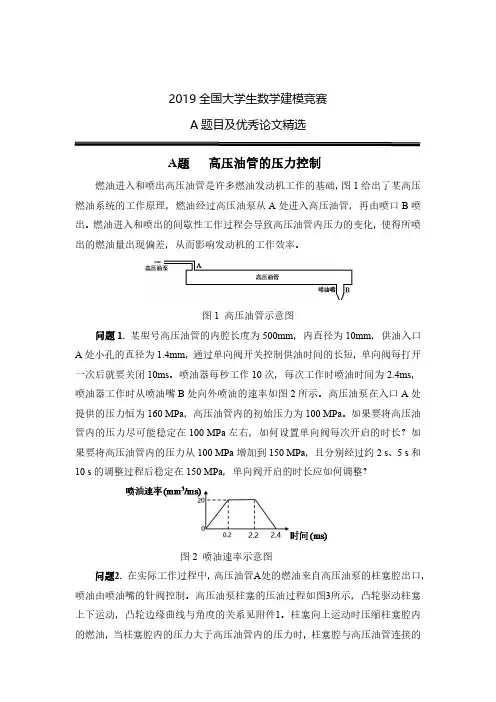
2019全国大学生数学建模竞赛A题目及优秀论文精选A题高压油管的压力控制燃油进入和喷出高压油管是许多燃油发动机工作的基础,图1给出了某高压燃油系统的工作原理,燃油经过高压油泵从A处进入高压油管,再由喷口B喷出。
燃油进入和喷出的间歇性工作过程会导致高压油管内压力的变化,使得所喷出的燃油量出现偏差,从而影响发动机的工作效率。
图1高压油管示意图问题1.某型号高压油管的内腔长度为500mm,内直径为10mm,供油入口A处小孔的直径为1.4mm,通过单向阀开关控制供油时间的长短,单向阀每打开一次后就要关闭10ms。
喷油器每秒工作10次,每次工作时喷油时间为2.4ms,喷油器工作时从喷油嘴B处向外喷油的速率如图2所示。
高压油泵在入口A处提供的压力恒为160MPa,高压油管内的初始压力为100MPa。
如果要将高压油管内的压力尽可能稳定在100MPa左右,如何设置单向阀每次开启的时长?如果要将高压油管内的压力从100MPa增加到150MPa,且分别经过约2s、5s和10s的调整过程后稳定在150MPa,单向阀开启的时长应如何调整?图2喷油速率示意图问题2.在实际工作过程中,高压油管A处的燃油来自高压油泵的柱塞腔出口,喷油由喷油嘴的针阀控制。
高压油泵柱塞的压油过程如图3所示,凸轮驱动柱塞上下运动,凸轮边缘曲线与角度的关系见附件1。
柱塞向上运动时压缩柱塞腔内的燃油,当柱塞腔内的压力大于高压油管内的压力时,柱塞腔与高压油管连接的单向阀开启,燃油进入高压油管内。
柱塞腔内直径为5mm,柱塞运动到上止点位置时,柱塞腔残余容积为20mm3。
柱塞运动到下止点时,低压燃油会充满柱塞腔(包括残余容积),低压燃油的压力为0.5MPa。
喷油器喷嘴结构如图4所示,针阀直径为2.5mm、密封座是半角为9°的圆锥,最下端喷孔的直径为1.4mm。
针阀升程为0时,针阀关闭;针阀升程大于0时,针阀开启,燃油向喷孔流动,通过喷孔喷出。
在一个喷油周期内针阀升程与时间的关系由附件2给出。
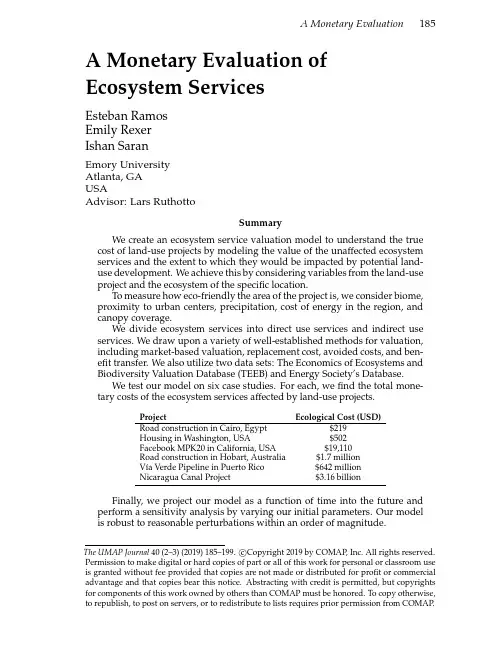
A Monetary Evaluation of Ecosystem ServicesEsteban RamosEmily RexerIshan SaranEmory UniversityAtlanta,GAUSAAdvisor:Lars RuthottoSummaryWe create an ecosystem service valuation model to understand the true cost of land-use projects by modeling the value of the unaffected ecosystem services and the extent to which they would be impacted by potential land-use development.We achieve this by considering variables from the land-use project and the ecosystem of the specific location.To measure how eco-friendly the area of the project is,we consider biome, proximity to urban centers,precipitation,cost of energy in the region,and canopy coverage.We divide ecosystem services into direct use services and indirect use services.We draw upon a variety of well-established methods for valuation, including market-based valuation,replacement cost,avoided costs,and ben-efit transfer.We also utilize two data sets:The Economics of Ecosystems and Biodiversity Valuation Database(TEEB)and Energy Society’s Database.We test our model on six case studies.For each,wefind the total mone-tary costs of the ecosystem services affected by land-use projects.Project Ecological Cost(USD)Road construction in Cairo,Egypt$219Housing in Washington,USA$502Facebook MPK20in California,USA$19,110Road construction in Hobart,Australia$1.7millionV´ıa Verde Pipeline in Puerto Rico$642millionNicaragua Canal Project$3.16billionFinally,we project our model as a function of time into the future and perform a sensitivity analysis by varying our initial parameters.Our model is robust to reasonable perturbations within an order of magnitude.The UMAP Journal40(2–3)(2019)185–199.c Copyright2019by COMAP,Inc.All rights reserved. Permission to make digital or hard copies of part or all of this work for personal or classroom use is granted without fee provided that copies are not made or distributed for profit or commercial advantage and that copies bear this notice.Abstracting with credit is permitted,but copyrights for components of this work owned by others than COMAP must be honored.To copy otherwise, to republish,to post on servers,or to redistribute to lists requires prior permission from COMAP.IntroductionOur task is to create a valuation model of ecological services to quan-tify the economic costs of environmental degradation caused by land-use development.Our model considers a potential project,takes into account many as-pects of the location of the project,and returns a monetary value that is estimated to be the value of the ecological service.This model’s purpose is to assist people in understanding the ecological cost of land-use projects in monetary terms.The main challenge faced in creating this model is assigning a monetary value to services that do not posses this value intrinsically.To overcome this difficulty,we utilize multiple established approaches and synthesizes them into a single model.We model land-use development projects of varying sizes in different locations.To evaluate the effectiveness and implications of our model,we perform sensitivity analysis and project our model into the future.Definitions•Ecological(or Ecosystem)Services are any services provided by an ecosystem which could be beneficiary to humans.Ecological services can be categorized into use(those which can be directly or indirectly used by humans)and non-use(those which cannot be used by humans). Controversy often arises with non-use ecological services,since it is con-tentious to place a price on that which offers no value.We consider non-use ecological services as“subservices”[Ecosystem Services Partnership 2019;van der Ploeg and de Groot2010].The ecological services that we consider include–carbon sequestration,–waterfiltration,–flood prevention,–erosion prevention,–recreation,–biodiversity protection,–fire prevention,–timber,–fuel wood and charcoal,–eco-tourism,–micro-climate regulation,–biochemicals,–natural irrigation,–plants and vegetable food,–hydroelectricity,–deposition of nutrients,–gas regulation,–soil formation,–cultural use,–drainage,and–science/research.•Valuation of a given service is the monetary value assigned to it.Since the value of a service must be of greater than or equal value than the price for consumers to purchase it,any monetary estimation of an eco-logical service will underestimate the true value of the service.•Direct Use services are measurable services produced by the ecosystem that directly benefit humans,such as carbon sequestration and ground water recharge.•Indirect Use services are services that don’t directly benefit humans but augment the benefits of direct use services,e.g.,biodiversity.The difficulty of measuring such services often results in calculating their demand-side valuation,i.e.,the value that the service provides for hu-mans.We use as sources for these values The Economics of Ecosys-tems and Biodiversity(TEEB)Database[Ecosystem Services Partnership 2019;van der Ploeg and de Groot2010],a database of ecosystem ser-vices values from many ecosystem valuation studies.The values used were calculated based on three well-established methods for ecosystem valuation:benefit transfer,direct market pricing,and replacement cost techniques.•Biome is the naturally occurringflora and fauna occupying a habitat and can be broadly categorized into terrestrial and marine[Kendeigh 1961].We consider only terrestrial.The biome types that we consider are:–tropical forests,–inland wetlands,–coastal wetlands,–cultivated areas,–woodlands,–deserts,–forests,and–grasslands.Assumptions•Clean water is accessible,and uncontaminated water sources vary lit-tle among one another.Since water can be piped or trucked in,we assume that it is accessible;in our model,we consider the distance to clean water.•Areas in the same ecosystem classification are equally productive.Even in ecosystems that are in the same classification,there can be huge va-riety.We assume that each biome is relatively uniform throughout,so that grouping by biome is sufficient to differentiate among projects.•Any impact scales linearly.An increase in the area linearly affects the factors used to calculate the monetary representation of the ecological cost.For example,if one tree sequesters N kg of CO2,then two trees sequester2N kg of CO2.•Energy costs accurately reflect the value of ecological services and ac-curately translate the costs of those services in different regions with differing energy costs.We translate some ecological costs into mone-tary value by calculating the approximate energy of ecological services and using the energy cost in the region.We assume that it is possible to estimate a conversion factor.•There is a non-linear inversely proportional relationship between the distance from an urban area and the value of ecosystem service[Trisos 2015;Zari2018].Therefore,we assume a relationship between urban-ization and ecosystem services.This means that access to clean water, biodiversity,and other similar services are affected by urban proximity.ModelModel VariablesWe use different methods to evaluate the monetary cost of varying eco-logical services,depending on the service.We use the equations below for carbon sequestration and waterfiltration and purification.Where we cannot estimate the direct cost of a service,we use costs from the TEEB Database[Ecosystem Services Partnership2019].cost(D,S i,P urban,E)=D+X i S i!(1+P urban)(1 E),where•D is the monetary value of direct use factors for the project,•S i is the i th service,•P urban is an index of proximity of the project to an urban setting,and•E is the eco-friendly index for the project.To avoid double-counting,we discard any values from the TEEB data set that deal with carbon sequestration,water purification,water filtration,and any ambiguities related to water or carbon dioxide purification.The urban proximity index and the eco-friendly index both range from 0to 1and are weighting factors that affect the final cost.•Urban proximity index:A value of 0corresponds to a location very close to an urban setting,defined as 5km or less.A value of 1corre-sponds to a rural location at least 50km from an urban environment.Urban areas have irrigation services and other utilities already in place.In rural settings,the landscape needs to be torn apart more to get the resources necessary,which leads to more damage to the ecosystem ser-vices that the land provides.We use a logarithmic scale because previ-ous literature indicates that this relationship is nonlinear [Zari 2018].•Eco-friendly index:A value of 0corresponds to a company that puts no effort into reducing its carbon footprint or using other environmentally-friendly practices.A value of 1corresponds to a company able to “live”in the ecosystem without damaging any of the services.For example,the Apple Park in California,USA would have a relatively high eco-friendly index,since it is the world’s largest naturally-ventilated building,with 7,000trees planted around campus and 100%renewable energy power-ing the campus [Miller 2018].For our six case studies,we estimate an index value.In reality,before a construction project is started,the com-pany can use a source for determining relative eco-friendliness,such as the 2017State of Green Business Index [Makover et al.2018].Further Equations•Total Cost of Direct Use Services We use a summation model with a time step of one year for the use of ecological features [Yang et al.2018].D (C,W )=C +W.We add together the monetary cost C of the energy used by carbon se-questration and the monetary cost W of the energy used to filter water;this is the total cost of the direct use services.•Energy of Carbon Sequestration The energy E C of carbon sequestra-tion per square meter of canopy cover is calculated by multiplying the energy E CO 2of carbon sequestration per pound of CO 2by the conver-sion factor E T and then by the energy efficiency p of photosynthesis.E C =E CO 2E T p.Table1.Symbols,definitions,and constants.Symbol DefinitionD(C,W)Monetary value(USD)of direct use services from an ecologi-cal area using energy calculations.C(A,F%,E$)Monetary value(USD)of carbon taken out of the atmosphere by plantsW(P w,A,E$)Monetary value(USD)of waterfiltered by the soil S List of ecosystem services in the TEEB dataset.P urban Index of urban proximity(0–1),with0being near an urban area and1being in a rural/remote areaE Eco-friendly indexA Area of the land-use project(m2).F%Canopy Percentage:Percentage of foliage coverage of1m2of land(%).E$Monetary value of energy varying depending on location (USD/Joule).u Urban proximity(m).P w Precipitation(mm/yr)b Biome,with data from TEEB Database[Ecosystem ServicesPartnership2019]Constant ValueE C Energy of carbon per square meter of canopy cover(117J/m2).p Energy efficiency of photosynthesis:26%[Lambers and Bassham2018].t Time(yr).E CO2Energy of CO2:5.045⇥106Jlb CO2[Evans n.d.]E T Energy of CO2per square meter:48lbs CO21m2[Lambers andBassham2018]E m Solar transformity:amount of energy required to produce1gof clean groundwater from soil due to rainfall:22.83J g[Yanget al.2018]⇢H2O Density of water:997kgm3。

美国⼤学⽣数学建模竞赛⼆等奖论⽂The P roblem of R epeater C oordination SummaryThis paper mainly focuses on exploring an optimization scheme to serve all the users in a certain area with the least repeaters.The model is optimized better through changing the power of a repeater and distributing PL tones,frequency pairs /doc/d7df31738e9951e79b8927b4.html ing symmetry principle of Graph Theory and maximum coverage principle,we get the most reasonable scheme.This scheme can help us solve the problem that where we should put the repeaters in general cases.It can be suitable for the problem of irrigation,the location of lights in a square and so on.We construct two mathematical models(a basic model and an improve model)to get the scheme based on the relationship between variables.In the basic model,we set a function model to solve the problem under a condition that assumed.There are two variables:‘p’(standing for the power of the signals that a repeater transmits)and‘µ’(standing for the density of users of the area)in the function model.Assume‘p’fixed in the basic one.And in this situation,we change the function model to a geometric one to solve this problem.Based on the basic model,considering the two variables in the improve model is more reasonable to most situations.Then the conclusion can be drawn through calculation and MATLAB programming.We analysis and discuss what we can do if we build repeaters in mountainous areas further.Finally,we discuss strengths and weaknesses of our models and make necessary recommendations.Key words:repeater maximum coverage density PL tones MATLABContents1.Introduction (3)2.The Description of the Problem (3)2.1What problems we are confronting (3)2.2What we do to solve these problems (3)3.Models (4)3.1Basic model (4)3.1.1Terms,Definitions,and Symbols (4)3.1.2Assumptions (4)3.1.3The Foundation of Model (4)3.1.4Solution and Result (5)3.1.5Analysis of the Result (8)3.1.6Strength and Weakness (8)3.1.7Some Improvement (9)3.2Improve Model (9)3.2.1Extra Symbols (10)Assumptions (10)3.2.2AdditionalAdditionalAssumptions3.2.3The Foundation of Model (10)3.2.4Solution and Result (10)3.2.5Analysis of the Result (13)3.2.6Strength and Weakness (14)4.Conclusions (14)4.1Conclusions of the problem (14)4.2Methods used in our models (14)4.3Application of our models (14)5.Future Work (14)6.References (17)7.Appendix (17)Ⅰ.IntroductionIn order to indicate the origin of the repeater coordination problem,the following background is worth mentioning.With the development of technology and society,communications technology has become much more important,more and more people are involved in this.In order to ensure the quality of the signals of communication,we need to build repeaters which pick up weak signals,amplify them,and retransmit them on a different frequency.But the price of a repeater is very high.And the unnecessary repeaters will cause not only the waste of money and resources,but also the difficulty of maintenance.So there comes a problem that how to reduce the number of unnecessary repeaters in a region.We try to explore an optimized model in this paper.Ⅱ.The Description of the Problem2.1What problems we are confrontingThe signals transmit in the way of line-of-sight as a result of reducing the loss of the energy. As a result of the obstacles they meet and the natural attenuation itself,the signals will become unavailable.So a repeater which just picks up weak signals,amplifies them,and retransmits them on a different frequency is needed.However,repeaters can interfere with one another unless they are far enough apart or transmit on sufficiently separated frequencies.In addition to geographical separation,the“continuous tone-coded squelch system”(CTCSS),sometimes nicknamed“private line”(PL),technology can be used to mitigate interference.This system associates to each repeater a separate PL tone that is transmitted by all users who wish to communicate through that repeater. The PL tone is like a kind of password.Then determine a user according to the so called password and the specific frequency,in other words a user corresponds a PL tone(password)and a specific frequency.Defects in line-of-sight propagation caused by mountainous areas can also influence the radius.2.2What we do to solve these problemsConsidering the problem we are confronting,the spectrum available is145to148MHz,the transmitter frequency in a repeater is either600kHz above or600kHz below the receiver frequency.That is only5users can communicate with others without interferences when there’s noPL.The situation will be much better once we have PL.However the number of users that a repeater can serve is limited.In addition,in a flat area ,the obstacles such as mountains ,buildings don’t need to be taken into account.Taking the natural attenuation itself is reasonable.Now the most important is the radius that the signals transmit.Reducing the radius is a good way once there are more users.With MATLAB and the method of the coverage in Graph Theory,we solve this problem as follows in this paper.Ⅲ.Models3.1Basic model3.1.1Terms,Definitions,and Symbols3.1.2Assumptions●A user corresponds a PLz tone (password)and a specific frequency.●The users in the area are fixed and they are uniform distribution.●The area that a repeater covers is a regular hexagon.The repeater is in the center of the regular hexagon.●In a flat area ,the obstacles such as mountains ,buildings don’t need to be taken into account.We just take the natural attenuation itself into account.●The power of a repeater is fixed.3.1.3The Foundation of ModelAs the number of PLz tones (password)and frequencies is fixed,and a user corresponds a PLz tone (password)and a specific frequency,we can draw the conclusion that a repeater can serve the limited number of users.Thus it is clear that the number of repeaters we need relates to the density symboldescriptionLfsdfminrpµloss of transmission the distance of transmission operating frequency the number of repeaters that we need the power of the signals that a repeater transmits the density of users of the areaof users of the area.The radius of the area that a repeater covers is also related to the ratio of d and the radius of the circular area.And d is related to the power of a repeater.So we get the model of function()min ,r f p µ=If we ignore the density of users,we can get a Geometric model as follows:In a plane which is extended by regular hexagons whose side length are determined,we move a circle until it covers the least regular hexagons.3.1.4Solution and ResultCalculating the relationship between the radius of the circle and the side length of the regular hexagon.[]()()32.4420lg ()20lg Lfs dB d km f MHz =++In the above formula the unit of ’’is .Lfs dB The unit of ’’is .d Km The unit of ‘‘is .f MHz We can conclude that the loss of transmission of radio is decided by operating frequency and the distance of transmission.When or is as times as its former data,will increase f d 2[]Lfs .6dB Then we will solve the problem by using the formula mentioned above.We have already known the operating frequency is to .According to the 145MHz 148MHz actual situation and some authority material ,we assume a system whose transmit power is and receiver sensitivity is .Thus we can conclude that ()1010dBm mW +106.85dBm ?=.Substituting and to the above formula,we can get the Lfs 106.85dBm ?145MHz 148MHz average distance of transmission .()6.4d km =4mile We can learn the radius of the circle is 40mile .So we can conclude the relationship between the circle and the side length of regular hexagon isR=10d.1)The solution of the modelIn order to cover a certain plane with the least regular hexagons,we connect each regular hexagon as the honeycomb.We use A(standing for a figure)covers B(standing for another figure), only when As don’t overlap each other,the number of As we use is the smallest.Figure1According to the Principle of maximum flow of Graph Theory,the better of the symmetry ofthe honeycomb,the bigger area that it covers(Fig1).When the geometric centers of the circle andthe honeycomb which can extend are at one point,extend the honeycomb.Then we can get Fig2,Fig4:Figure2Fig3demos the evenly distribution of users.Figure4Now prove the circle covers the least regular hexagons.Look at Fig5.If we move the circle slightly as the picture,you can see three more regular hexagons are needed.Figure 52)ResultsThe average distance of transmission of the signals that a repeater transmit is 4miles.1000users can be satisfied with 37repeaters founded.3.1.5Analysis of the Result1)The largest number of users that a repeater can serveA user corresponds a PL and a specific frequency.There are 5wave bands and 54different PL tones available.If we call a code include a PL and a specific frequency,there are 54*5=270codes.However each code in two adjacent regular hexagons shouldn’t be the same in case of interfering with each other.In order to have more code available ,we can distribute every3adjacent regular hexagons 90codes each.And that’s the most optimized,because once any of the three regular hexagons have more codes,it will interfere another one in other regular hexagon.2)Identify the rationality of the basic modelNow we considering the influence of the density of users,according to 1),90*37=3330>1000,so here the number of users have no influence on our model.Our model is rationality.3.1.6Strength and Weakness●Strength:In this paper,we use the model of honeycomb-hexagon structure can maximize the use of resources,avoiding some unnecessary interference effectively.It is much more intuitive once we change the function model to the geometric model.●Weakness:Since each hexagon get too close to another one.Once there are somebuildingsor terrain fluctuations between two repeaters,it can lead to the phenomenon that certain areas will have no signals.In addition,users are distributed evenly is not reasonable.The users are moving,for example some people may get a party.3.1.7Some ImprovementAs we all know,the absolute evenly distribution is not exist.So it is necessary to say something about the normal distribution model.The maximum accommodate number of a repeater is 5*54=270.As for the first model,it is impossible that 270users are communicating in a same repeater.Look at Fig 6.If there are N people in the area 1,the maximum number of the area 2to area 7is 3*(270-N).As 37*90=3330is much larger than 1000,our solution is still reasonable to this model.Figure 63.2Improve Model3.2.1Extra SymbolsSigns and definitions indicated above are still valid.Here are some extra signs and definitions.symboldescription Ra the radius of the circular flat area the side length of a regular hexagon3.2.2Additional AdditionalAssumptionsAssumptions ●The radius that of a repeater covers is adjustable here.●In some limited situations,curved shape is equal to straight line.●Assumptions concerning the anterior process are the same as the Basic Model3.2.3The Foundation of ModelThe same as the Basic Model except that:We only consider one variable(p)in the function model of the basic model ;In this model,we consider two varibles(p and µ)of the function model.3.2.4Solution and Result1)SolutionIf there are 10,000users,the number of regular hexagons that we need is at least ,thus according to the the Principle of maximum flow of Graph Theory,the 10000111.1190=result that we draw needed to be extended further.When the side length of the figure is equal to 7Figure 7regular hexagons,there are 127regular hexagons (Fig 7).Assuming the side length of a regular hexagon is ,then the area of a regular hexagon is a .The area of regular hexagons is equal to a circlewhose radiusis 22a =1000090R.Then according to the formula below:.221000090a R π=We can get.9.5858R a =Mapping with MATLAB as below (Fig 8):Figure 82)Improve the model appropriatelyEnlarge two part of the figure above,we can get two figures below (Fig 9and Fig 10):Figure 9AREAFigure 10Look at the figure above,approximatingAREA a rectangle,then obtaining its area to getthe number of users..The length of the rectangle is approximately equal to the side length of the regular hexagon ,athe width of the rectangle is ,thus the area of AREA is ,then R ?*R awe can get the number of users in AREA is(),2**10000 2.06R a R π=????????9.5858R a =As 2.06<<10,000,2.06can be ignored ,so there is no need to set up a repeater in.There are 6suchareas(92,98,104,110,116,122)that can be ignored.At last,the number of repeaters we should set up is,1276121?=2)Get the side length of the regular hexagon of the improved modelThus we can getmile=km 40 4.1729.5858a == 1.6* 6.675a =3)Calculate the power of a repeaterAccording to the formula[]()()32.4420lg ()20lg Lfs dB d km f MHz =++We get32.4420lg 6.67520lg14592.156Los =++=32.4420lg 6.67520lg14892.334Los =++=So we get106.85-92.156=14.694106.85-92.334=14.516As the result in the basic model,we can get the conclusion the power of a repeater is from 14.694mW to 14.516mW.3.2.5Analysis of the ResultAs 10,000users are much more than 1000users,the distribution of the users is more close toevenly distribution.Thus the model is more reasonable than the basic one.More repeaters are built,the utilization of the outside regular hexagon are higher than the former one.3.2.6Strength and Weakness●Strength:The model is more reasonable than the basic one.●Weakness:Repeaters don’t cover all the area,some places may not receive signals.And thefoundation of this model is based on the evenly distribution of the users in the area,if the situation couldn’t be satisfied,the interference of signals will come out.Ⅳ.Conclusions4.1Conclusions of the problem●Generally speaking,the radius of the area that a repeater covers is4miles in our basic model.●Using the model of honeycomb-hexagon structure can maximize the use of resources,avoiding some unnecessary interference effectively.●The minimum number of repeaters necessary to accommodate1,000simultaneous users is37.The minimum number of repeaters necessary to accommodate10,000simultaneoususers is121.●A repeater's coverage radius relates to external environment such as the density of users andobstacles,and it is also determined by the power of the repeater.4.2Methods used in our models●Analysis the problem with MATLAB●the method of the coverage in Graph Theory4.3Application of our models●Choose the ideal address where we set repeater of the mobile phones.●How to irrigate reasonably in agriculture.●How to distribute the lights and the speakers in squares more reasonably.Ⅴ.Future WorkHow we will do if the area is mountainous?5.1The best position of a repeater is the top of the mountain.As the signals are line-of-sight transmission and reception.We must find a place where the signals can transmit from the repeater to users directly.So the top of the mountain is a good place.5.2In mountainous areas,we must increase the number of repeaters.There are three reasons for this problem.One reason is that there will be more obstacles in the mountainous areas. The signals will be attenuated much more quickly than they transmit in flat area.Another reason is that the signals are line-of-sight transmission and reception,we need more repeaters to satisfy this condition.Then look at Fig11and Fig12,and you will know the third reason.It can be clearly seen that hypotenuse is larger than right-angleFig11edge(R>r).Thus the radius will become smaller.In this case more repeaters are needed.Fig125.3In mountainous areas,people may mainly settle in the flat area,so the distribution of users isn’t uniform.5.4There are different altitudes in the mountainous areas.So in order to increase the rate of resources utilization,we can set up the repeaters in different altitudes.5.5However,if there are more repeaters,and some of them are on mountains,more money will be/doc/d7df31738e9951e79b8927b4.html munication companies will need a lot of money to build them,repair them when they don’t work well and so on.As a result,the communication costs will be high.What’s worse,there are places where there are many mountains but few persons. Communication companies reluctant to build repeaters there.But unexpected things often happen in these places.When people are in trouble,they couldn’t communicate well with the outside.So in my opinion,the government should take some measures to solve this problem.5.6Another new method is described as follows(Fig13):since the repeater on high mountains can beFig13Seen easily by people,so the tower which used to transmit and receive signals can be shorter.That is to say,the tower on flat areas can be a little taller..Ⅵ.References[1]YU Fei,YANG Lv-xi,"Effective cooperative scheme based on relay selection",SoutheastUniversity,Nanjing,210096,China[2]YANG Ming,ZHAO Xiao-bo,DI Wei-guo,NAN Bing-xin,"Call Admission Control Policy based on Microcellular",College of Electical and Electronic Engineering,Shijiazhuang Railway Institute,Shijiazhuang Heibei050043,China[3]TIAN Zhisheng,"Analysis of Mechanism of CTCSS Modulation",Shenzhen HYT Co,Shenzhen,518057,China[4]SHANGGUAN Shi-qing,XIN Hao-ran,"Mathematical Modeling in Bass Station Site Selectionwith Lingo Software",China University of Mining And Technology SRES,Xuzhou;Shandong Finance Institute,Jinan Shandon,250014[5]Leif J.Harcke,Kenneth S.Dueker,and David B.Leeson,"Frequency Coordination in the AmateurRadio Emergency ServiceⅦ.AppendixWe use MATLAB to get these pictures,the code is as follows:1-clc;clear all;2-r=1;3-rc=0.7;4-figure;5-axis square6-hold on;7-A=pi/3*[0:6];8-aa=linspace(0,pi*2,80);9-plot(r*exp(i*A),'k','linewidth',2);10-g1=fill(real(r*exp(i*A)),imag(r*exp(i*A)),'k');11-set(g1,'FaceColor',[1,0.5,0])12-g2=fill(real(rc*exp(i*aa)),imag(rc*exp(i*aa)),'k');13-set(g2,'FaceColor',[1,0.5,0],'edgecolor',[1,0.5,0],'EraseMode','x0r')14-text(0,0,'1','fontsize',10);15-Z=0;16-At=pi/6;17-RA=-pi/2;18-N=1;At=-pi/2-pi/3*[0:6];19-for k=1:2;20-Z=Z+sqrt(3)*r*exp(i*pi/6);21-for pp=1:6;22-for p=1:k;23-N=N+1;24-zp=Z+r*exp(i*A);25-zr=Z+rc*exp(i*aa);26-g1=fill(real(zp),imag(zp),'k');27-set(g1,'FaceColor',[1,0.5,0],'edgecolor',[1,0,0]);28-g2=fill(real(zr),imag(zr),'k');29-set(g2,'FaceColor',[1,0.5,0],'edgecolor',[1,0.5,0],'EraseMode',xor';30-text(real(Z),imag(Z),num2str(N),'fontsize',10);31-Z=Z+sqrt(3)*r*exp(i*At(pp));32-end33-end34-end35-ezplot('x^2+y^2=25',[-5,5]);%This is the circular flat area of radius40miles radius 36-xlim([-6,6]*r) 37-ylim([-6.1,6.1]*r)38-axis off;Then change number19”for k=1:2;”to“for k=1:3;”,then we get another picture:Change the original programme number19“for k=1:2;”to“for k=1:4;”,then we get another picture:。
美赛2019数模A题论文解法思路美赛2019数模A题解法思路题目:权力的游戏养龙策略解法思路:建立龙的生长模型,求出龙需要的土地面积。
权力的游戏养龙策略问题数学模型摘要权力的游戏养龙策略是本文要解决的数学问题,为了明确权力的游戏养龙策略问题,本文针对权力的游戏养龙策略问题进行了分析建模,对权力的游戏养龙策略问题进行了参考文献研究,建立了权力的游戏养龙策略问题的相应模型,推导出权力的游戏养龙策略问题的计算公式,编写了权力的游戏养龙策略问题的计算程序,经过程序运行,得到权力的游戏养龙策略问题程序计算结果。
具体有:对于问题一,这是权力的游戏养龙策略问题最重要的问题,根据题目,对问题一进行了分析,参考已有的资料,建立了权力的游戏养龙策略问题一的数学模型,推导出问题一的计算公式,编写出权力的游戏养龙策略问题一的计算程序。
求出了权力的游戏养龙策略问题一的计算结果。
对于问题二,权力的游戏养龙策略问题二比问题一复杂的,是权力的游戏养龙策略问题的核心,分析的内容多,计算机的东西也多。
在权力的游戏养龙策略问题一的基础上,根据权力的游戏养龙策略问题,对问题二进行了分析,参考已有的资料,建立了权力的游戏养龙策略问题二的数学模型,推导出问题二的计算公式,编写出权力的游戏养龙策略问题二的计算程序。
求出了问题二的计算结果,并以图表形式表达结果。
对于问题三,权力的游戏养龙策略问题三是问题一和问题二的深入。
在问题一和问题二的基础上,根据权力的游戏养龙策略问题,对问题三进行了分析,参考已有的资料,建立了问题三的数学模型,推导出权力的游戏养龙策略问题三的计算公式,编写出权力的游戏养龙策略问题三的计算程序。
求出了权力的游戏养龙策略问题三的计算结果,并以图表形式表达结果,并且进行了分析讨论。
对于问题4,权力的游戏养龙策略问题4是问题一、问题二和问题三的扩展。
在问题一、问题二和问题三的基础上,根据权力的游戏养龙策略问题,对权力的游戏养龙策略问题4进行了分析,参考已有的资料,建立了权力的游戏养龙策略数学模型,推导出权力的游戏养龙策略问题4的计算公式,编写出问题4的计算程序。
Water, Water, EverywhereSummaryDue to population growth, economic development, rapid urbanization, large-scale industrialization and environmental concerns water stress has emerged as a real threat. [1]This paper was motivated by the increasing awareness of the need for fresh water since fresh water crisis is already evident in many areas on the world, varying in scale and intensity.Firstly, we testify water demand and supply sequence are stable by means of unit root test, then predict the freshwater demand and supply in 2025 by using ARMA Model and Malthus Population Model .Secondly, we give more concern on four aspects: Diversion Project, Desalinization, Sewage treatment and Conservation of water resources, building some models such as Cost-benefits analysis and Tiered water pricing model. Comparing the cost-benefit ratio, the sewage treatment cost-benefitratio is the smallest--0.142, that is to say it is more cost-efficient.Finally, we use our models to analyze the impacts of these strategies, we can conclude that conservation of water resources is the most feasible.Keywords:Cost-benefit analysis ARMA ModelTiered water pricing modelA Letter to a governmental leadershipFebruary 4, 2013Dear Sir,During the four days working, our team spares no effort using cost and benefits analysis determine water strategy for 2013 about how to use water efficiently to meet the need in 2025. Now, we outline our conclusion to you.z Diversion ProjectThe South-North Water Transfer Project is a multi-decade infrastructure project solved the unbalance of water resource. The cost is 6.2yuan/3m, and it will much higher while the distance is more than 40 kilometers.z DesalinizationDesalinization utilizes the enormous seawater and provides freshwater in a cheaper price. However, interior regions with water scarcity can hardly benefit from it as most desalinization manufacturers located on eastern coastal areas. The cost of production is 5.446 yuan/t, but the transport costs less the cost-efficient competitiveness. The cost can be decreased by using more advanced technology.z Sewage treatmentSewage treatment can relief the environmental impact of water pollution by removing contaminants from water, the cost of Sewage treatment is 0.5yuan/t. z Conservation of water resourcesConservation makes sure of the source of rational use of water. There are several approaches on water resources conservation, the main problem is the lack of supervision. The benefit-cost ratio is between 0.95 and 3.23, and it has a high return-investment ratio.z Each of the above water strategy has its own advantages and disadvantages, we should consider the aspects of economic, physical, environmental, geographical, and technique factors overall, then choose the optimal strategy for different area.Yours sincerely,COMAP #23052ContentI Introduction (2)II Assumptions (3)III Models (3)3.1 The prediction of freshwater shortage in 2025 (3)3.1.1 The prediction of freshwater demand (3)3.1.1.1 The description of basic model (3)3.1.1.2 Model building (4)3.1.1.3 Model prediction (5)3.1.2 The prediction of freshwater supply (7)3.1.2.1 Model building (7)3.1.2.2 Model prediction (8)3.1.3. Conclusion (9)3.2Water strategy (9)3.2.1 Diversion Project (9)3.2.2 Desalinization (14)3.2.3 Sewage Treatment (16)3.2.4 Conservation of water resources (19)3.2.4.1 Agricultural water saving (20)3.2.4.2 Life water saving (21)IV The influence of our strategy (25)4.1 The influence of Water Diversion Project (25)4.2 The influence of desalination (25)4.3 The influence of sewage treatment (26)4.4 Water-saving society construction (26)V References (27)VI Appendix (28)I IntroductionAccording to relevant data shows that 99 percent of all water on earth is unusable, which is located in oceans, glaciers, atmospheric water and other saline water. And even of the remaining fraction of 1 percent, much of that is not available for our uses. For a detailed explanation, the following bar charts show the distribution of Earth's water: The left-side bar shows where the water on Earth exists; about 97 percent of all water is in the oceans. The middle bar shows the distribution of that 3 percent of all Earth's water that is fresh water. The majority, about 69 percent, is locked up in glaciers and icecaps, mainly in Greenland and Antarctica.[2] Except for the deep groundwater which is difficult to extract, what can be really used in our daily life is just 0.26 percent of all water on earth.Figure 1 The distribution of Earth's waterFreshwater is an important natural resource necessary for the survival of all ecosystems. There is a variety of unexpected consequence due to the lack of freshwater: 6,000 children die every day from diseases associated with unsafe water and poor sanitation and hygiene; Unsafe water and sanitation leads to 80% of all the diseases in the developing world;[3]Species which live in freshwater may be extinct, thus, breaking the food chain balance severely; The development of economic slow down in no small measure.It is with these thoughts in mind, many people think freshwater is very important than ever before.So, how to use freshwater efficiently? What is the best water strategy? Readmore and you will find more.II AssumptionsIn order to streamline our model we have made several key assumptions :1. We chose China as the object study.2. The water consumption of the whole nation could be approximate regardedas the demand of water .3. The Precipitation is in accordance with the supply of water .4. No considering about sea level rising because of global warmingIII Models3.1 The prediction of freshwater shortage in 2025How much freshwater should our strategy supply? Firstly, our work is to predict the gap between freshwater demand and supply in 2025. We obtain thefreshwater consumption data from China Statistical Yearbook. 3.1.1 The prediction of freshwater demandWe forecast the per capita demand for freshwater by building the ARMA Model .3.1.1.1 The description of basic modelThe notation ARMA(p, q) refers to the model with p autoregressive termsand q moving-average terms. This model contains the AR(p) and MA(q) models,mathematical formula is:qt q t t t p t p t t t y y y y −−−−−−−−−−+++=εθεθεθεφφφ......22112211 (1) AR(p) modelt p t p t t t y y y y εφφφ+++=−−−...2211 (2) MA(q) model q t q t t t t y −−−−−−−=εθεθεθε....2211 (3)),.....,2,1(p i i =φ ,),.....,2,1(q j j =θare undetermined coefficients of themodel, t ε is error term, t y is a stationary time series.3.1.1.2 Model buildingAll steps achieved by using EviewsStep1: ADF test stability of sequenceNull hypothesis:1:0=ρH , 1:1≠ρH , ρis unit root.Table 1 Null Hypothesis: Y has a unit root Exogenous: Constant Lag Length: 3 (Automatic based on SIC, MAXLAG=3) t-Statistic Prob. Augmented Dickey-Fuller test statistic -5.3783580.0040 Test critical values: 1% level-4.582648 5% level -3.32096910% level -2.801384We know Prob=0.0040 that we can reject the null hypothesis, and thenydoesn’t have a unit root, in other words, is stationary series. Step 2: Building the ARMA ModelThen we try to make sure of p and q by using the stationary series y .Table 2Date: 02/02/13 Time: 11:08Sample(adjusted): 2001 2011Included observations: 11 after adjusting endpointsConvergence achieved after 12 iterationsBackcast: 1998 2000Variable Coefficie nt Std. Error t-StatisticProb.AR(1) 1.0105040.005813173.8325 0.0000MA(3) 0.9454040.03650725.89639 0.0000R-squared 0.831422 Mean dependent varAdjustedR-squared 0.812692 S.D. dependent varS.E. of regression 5.085256 Akaike info criterionSo, we can get the final model, is:310.9454041.010504−−+=t t t d y y ε (4)3.1.1.3 Model predictionStep 1: The prediction of per capita freshwater demandWe use model (4) to predict the per capita demand of freshwater in the year2025, the result as Figure3.Figure 2 sequence diagram of dynamic predictionFrom the diagram, we can see the per capita freshwater demand is raising.The detailed data as Table3: Table 3 2010 2011 2012 2013 2014 2015 2016 2017 483.3584 488.4357 493.5662 498.7507503.9896509.2836514.6332 520.03892018 2019 2020 2021 2022 2023 2024 2025 525.5015 531.0214 536.5993 542.2358547.9315553.6871559.503 565.3801(cu.m/person)Through the above efforts, we get the 2025 per capita freshwater demand is565.3801 cu.mStep 2: The prediction of the whole freshwater demandThe relationship among d Q ,t N ,daverage Q is: daverage t d Q N Q ×= (5)d Q is the whole demand of freshwater, t N is the total population ,daverage Q is per capita of freshwater demand.Then we etimate the total population by the Malthus Population Model . rt e N t N 0)(=[4] (6))(t N is the population at time t,0N is the population at time 0,r is net relative growth rate of the populationrt e N N 2011)2025(= (7)By calculating, we get:(billion)42.11.347)2025(1500479.0≈=×e N (8)At last,we could get the whole demand of freshwater while the time is 2025.38.5652.14)2025(×=×=daverage d Q N Q ()cu.m million 100 8028.396= (9)3.1.2 The prediction of freshwater supplySimilarily,we predict freshwater supply using the ARMA Model. 3.1.2.1 Model buildingStep1: ADF test stability of sequenceNull hypothesis:1:0=ρH , 1:1≠ρH , ρis unit root. Table 4 Null Hypothesis: D(Y) has a unit root Exogenous: Constant Lag Length: 2 (Automatic based on SIC, MAXLAG=3)t-Statistic Prob. Augmented Dickey-Fuller test statistic-9.433708 0.0002 Test critical values: 1% level -4.803492 5% level -3.40331310% level -2.841819From the table, we find that first difference of supply data is smooth, we canreject the null hypothesis, that is ()y D is a smooth series.Step 2: Building the ARMA ModelWe use the smooth series ()y D to make sure the number of order.Table 5Date: 02/02/13 Time: 14:16Sample(adjusted): 2002 2010 Backcast: 1999 2001Variable CoefficientStd. Error t-Statistic Prob. AR(1) 0.6351030.158269 4.012804 0.0051 MA(3) -0.9923370.069186-14.34306 0.0000 R-squared 0.812690 Mean dependent var 50.51111Adjusted R-squared 0.785931 S.D. dependent var 119.1793S.E. of regression 55.14139 Akaike info criterion 11.05081Sum squared resid 21284.01 Schwarz criterion11.09464 Log likelihood -47.72864 Durbin-Watson stat 2.895553Then ,we get the final model is:)0.992337D(-)0.635103D()(31−−=t t t s y y D ε (10) 3.1.2.2 Model predictionWe use the effective model to predict freshwater supply in short-term until theyear 2025.Figure 3 sequence diagram of dynamic predictionFrom the diagram, we can see the supply remains unchanged basically .T The detailed data as Table6: Table 6 2010 2011 2012 2013 2014 2015 2016 2017 5630.203 5630.594 5630.843 5631.0015631.1025631.1655631.206 5631.2322018 2019 2020 2021 2022 2023 2024 2025 5631.248 5631.258 5631.265 5631.2695631.2725631.2735631.275 5631.275(100 million cu.m)According to the above data,we gain the supply of freshwater 2025, is5631.275(100 million cu.m)3.1.3. ConclusionFrom the above result,we find a serious issue:Table 7Year Demand offreshwater Supply of freshwater Net demand Unit2025 8028.396 5631.275 2397.121(100 million cu.m)In the year 2025, China will face the serious situation of freshwater shortage, the gap will reach 2397.121(100 million cu.m), therefore, in order to avoid this, we need to determine a series strategy to utilize freshwater efficiently.3.2Water strategy3.2.1 Diversion ProjectOn one hand, in view of Figure4, we can get information: Southeast coast is of the maximum precipitation, followed by the northern region, the western least.Figure 4 Precipitation Allocation Map of Major CitiesOn the other hand, in view of Figure 5, we can get information: The northern region and the southern coastal areas have the most water consumption, the western use less.Figure 5 Water Use MapDetailed data see to attached Table8 and Table9.South-to-North Water Diversion ProjectThe South–North Water Transfer Project is a multi-decade infrastructure project of China to better utilize water resources. This is because heavily industrialized Northern China has a much lower rainfall and its rivers are running dry. The project includes a Eastern, a Central and a Western route.Figure 6 The route of South-to-North Water Diversion ProjectHere, we take Western Route Project (WRP) as a representative, analysis the cost and benefits. As the strategic project to solve the problem of poorer water Northwest and North China, WRP will divert water from the upper reach of Yangtze River into Yellow Rive.Cost and benefits analysisThe direct quantitative economic benefits include urban water supply economic benefits, ecological environment water supply economic benefits, and the Yellow River mainstream hydroelectric economic benefits.[5]Urban water supply economic benefits:(1) Calculation MethodIn view of the water shadow price is difficult to determine, the equivalent engineering is not easy to choose, and the lack of water loss index is unpredictable, combined with the stage job characteristics, we select the method of sharing coefficient to calculate the urban water supply economic benefits.(2) Calculation ParametersThe Water consumption quota of per ten thousand yuan industrial output value is based on status quota, the predicted water consumption quota of per ten thousand yuan output value according to reach in 2 0 2 0 is :Lanzhou tom/ ten thousand yuan, gantry to Sanmenxia HeKouZhen river section for 26 3m/ ten thousand yuan. After a comprehensive analysis, set the reach for 20 3industrial water supply benefit allocation coefficient values 2.0 %.(3) Calculation ResultsAccording to (1) and (2), get table 10:Table 10water supply 3.2 billion 3.mproject benefits 20 billion yuan.8yuan /3maverage economic benefit 70z Ecological environment water supply economic benefits:(1) Calculation methodTake Forestry and animal husbandry as the representative, calculate whoseirrigation Economic benefits, and consider the allocation function of water supply. Analyse forestry benefits in reference with the increased wood savings, Animal husbandry in reference with the increased output of animals which were feeded by the incresed irrigation pasture (represented by sheep), both Forestry and animal husbandry account for half of the Ecological environment water supply.(2) Calculation parameters Set the water consumption quotas of Forestry irrigation unified as 233750hm m , the water supply sharing coefficient of Xiang irrigation as 0.60. In the calculation of forestry benefit, the increase of accumulated timber amount is ()a hm m ⋅235.22, timber price is 3300m yuan ; in the calculation of animal husbandry benefit , the increased stocking rates of unit pasture area is 25.22hm , taken a standard sheep price as yuan 260.(3) Calculation ResultsAccording to (1) and (2), the ecological environment water supply economic benefits is 714.1 billion, in which, The Yellow River replenishment economic benefits is 008.1billion yuan.z Hydroelectric economic benefits.(1) Diversion increased energy indicators:The increased electricity indicators is 306.9billion h kw ⋅, capacity enlargement the scale of 241 ten thousand kw .(2) Calculation methodTake the Optimal equivalent alternative engineering cost method, chosen fire electricity as an alternative project which can meet the power requirements of grid electricity equally. The sum of alternative engineering required annualinvestment translation and the annual running costs is increased annual power generating efficiency of the Yellow River cascade hydropower stations. (3) Calculation parametersThe power plant construction investment of kw $450, duration of five years, the investment proportion were 10%, 25%, 35%, 25%, 5%. Both the economic life of mechanical and electrical equipment and the metal structures equipment are taken as 20 years, considering the update ratio as 80% of the original investment. Standard coal price is taken as 160 dollars, standard coal consumption is taken as ()h kw g ⋅350. The fixed run rates take 4.5%, thesocial discount rate is 12%, the hydropower economic useful life of 5 years.(4) Calculation ResultsBy analysis and calculation, the first phase of water regulation produce the hydropower economic benefit is 3.087 billion.z Total economic benefits:Preliminary cost estimates of the project diversionOn the basis of economic nature classification, the total cost includes themachinery depreciation charges, wages and welfare costs, repair costs, thecost of materials,water district maintenance fees, management fees, water fees, interest expense and other . Analysis in the light of various estimates condition, the cost of water diverted into the Yellow River is 31~7.0m yuan c =The cost-benefit rate ()85.8~2.61∈=rc ω (11) 3.2.2 DesalinizationThough diversion project can balance water supply between places one has enough water and the other has water shortage, the costs will higher than desalinization when the distance more than 40 kilometers.Desalinization and comprehensive utilization of the work are increasingly taking centre stage on the problem of solving freshwater scarcity. Many countries and areas devote to optimize an effective way by enhancing the development of science and technology.According to the International Desalination Association, in 2009,14,451 desalination plants operated worldwide, producing 59.9 million cubic meters per day, a year-on-year increase of 12.3%.[6] The production was 68 million 3m in 2010, and expected to reach 120million 3m by 2020; some 40 million 3m is planned for the Middle East.[7]China has built more than 70 sets of sea water desalinization device with the design capacity of 600,000m3 and an average annual growth rate of more than 60%; technology with independent intellectual property rights of a breakthrough in the reverse osmosis seawater membranes, high pressure pumps, devices for energy recovery achieved significant progress, the desalinization rate raises from 99.2% to 99.7%; conditions of industrial development and the desalination market has been basically formed.MethodsDe-salinization refers to any of several processes that remove some amount of salt and other minerals from saline water. More generally, desalination may also refer to the removal of salts and minerals.[8] Most of the modern interest in desalination is focused on developing cost-effective ways of providing fresh water for human use.There are two main methods of desalinization:1. Extract freshwater from saline water: Distillation (Multi-stage flash distillation, Vapor compression distillation, Low temperature multi-effect distillation), Reverse osmosis, Hydrate formation process, Solvent extraction, Freezing.2. Remove salt from saline water: Ion exchange process, Pressure infiltration method, Electroosmosis demolition method.For desalination, energy consumption directly determines the level of the cost of the key. Among the above methods, reverse osmosis is more cost-effective than the other ways of providing fresh water for human use. So, reverse osmosis technology has become the dominant technology in international desalinization of seawater.The following two figures show the working principle diagram of a reverse osmosis system.Figure7 working principle diagram of a reverse osmosis systemCost and benefits analysisTable 12 general costs for a reverse osmosis systemItem Unitprice(yuan/t)Chemicals cost 0.391electric charge 2.85Wages 0.034 Labor costWelfare 0.04 Administrative expenses 0.0008maintenance costs 0.23Membrane replacement cost 0.923Depreciationexpense Fixed assets depreciation0.97expenseTotal costs 5.446Table 13 general benefit for a reverse osmosis systemItem ValueHourly output(t) 10Working hours/day24 Daily output(t)240 Working days/year 365 Yearly output(t)87600 Yearly other benefits(yuan)310980 Unit water other benefits3.55 Water Price(yuan/t)8 Unit water total benefits11.55 Unit water total benefit 55.11=rWater cost-benefit ratio 4715.055.11446.52===r c w (12) 3.2.3 Sewage TreatmentSewage treatment is an important process of water pollution treatment. It uses physical, chemical, and biological ways removing contaminants from water . Its objective is to relief the environment impact of water pollution.This diagram shows a typical sewage treatment process.Figure 8 Sewage treatment flow mapTake Sewage Treatment Plant in east china as an example to analysis the cost and benefit of sewage treatment.Suppose:Sewage treatment scale d t x 100001=,The Sewage Treatment Plant workdays in a year 300=d ,Concession period is twenty to thirty years, generally 251=t years, Construction period is one to three years, generally 32=t years.Operation period = Concession period - Construction period.Cost estimation Table 14 fixed investment estimate c1(ten thousand Yuan)number project ConstructioninvestmentEquipment investment 1 Preprocessing stage38 27 2Biological treatment section 42 134 3End-product stage 11 44 4 Sludge treatment section 6323 5 accessory equipment 456 Line instrument 687 Construction investment 3008 Unexpected expense 809 Other expense 10010 Total investment975 Table 15 Operating expense estimate c2 (ten thousand Yuan)[9]number project expenses1 maintenance expenses 6.52 wages 103 Power Consumption 404Agent cost 10 5 Small meter operating cost 66.56 Amortization of intangibles 127Amortization of Construction 6.6 8Amortization of Equipment 19.8 9Annual total cost 104.9 10 Tons of water operation cost 0.29Annual total investment 15022213=+÷=c c c ten thousand YuanAnnual amount of sewage treatment t x x 3000000100003003001=×=×= Unit sewage investment t yuan t yuan x c c 5.03000000150000034=÷=÷= Benefit analysisSewage mainly comes from domestic sewage(40%), industrial sewage(30%), and the others(including stormwater , 30%)Sewage treatment price: domestic sewage is about t yuan 8.0, industrialsewage is about t yuan 5.1, and other is about t yuan 5.2.Unit sewage treatment approximate price t yuan t yuan t yuan tyuan p 52.1%302%305.1%408.01=×+×+×=Unit Sewage treatment benefit:t yuan p p r 52.321=+= Cost-benefit ratio 142.052.35.043===r c ω (13) 3.2.4 Conservation of water resourcesTo realize the sustainable development of water resources, one of the important aspects is the conservation of water resources. Saving water is thekey of conservation, so, we the construction of water-saving society is the keyof water resources conservation strategy.To construct the water-saving society, we give more concern about two aspects:agricultural water saving and life water saving. Finally, we analysis the cost andbenefit about water-saving society by building model.3.2.4.1 Agricultural water savingStrategic suggestions of water-saving agriculture1. Strengthen the government policies and public finance support2. Mobilizing all social forces to promote water-saving agriculture development3. Innovating enterprises to improve the science and technology4. Suggesting countries to regard water saving as a basic state policy5. Implement the strategy of science and technology innovationwater saving function product research and development as the key point, the research and development of a batch of suitable for high efficiency and low energy consumption, low investment, multi-function water saving and high efficient agriculture key technology and major equipment. Micro sprinkler irrigation water saving technology and equipment is the typical technology.[10] Typical analysis: drip irrigation technologyIrrigation uniformity DU and field irrigation water utilization αE can be expressed as the technical elements of the function :[11]),,,,,,(01co c in t F I S n L q f DU α=),,,,,,,(0SMD t F I S n L q f E co c in αα=RD SMD fc )(θθ−=in q is single discharge into earth,L is (channel) long,n is manning coefficient,0S is tiny terrain conditions,c I is soil infiltration parameters,αF is (channel) cross-sectional parameters,co t is irrigation water supply time,SMD is irrigation soil water deficit value,fc θ is the soil field capacity,θis the soil moisture content,RD is the root zone depth.According to the study we found that the use of modern surface irrigation technology such as sprinkler irrigation, micro spray irrigation and pressure irrigation system, can improve the utilization rate of water to 95%, better than common ground water saving irrigation mode, more than 1/2 ~ 2/3 of water-saving irrigation mode, therefore, advanced water saving technology is very important. 3.2.4.2 Life water saving China is a country with a large population and scarce water , so we should use water more reasonably and effectively.Tiered water pricing modelThe model is for all types of users in certain period to regulate basic water consumption, in the basic consumption, we collect fees by the basic price standard, when actual consumption beyond basic consumption, the beyond part will introduce penalty factor: the more water exceed, the higher punishment rate will be. For actual consumption is less than basic consumption, the user can get additional incentives, encouraging people to save water .[12] Three ladder water price modelWe assume that urban resident’s basic water consumption is 1q , the first stage water price is 1P , the second stage water price is 2P , by analogy, q P is used to express the water price in stage q , model formula is()()⎪⎪⎩⎪⎪⎨⎧−++−+−+=−)(11211121111m m q q q p q q p q p q q p q p q p p L L L (14) From the equation (14), that in the tiered water pricing system, as more price levers are divided, it will be more able to reflect the city water supply’s public property and public welfare, be much beneficial to motive users to save water . On the other hand, much more price levers will be bound to increase the transaction cost of both the water supplier and the water user . Seeing from practical application effects of the current step water price model , Three ladder water price model much meets the actual functional requirements of urban water supply system in our country, the specific pricing method see Figure 9.Figure 9 Taking three step level water price model, can to some extent, Contain people waste the limited water resources , promote enterprises into taking all kinds of advanced technologies to improve the Comprehensive utilization of water resources, and realize the goal of urban water conservation and limited water resources Sustainable and high-efficiency using and saving. In conclude, it’s an effective and feasible strategy at present.Cost-Benefit Analysis of water-saving society construction1. Cost-Benefit Analyses ModelThe benefit of the water-saving society construction n s B B B −= (15) :s B water use benefit of the whole society in Water-saving condition。
2019MCM/ICMSummary Sheet (Your team's summary should be included as the first page of your electronic submission.)Type a summary of your results on this page. Do not includethe name of your school, advisor , or team members on this page.Ecosystems provide many natural processes to maintain a healthy and sustainable environment after human life. However, over the past decades, rapid industrial development and other anthropogenic activities have been limiting or removing ecosystem services. It is necessary to access the impact of human activities on biodiversity and environmental degradation.The main purpose of this work is to understand the true economic costs of land use projects when ecosystem services are considered. To this end, we propose an ecological service assessment model to perform a cost benefit analysis of land use development projects of varying sites, from small-scale community projects to large national projects. We mainly focus on the treatment cost of environmental pollution in land use from three aspects: air pollution, solid waste and water pollution. We collect pollution data nationwide from 2010 to 2015 to estimate economic costs. We visually analyze the change in economic costs over time via some charts. We also analyze how the economic cost changes with time by using linear regression method. We divide the data into small community projects data (living pollution data) and large natural data (industrial pollution data). Our results indicate that the economic costs of restoring economical services for different scales of land use are different. For small-scale land, according to our analysis, the treatment cost of living pollution is about 30 million every year in China. With the rapid development of technology, the cost is lower than past years. For large-scale land, according to our analysis, the treatment cost of industrial pollution is about 8 million, which is lower than cost of living pollution. Meanwhile the cost is trending down due to technology development. The theory developed here provides a sound foundation for effective decision making policies on land use projects.Key words: economic cost , ecosystem service, ecological service assesment model, pollution.Team Control Number For office use onlyFor office use only T1 ________________F1 ________________ T2 ________________F2 ________________ T3 ________________Problem Chosen F3 ________________ T4 ________________F4 ________________EContent1. Introduction (3)2. Variable Description (3)2.1 Definitions (3)3. Model Definitions and Results (4)3.1 2010-2015 Air Pollution Virtual Governance Cost (4)3.2 2010-2015 Solid Waste Virtual Governance Cost (8)3.3 2010-2015 Water Pollution Virtual Governance Cost (11)3.4 Total Governance Data Analysis (14)3.5 Model Analysis Over Time (15)4. Conclusions (16)4.1 Strengths (17)4.2 Weakness (17)4.3 Model Improvement (17)5. References (18)1.IntroductionToday, with the rapid development of social industrialization and modernization, one thing we must admit is that in the process of industrialization in different regions, countries and even the whole world, we are trying to maximize the economic benefits of limited development space, but at the same time, the impact of decision-making on the biosphere is also ignored.It is well known that the biosphere provides many natural processes to maintain healthy and sustainable human living environments, which are called ecosystem services. It not only provides food, medicine and raw materials for industrial and agricultural production, but also maintains the life support system that human beings rely on for survival and development. At present, the internationally recognized ecosystem service function classification system is a classification method proposed by MA working group. MA's ecosystem service classification system divides the main service function types into four function groups: product, rule, culture and support. Thus, the ecosystem service function is the foundation of human civilization and sustainable development.But as we use and update our environment, we may limit or eliminate ecosystem services. Although these activities seem insignificant, they do affect the ecosystem to some extent.Therefore, we introduce the virtual cost management method, which aims to evaluate the cost of environmental degradation by calculating the cost of pollution control. This allows for a comprehensive assessment of projects under construction, thus ensuring the resilience and sustainability of ecosystem services while utilizing land resources.To ensure the integrity and the sustainable development of ecological system is the premise and foundation of development, If we simply pursue the speed of development and neglect the pressure that construction activities bring to the ecosystem, will inevitably produce the bad consequences, we must protect our earth, because it is not only our planet, but also the planet of our descendants.2.Variable Description2.1 DefinitionsTo measure the cost of environmental degradation, we introduced the following variables:Virtual governance costs: The environmental degradation value calculated by the pollution loss method is called the environmental degradation cost, which refers to the various damages caused by the pollutants discharged in the production and consumption process to the environmental function, human health and crop yield under the current governance level.Environmental loss method: In the SEEA framework, pollution loss method refers to the environmental value assessment method based on damage. This method uses certain technical means and pollution loss investigation to calculate all kinds of damages caused by environmental pollution.Biodiversity: Refers to the variety of life in an ecosystem; all of the living organisms within a given area.Biosphere: The part of the Earth that is occupied by living organisms and generally includes the interaction between these organisms and their physical environment.Ecosystem: A subset of the biosphere that primarily focuses on the interaction between living things and their physical environment.Ecosystem Services: The many benefits and assets that humans receive freely from our natural environment and a fully functioning ecosystem.Environmental Degradation: The deterioration or compromise of the natural environment through consumption of assets either by natural processes or human activities.Mitigate: To make less severe, painful, or impactful.Valuation: Refers to the estimating or determining the current worth of something.3.Model Definitions and Results3.1 2010-2015 Air Pollution Virtual Governance CostThe natural gas use proportion c1,c2 and c3 are collectively recorded as c, the gas use amount d1,d2 and d3are collectively recorded as d, and the natural gas operation cost f1,f2 and f3 are collectively recorded as f.In the modeling process, it is assumed that the garbage disposal cost, gas operation cost and central heating operation cost will not change in the next few years.Urbanization is often accompanied by land development and utilization. Urban construction is inseparable from industrial construction and improvement of human living environment. In this process, the continuous development and utilization of land, or the construction of large factories, or the increase of communities and parks, has a certain impact on the local ecology. Factory waste emissions and gas consumption to a certain extent polluted the air, causing irreversible damage to the ecological environment.The impact of land development and utilization on the atmosphere is manifold. In large national projects such as industrial projects, we focus on the costs of sulphur dioxide emissions and dust emissions. In small-scale community projects such as community life, we mainly study the governance cost from the perspective of gas use, and establish an ecological service evaluation model related to air pollution.When considering the function of ecological services, we first study the economic cost of land development and utilization from the perspective of large-scale land development and utilization. Large-scale land development generally includes the establishment and relocation of large companies, the laying of pipelines nationwide, and the establishment of large state-owned enterprises. The construction of large chemical plants in land development produces polluting gases during the development process or after the plant is put into use. Among them, sulfur dioxide and dust emissions accounted for a large proportion. Let's use these two types of pollution as an example to calculate the economic cost.Collecting China's SO2 and dust emissions from 2010 to 2015:The unit cost of SO2 and dustIt should be noted that in the process of treatment, the exhaust gas can not be completely treated. The virtual removal rate of SO2 was a2=90%, and the virtual removal rate of dust was b2=97%. The cost of waste gas treatment should be calculated by virtual management method. It is that the total amount of emissions× virtual removal rate× unit governance cost.SO2 governance cost=a×a2×a1Dust governance cost=b×b2×b1The calculations above can be used to estimate the cost of governance. Governance cost=SO2 governance cost+ dust governance cost.Secondly, when considering the function of ecological services, the cost of land development and utilization is studied from the perspective of small-scale land development and utilization. The development and utilization of small-scale land generally includes the construction of roads, sewers, houses and Bridges. Let's take the development of land for residential areas as an example. When people live in communities, using natural gas for heating and living also pollutes the air. We mainly consider the impact of artificial gas, natural gas and liquefied petroleum gas.Collecting data on gas use in urban areas of China from 2010 to 2015:Gas operating costs, urban population, urban gasification rate:The cost of domestic gas treatment is related to urban population, urban gas rate, gas consumption, various proportions of gas consumption, heating area and operating cost. We use hypothetical assumptions to define the cost of gas pollution control.Gas pollution control cost=∑(p −(1−q)×c ×d ×f )3n=1+(s 1-s 2)×eWhere n=1 is artificial gas, n=2 is natural gas, and n=3 is liquefied petroleum gas. The following estimates of governance costs can be obtained by calculation:3.2 2010-2015 Solid Waste Virtual Governance CostIn the calculation process, we assume that the unit governance cost is the same, including the cost of general solid waste management, the cost of hazardous waste management, the cost of household garbage removal, the cost of sanitary landfill, and the cost of harmless incineration.In the process of land development and utilization, both large-scale land use and small-scale land use will inevitably produce solid waste.In the process of construction and normal use, large factories mainly produce general solid waste and hazardous waste. There are two ways to treat solid waste: storage and disposal. When calculating the cost of industrial solid waste treatment, we can start with the cost of waste storage and management and the cost of waste disposal.Collecting data on China's industrial solid waste treatment from 2010 to 2015:HS means hazardous waste storage HD means hazardous waste disposal The unit cost of industrial solid waste:According to the above data, the virtual governance method is used to calculatethe cost of large-scale land development and utilization when the ecological service function is considered.Virtual governance cost of industrial solid waste=virtual waste management cost of storage waste+ virtual governance cost of disposal wasteVirtual governance cost of storage waste=e1+e2Virtual governance cost of disposal waste=f1+f2e1=a× (b1-a1)e2=c× (d1-c1)f1=b×b1f2=d×d1The virtual governance cost of industrial solid waste can be obtained by calculation:When small-scale land is used for community construction, a certain amount of household garbage will be produced. There are many ways to deal with household garbage. When calculating the treatment cost, we mainly follow three treatment methods: cleaning, sanitary landfill and innocuous incineration.Collecting the amount of domestic garbage generated by Chinese Residents from 2010 to 2015:Domestic garbage unit treatment cost:Virtual governance cost of domestic garbage=x1+y1+z1x1=m×(z-x)y1=n×(y+ z)z1=r× zThe processing cost of domestic garbage can be obtained by calculation:3.3 2010-2015 Water Pollution Virtual Governance CostThe next section considers the cost of water pollution control for land use projects. Based on the above two treatment costs, we still choose the virtual treatment cost method to calculate the annual water pollution treatment cost from 2010 to 2015. By looking up relevant materials, we know that water pollution involves a wide range of fields, including planting, livestock and poultry breeding, industry, urban life and rurallife. However, due to the lack of systematic treatment of sewage in agricultural production, we only consider the cost of virtual pollutants in industry and urban life. Here, we consider the water pollution of small community projects as urban life water pollution, while large national projects are considered as industrial sector water pollution.Pollutants in industrial wastewater include COD, ammonia nitrogen, petroleum and heavy metals. Here we consider the virtual governance cost of four pollutants, then the calculation formula of the virtual governance cost of industrial enterprises is:The virtual governance cost of the industrial sector=∑(pollutant emissions× virtual governance costs per unit of pollutants× virtual removal rate of pollutants), the total virtual governance cost is the sum of the virtual governance costs of various pollutants.Virtual domestic wastewater treatment costs include virtual management cost of COD and ammonia nitrogen virtual governance cost, namely virtual wastewater treatment cost = ∑ (pollutant discharge unit pollutant of virtual management cost virtual pollutants removal rate), namely industrial COD discharge quantity A1, industrial ammonia nitrogen emissions B1, C1 oil discharge, heavy metal emissions D1, cities COD discharge E1 and ammonia nitrogen emissions for F1.The cost of treatment of each pollutant is:It should be noted that the virtual removal rate of pollutants is not 100%, the removal rate of COD is 80%, the removal rate of ammonia nitrogen is 50%, the removal rate of petroleum is 80%, and the removal rate of heavy metals is 50%. The annual emissions of various pollutants are:Table 20 the annual emissions of industrial pollutantIndustrial COD annual emissions/10,000 tons Industrialammonia nitrogen annual emissions /10,000 tonsAnnual oil emissions/ 10,000 tons Annual heavy metal emissions / ton2015 293.50 21.70 1.50 313.70 2014 311.30 23.20 1.60 333.70 2013 319.50 24.60 1.70 366.30 Table 19 The cost of treatment of each pollutantUnit COD governance cost 800/ton Unit ammonia nitrogen treatment cost 100/tonUnit oil treatment cost 500/ton Unit heavy metal treatment cost 1000/ton Unit cost statistics (assuming the cost is the same)Then calculated by the above data:Industrial COD Treatment Cost=A1*80%*800Industrial Ammonia Nitrogen Treatment Cost=B1*50%*100Petroleum treatment cost=C1*80%*500Heavy metal treatment cost=D1*90%*1000Urban COD Treatment Cost=E1*80%*800Urban Ammonia Nitrogen Treatment Cost=F1*50%*100 Virtual cost of industrial water pollution=industrial COD treatment cost+ industrial ammonia nitrogen treatment cost+ petroleum treatment cost+ heavy metal treatment cost, namely:Virtual cost of industrial water pollution=industrial COD treatment cost+ industrial ammonia nitrogen treatment cost+ petroleum treatment cost+ heavy metal treatment cost, namely:Table 23 virtual cost of urban water pollution3.4 Total Governance Data AnalysisBased on the above three data, we put the three aspects of governance cost together to form the time governance cost chart, as shown in the figure below:Chart 1 Industrial integrated virtual governance costThe cost of industrial governance in 2011 was relatively larger than that in 2010. However, after 2011, the cost of industrial governance began to decline. Compared with the cost of industrial pollution governance, the cost of living management was much higher. The trend is to increase, then decrease, then increase and then decrease. Overall, the cost of living treatment fluctuates between about 245 billion yuan. According to the overall data trend, we find that both the cost of industrial governance and the cost of living governance are decreasing year by year. The main reason for the decrease is that the negative impacts of land use decrease year by year, which also reflects the global increasing attention to the impact of human activities on ecosystem services.3.5 Model Analysis Over TimeFrom the above data, we use the linear regression method to calculate the trend of the model with time. For the industrial governance cost, we set the year=x, the governance cost(10000yuan)=y, and then use the regression line equation to calculate The coefficients a~, b~:Calculate a~=8000000 b~=-214213The relationship between x and y can be obtained as follows: y=-214213x+8000000, that is, the governance cost decreases with time, so the following trend graph can be obtained:Chart 3 industrial governance costy = -214213x + 80000006,600,000.006,800,000.007,000,000.007,200,000.007,400,000.007,600,000.007,800,000.008,000,000.008,200,000.008,400,000.0020112012201320142015Industrial governance cost chartFor the cost of urban life governance, it can be seen from the above data that the governance cost changes periodically with time. It is preferable to consider the trend of moving average to predict the future cost of governance. Let be the forecast of governance cost for the next year. The number of periods in which n is moving average;is the pre-treatment cost, and represent the actual values of the first three periods of the previous two periods until the first n periods, then:In summary, the trend graph of life governance costs over time can be obtained:Chart 4 Life governance costAs can be seen from the above figure, the cost of urban living governance changes periodically with time, but it is still decreasing.4.ConclusionsBased on our analysis, we draw the following conclusions:In the process of social construction, we must recognize the construction of economic society, the development of land use cannot be separated from the existence of ecosystem services and environmental sustainable development, but should be developed in parallel. Thus in the process of land development and utilization, we should pay attention to protecting the ecological environment and correctly assess the economic cost of land development projects.In the analysis process, we found that the environmental degradation cost of large-scale industrial project construction is declining year by year, and the environmental degradation cost of small-scale project construction is not particularly large each year, we can reasonably extrapolate the results, the decline in environmental degradation costs for large industrial projects may be due to the increased efficiency of industrial waste treatment, as well as the application of clean energy, and more non-high environmentally hazardous industrial projects to replace high environmentally hazardous industrial projects. The changing trend ofenvironmental degradation costs for small-scale project construction also reminds us of the need to find new and more economical ways to deal with domestic pollution.Based on the virtual governance cost analysis, we put forward the policy of open land use in the future: Improving the ecological environment, Promoting sustainable development, Ensuring the normal operation of ecological environment services. In the future land development and construction projects, we should pay more attention to the assessment of ecological services, so that the development and utilization rate of land tends to be highly rationalized.4.1 Strengths●The model simulates the annual virtual governance cost and makes the resultaccurate and reliable.●In selecting the samples, we selected China's annual data on pollution control.China is a representative country. Therefore, the sample is representative and persuasive.●In the measurement model, linear regression and moving average are used tosimplify the model and ensure the rationality of data. As a result, the entire model is relatively easy to implement.●The model is used to simulate the data obtained, and the change trend isrepresented by graph at last, so that the result is more clear.4.2 Weakness●The linear equation is used to simplify the model and make the result moreintuitive, but due to the unpredictability and diversity of some factors, the regression analysis is limited in some cases.●Due to the limited space, we only considered the three main factors for calculatingthe low cost of environmental degradation,which means that there are still some factors that will affect the correctness of the model we built.●We only analyzed the data for six years, which means our results may still beinaccurate.●In addition, our model simulates the situation that unit governance cost remainsunchanged, without taking into account the fact that scientific progress reduces unit governance cost. In fact, this is unscientific.4.3 Model ImprovementIn the construction of the model, we assume that the unit governance cost remains unchanged, but with the progress of science and technology, the pollution governance technology will certainly increase and the governance cost will also decrease, so if this important factor is not evaluated, it is not scientific to make themodel in real life. In addition, our consideration of the model still requires a lot of data to simulate, and we do not use enough data in the validation process. We also need to further add factors that may affect model evaluation to the models we build to make them more practical.5. References[1]Ministry of Environmental Protection of the People's Republic of China. China Environmental Statistics Annual Report [R] China Environmental Press, 2011[2]Ministry of Environmental Protection of the People's Republic of China. China Environmental Statistics Annual Report[R] China Environmental Press, 2012[3]Ministry of Environmental Protection of the People's Republic of China. China Environmental Statistics Annual Report[R] China Environmental Press, 2013[4]Ministry of Environmental Protection of the People's Republic of China. China Environmental Statistics Annual Report[R] China Environmental Press, 2014[5]Ministry of Environmental Protection of the People's Republic of China. China Environmental Statistics Annual Report[R] China Environmental Press, 2015[6]Ministry of Environmental Protection of the People's Republic of China. China Environmental Statistics Annual Report[R] China Environmental Press, 2016[7]Fang Yu,《China Environmental Economic Accounting Technical Guide》,[M],2009[8]Wupeng Du, Qingxian Gao, Enchen zhang, Qilong Miao, Jianguo Wu, The Emission Status and Composition Analysis of Municipal Solid Waste in China,[J],Research of Environmental Sciences,2006,(19)[9]Feng Cai, Gangcai Chen, Feng Peng, Qingling Yang, Shibo Zhao, Sishu Xian, Fei Wu, Quantitative assessment of eco-environmental damage based on virtual diaposal cost approach,[J],Chinese Journal of Environmental Engineering,2015,(9)[10]National Bureau of Statistics: /[11]Ministry of Housing and Urban-Rural Development of the People’s Republic of China (MOHURD):/xytj/tjzljsxytjgb/jstjnj/index.html。