Chapter 10 VISION AND VIDEO MODELS AND APPLICATIONS
- 格式:pdf
- 大小:184.86 KB
- 文档页数:30

英语文章the giver 每章概述。
chapter1:The story begins with jonas' anxiety and tension, telling the events and feelings of jonas' family during the day and sharing them over the dinner tablechapter2Jonas talked to his parents, talked about the twelve-year-old ceremony at the dinner table, and expressed his anxiety. The parents used their own examples to reassure jonas.chapter3This chapter mainly tells the difference between jonas' ideas and others. He notices that gabo's eyes are different from others and profound. And her sister lily's desire to be a pregnant mother. Jonas and Arthur play the game and discover the change in the apple and secretly bring the apple back to study chapter4This chapter focuses on jonas who goes to volunteer work and admires the achievements of a boy named Benjamin. He also went to the nursing home to bathe the elderly, and they discussed Robert's liberation ceremonychapter5This chapter focuses on the jonas family's Shared dream story, where jonas shares his dream of "passion" with the family and his mother tells him that he needs to take pills every day from today chapter6This chapter is mainly about rituals. Children of different ages have their own rituals. This chapter is about lily's rituals. She had a wallet, and the rituals of every age gave her the right and the duty to do somethingchapter7This chapter mainly tells about the jobs that twelve-year-old children will be assigned to. Each child has a serial number. Fiona and Arthur were both assigned to the job they wanted, but jonas was skipped, and he wondered why.chapter8This chapter is mainly about jonas being chosen as the successor of memory. The election of a successor to a memory is very rare, and jonas was noticed a decade ago. This task requires integrity, intelligence, courage and vision. Jonas felt a little lost, not knowing what the future would be like. chapter9Chapter 9 focuses on jonas as the grantor of memory. His job is a little different, but very important. His parents are proud of him. But he felt something strange.chapter10This chapter focuses on the work of jonas, whose job it is to receive memories from memory givers,first of all to impart memories of snow, sledges, and hills, which he is very excited about.chapter11This chapter is mainly about the transmission of the old man's memory of jonas. Jonas felt the snow and sunburn by himself, which made him feel happy and uncomfortable. Jonas was surprised chapter12This chapter focuses on a new night in jonas' life, when gabriel feels restless and anxious, and jonas learns a new memory -- the colors of the rainbowchapter13Jonas knew the name of the color and felt the color, but only he and the old man could feel it. He tried to make Arthur feel it, but failed. He felt the community was ordinary.chapter14Jonas felt hunger and pain for the first time. He wondered why he could not share his memory with others and reduce his crying. The old man told him that would cause trouble.chapter15This chapter mainly describes that the grantor could not bear the pain caused by the war, jonas helped him to bear the pain, jonas saw the terrible situation caused by the war, he did not want to happen again.chapter16The chapter grantor passed on to jonas the memories of love and warmth, their favorite memories, but they were almost gone. Jonas went back to ask his parents if they loved him, only to be told that the word did not apply. Jonas didn't think it was right, and the next morning, jonas didn't take his medicine.chapter17This chapter is mainly about the jonas family. They go out to play a shooting game together, which reminds jonas of the scene of his last acceptance of war memory, which leads to the failure of his game.chapter18In this chapter, jonas asks the teacher about liberation, and the teacher tells him that the girl named rosemary ten years ago applied for liberation because she could not bear the pain brought by memory.chapter19Chapter 19 mainly focuses on jonas and memory imparting people together to talk about the liberation ceremony of twins in the morning. Jonas saw his father in the video that the twin with a lower weight was liberated, and jonas also learned that the so-called liberation was to kill the man, which made him hard to accept.chapter20This chapter says that jonas learned the truth, he felt very painful, difficult to accept the truth, so he discussed with the instructor a plan to escapechapter21This chapter focuses on jonas preparing to escape from the community, and his father says gabo will eventually be liberated. Jonas took gabo with him when he fled that night. He escaped on his bicycle during the night. They rode into the forest and dodged the search.chapter22This chapter focuses on jonas and gabo have been further and further away from the community, they all the way to avoid the search, relying on memory support, they found fruit juice to drink. The cold memory of the night evaded the search of the plane.chapter23This chapter focuses on jonas and gabo have come to the top of the mountain, the top of the mountain is very cold, and jonas's memory is disappearing faster and faster, he relies on the remaining memory to keep gabo alive, finally they recall the love of family and friends together feeling.如有侵权请联系告知删除,感谢你们的配合!。
大学人工智能英语教材翻译IntroductionIn recent years, artificial intelligence (AI) has become a ubiquitous presence in our lives, revolutionizing various industries and fields. To meet the growing demand for AI professionals, universities have started offering courses and developing textbooks on the subject. This article aims to translate key contents of a university-level AI English textbook into Chinese, providing students with a comprehensive resource to enhance their understanding of this rapidly evolving field.Chapter 1: Introduction to Artificial Intelligence人工智能简介Artificial intelligence, often referred to as AI, is a branch of computer science that focuses on the creation of intelligent machines capable of performing tasks that typically require human intelligence. AI can be divided into two categories: narrow AI, which is designed to perform a specific task, and general AI, which aims to replicate human-level intelligence across a wide range of domains.Chapter 2: Machine Learning机器学习Machine learning is a subset of AI that enables computers to learn and improve from experience without being explicitly programmed. It involves the development of algorithms and models that allow computers to analyze and interpret data, identify patterns, and make predictions or decisions basedon the observed information. Supervised learning, unsupervised learning, and reinforcement learning are the three main types of machine learning techniques.Chapter 3: Neural Networks神经网络Neural networks are a fundamental concept in AI. Inspired by the structure and function of the human brain, neural networks consist of interconnected nodes or artificial neurons. These networks learn from training data by adjusting the connections between nodes to optimize their performance. Deep learning, a subfield of AI, utilizes neural networks with multiple layers to solve complex problems and achieve higher accuracy in tasks such as image recognition and natural language processing.Chapter 4: Natural Language Processing自然语言处理Natural language processing (NLP) focuses on enabling computers to interact and understand human language in a natural and meaningful way. It involves the development of algorithms and models that can process, analyze, and generate human language, enabling tasks such as machine translation, sentiment analysis, and chatbot development. NLP plays a crucial role in bridging the gap between humans and AI systems.Chapter 5: Computer Vision计算机视觉Computer vision is an interdisciplinary field that deals with the extraction, analysis, and understanding of visual information from images or videos. Through the use of AI techniques, computers can recognize objects, detect and track motion, and perform tasks such as facial recognition and image classification. Computer vision has various applications, including autonomous vehicles, surveillance systems, and augmented reality.Chapter 6: Robotics and Artificial Intelligence机器人与人工智能The integration of AI and robotics has led to significant advancements in the field of robotics. AI-powered robots can perceive their environment, make autonomous decisions, and interact with humans and other robots effectively. This chapter explores the role of AI in robotics, discussing topics such as robot perception, robot control, and human-robot interaction.Chapter 7: Ethical and Social Implications of AI人工智能的伦理和社会影响As AI continues to advance, ethical considerations and potential societal impact become increasingly important. This chapter delves into the ethical dilemmas surrounding AI, including privacy concerns, biases in AI systems, and the impact of AI on employment and workforce. It emphasizes the need for responsible development and deployment of AI technologies, ensuring that they benefit humanity and uphold ethical standards.ConclusionIn conclusion, this article has provided a translated overview of key topics in a university-level AI English textbook. By familiarizing themselves with these concepts, students can deepen their understanding of artificial intelligence and its various applications. Moreover, this translation serves as a valuable resource for educators and researchers in the Chinese-speaking community who seek to expand their knowledge in this rapidly advancing field. With the continued development of AI, it is imperative to bridge language barriers and foster global collaboration in order to drive innovation and ensure responsible AI implementation.。
计算机视觉相关书籍计算机视觉是一门研究如何使计算机能够“看”的学科。
它涉及到图像处理、模式识别、机器学习等多个领域,是人工智能领域中的重要分支之一。
为了帮助读者更好地了解计算机视觉,以下是一些值得推荐的相关书籍。
1.《计算机视觉:模型、学习和推理》(Computer Vision: Models, Learning, and Inference)- Simon J.D. Prince这本书是计算机视觉领域的经典教材之一,全面介绍了计算机视觉的基本原理、方法和技术。
它不仅涵盖了传统的计算机视觉任务如图像分类、目标检测和图像分割,还介绍了最新的深度学习方法在计算机视觉中的应用。
2.《计算机视觉:算法与应用》(Computer Vision: Algorithms and Applications)- Richard Szeliski这本书是一本广泛使用的计算机视觉教材,它系统地介绍了计算机视觉领域的基本概念、算法和应用。
它涵盖了从图像形成和处理到三维重建和运动估计的各个方面,并提供了大量的实际案例和代码示例。
3.《深度学习:计算机视觉的理论与实践》(Deep Learning for Computer Vision)- Adrian Rosebrock这本书主要关注深度学习在计算机视觉中的应用。
它详细介绍了使用深度学习进行图像分类、目标检测、图像分割等任务的方法和技巧。
此外,它还介绍了如何使用流行的深度学习库如TensorFlow和Keras来实现计算机视觉应用。
4.《计算机视觉:现代方法》(Computer Vision: A Modern Approach)- David Forsyth, Jean Ponce这本书是一本综合性的计算机视觉教材,涵盖了计算机视觉的各个方面,包括图像处理、特征提取、目标检测、运动估计等。
它既介绍了传统的计算机视觉方法,又介绍了最新的深度学习技术在计算机视觉中的应用。

The 14th Five-Y ear Plan Starts A New Jour-ney to A Modernized Socialist Country2021 is a year of special im-portance in China’s modern-ization process, since it is the first year of the 14th Five-Year Plan and the start of a new journey to build a modern socialist country.In a period of f ive years, the Five-Year Plan specifies future direc-tion for economic and social develop-ment in China, and is an important way for China to carry out develop-ment strategies and build consensus on development. In March 2021, the 14th Five-Year Plan for National Economic and Social Development and the Long-Range Objectives Through the Year 2035 (draft) was adopted on National People’s Con-gress and Chinese People’s Political Consultative Conference (NPC and CPPCC).According to the 14th Five-Year Plan, to promote high-quality development during the 14th Five-Year Plan period, China has to carry out a new development concept for a new pattern in a new stage, insist on deepening supply-side structural reform, establish an effective system to encourage domestic demand and build a strong domestic market, un-swervingly promote reform and open-ing-up, strengthen the leading role of domestic grand circulation and the role of international circulation in im-proving the efficiency and level of do-mestic circulation, to secure healthy and mutual stimulating domestic and international dual circulation.The new Five-Year Plan highlights high-quality developmentThe 14th Five-Year Plan had 20major indicators of five categories to assess economic and social develop-ment results, and compared with last Five-Year Plan some indicators were new, some were newly described and some were deleted.As in previous Five-Year Plans, indicators of economic development category came first. H owever, the plan had no specific expected average annual GDP growth rate for next five years, but proposed to keep the econ-omy within a reasonable range and put forward specific goals according to each year’s situation.Expected indicators are antic-ipated goals by the central govern-ment, which will be achieved mainly through independent behavior of market players. In addition to GDP growth rate, there were two otherexpected indicators for “economic de-By Audrey Guo10velopment”: annual labor productivity growth (higher than GDP), and the urbanization rate of permanent urban residents (as high as 65% by 2025), reflecting the potential of future de-velopment.In terms of innovation-driven development, the indicators will be upgraded comprehensively in 2025: the value added from core industries in the digital economy will be in-creased to 10% of GDP, the annual average growth of total R&D spend-ing will be more than 7%, accounting for a higher percentage of GDP thanduring the 13th Five-Year Plan pe-riod, and the number of high-value invention patents per 10,000 people will come to 12.The drive of digital economy for economic and social development is becoming increasingly important, so it needs forward-looking minds to develop relevant indicators, reflecting that China is aiming at leading the industrial development, promoting high-quality economic development and building a new development pat-tern during the 14th Five-Year Plan period.The indicators related to inven-tion patents had a new modifier of “high value”, meaning more attention will be paid to the quality rather than the quantity of innovation. Compared with last Five-Year Plan, “contribution of scientific and technological advanc-es to economic growth” and “Internet access” were no longer listed as major indicators, reflecting the indicators were kept pace with the times.Of the 20 main indicators, 7 were directly related to the well-be-ing of people, making the plan truly considerate to people’s livelihood, including three new, namely surveyed urban unemployment rate (lower than 5.5%), number of practicing physi-cians (physician assistants) per 1,000 people (3.2), and nursery capacity for children under 3 years per 1,000 peo-ple (4.5).Compared with the 13th Five-Year Plan, two indicators of rural population lifted out of poverty and rebuilt housing in rundown urban ar-eas were moved out, since China has won the battle against poverty.The “resources and environ-ment” category in the 13th Five-Year Plan was replaced by “ecologicalconservation”, and all such indicatorsare obligatory targets. Although thenumber was cut to 5 from 10, eachof these indicators has great effects.Obligatory targets are commitmentsto the people, and indicators thatfurther strengthen the government’sresponsibility on the basis of antici-pation. 13.5% and 18% of reductionin energy consumption and carbondioxide emissions per unit of GDPrespectively, and 24.1% of forest cov-erage rate. These indicators will fullydemonstrate the “green” economicdevelopment in China.New stage and new goals ofdevelopment require the indicatorsystem to keep pace with the times.20 main indicators not only carry onthose of previous Five-Year Plans, butalso embody the innovations requiredby the new era, as they are more inline with the situation of economicand social development in China atpresent and in next five years.Ministries and commissionsare releasing developmentplans one after anotherState-owned Assets Supervisionand Administration Commission(SASAC): The digital economy, plat-form economy and sharing economywill be vigorously developed duringthe 14th Five-Year Plan periodOn April 16, 2021 at the pressconference, secretary general andnews spokesman of the SASAC,Peng Huagang said, during the 14thFive-Year Plan period, SASAC willguide enterprises to further grasp theopportunities in a new round of tech-nological revolution and industrialtransformation, focus on key sectorsof emerging industries with goodfoundation, features and advantages,and actively take part in the con-struction of new infrastructure, new-type urbanization and key projects oftransportation and water conservancy,etc., vigorously develop digital econ-omy, platform economy and sharingeconomy. While accelerate the cul-tivation of new drives for economicdevelopment.Ministry of Ecological Envi-ronment: China exceeded 2020 car-bon emission reduction goalOn June 4, 2021, according to theMinistry of Ecological Environment,the carbon emission intensity in 2020in China dropped by 18.8% comparedto 2015, exceeding the obligatorytarget of the 13th Five-Year Plan,while the share of non-fossil energyin China’s energy consumption cameto 15.9%, both exceeding the goalsfor 2020 set by China. In September2020, China made a solemn commit-ment to the world that China wouldstrive to achieve carbon emissionpeaking by 2030 and carbon neutralityby 2060. Therefore, in the outline of14th Five-Year Plan and Vision 2035,it was an important topic to developa green mind in production and lives,and to peak carbon emissions and sta-bilize and then decline.Ministry of Industry and Infor-mation Technology: Accelerate thedigital transformation of the manu-facturing industryThe 14th Five-Year Plan for theDevelopment of info-communica-tions Industry (the Plan) was officiallyissued in November 2021, which putforward the overall goal for the 14thFive-Year Plan period, namely, by2025 the overall scale of informationand communication industry willbe further expanded, the quality ofdevelopment will be signif icantlyimproved, the construction of a newdigital infrastructure is basicallycompleted which is high-speed andubiquitous, integrated and intercon-nected, intelligent and green, safe and Obligatory targetsare commitmentsto the people, andindicators thatfurther strengthenthe government’sresponsibility on thebasis of anticipation.11reliable, the innovation capacity will be greatly enhanced, new business models will flourish, and the ability to empower digital transformation and upgrading of the economy and society has been comprehensively strengthened. By the end of 2025, the information and communication in-dustry will reach a new level of green development, with a 15% reduction in comprehensive energy consumption per unit of total telecom services, and the PUE value of newly-built large and super-large data centers below 1.3.General Administration of Customs: Enhance the cooperation of the Belt and RoadOn July 27, 2021, the General Administration of Customs issued the 14th Five-Year Plan for Customs, specif y ing the development and implementation plans for the Belt and Road cooperation, construction of free trade zones, public health at ports, intellectual property protection, bio-safety at national gateway and anti-smuggling, etc. According to the plan, in the next five years, members of international customs cooperation mechanism along the Belt and Road will increase from 53 in 2020 to more than 90 in 2025, and the number of countries (regions) interconnected with China through overseas “sole window” will increase from 1 at pres-ent to 15, the number of countries (regions) who signed AEO (Autho-rized Economic Operator) mutual recognition arrangements with Chi-na will top 60 from 42. In next five years, 35 international sanitary ports will be constructed in China, to en-hance the ability of Chinese portsto respond quickly and effectively topublic health emergencies.Intellectual Property Office:Ensure the milestone goal of con-structing a strong intellectual prop-erty rights powerhouse as scheduledIn late October 2021, the StateCouncil issued National Plan forProtection and Application of Intel-lectual Property Rights During the14th Five-Year Plan Period, specify-ing “four new goals” for the IP-relat-ed work, which include scaling newheights in IP protection, achievingnew results in IP application, reachinga new stage in IP services, and mak-ing new breakthroughs in interna-tional IP cooperation. Meanwhile, itproposed to 8 anticipatory indicators,including in 2025 lifting the numberof high-value invention patents per10,000 people to 12, the number ofoverseas invention patents grantedto 90,000, the registered amount ofintellectual property pledge financingto RMB 320 billion, the total annualimport and export value of intellectu-al property royalties to RMB 350 bil-lion, the value added from patent-in-tensive industries to 13% of GDP, thevalue added from copyright industriesto 7.5% of GDP, the social satis-faction rate of intellectual propertyprotection to 82, and the convictionrate of first instance civil intellectualproperty cases to 85%, in order to en-sure the milestone goal of construct-ing a strong IPR powerhouse will becompleted as scheduled.Ministry of Commerce: Boostand deepen innovations in scienceand technology, institution, indus-try and business modelsRecently, the Ministry of Com-merce issued the Plan for High-qual-ity Development of Foreign Tradeduring the 14th Five-year Plan Peri-od, which highlighted the deepeninginnovations in science and technol-ogy, institution, industry and busi-ness models, outlined 10 major tasksincluding green trade, trade digita-lization, integration of domestic andforeign trade and other new trendsin international trade, to provideguidance for the innovative develop-ment of foreign trade. In 2021, newindustrial forms brought new growth:more than 2,000 overseas warehouseswere built, and in the first ten monthsfrom January to October of 2021,cross-border e-commerce import andexport grew by 19.5%. According tothe plan, during the 14th Five-YearPlan period, China will further expandthe opening-up of domestic market,encourage the import of high-qualityconsumer goods, increase the importof advanced technology, importantequipment, key components, energyresources products and agriculturalproducts in short in domestic mar-ket, optimize the list of cross-bordere-commerce retail imports, furtherpromote local processing of importsin border trade, and stimulate importsfrom neighboring countries, in order tovigorously develop trade of high-qual-ity, high-tech, high value-added greenand low-carbon products. 12。

To dear IE91ersEssentials of Contemporary management—made by yiwen 关于这份总结:这份总结是根据于瑞峰最后一节课所画的考试范围整理的,不考的内容一点没有涵盖^_^。
06、07年三套考题中简答、案例题出现过的重点内容结合答案的给分点详细整理在内,笑脸是最好背下来的,实在记不住至少加阴影的得理解性背下,毕竟作答大题时出现了关键词分数也就到手了。
最重要的三个提醒:一是最好的资料就是三份考题(不解释),二是考试时小简答题写两行就足够了(总得留点时间给案例题啊),三是祝考试顺利!奕雯Chapter 1.The Management Process Achieving High Performance【efficiency】A measure of how well or productively resources are used to achieve a goal. 【effectiveness】A measure of the appropriateness of the goals an organization is pursuing andManagerial FunctionsPlanning】Identifying and selecting appropriate goals【Organizing】Structuring working relationships in a way that allows organizational members to work together to achieve organizational goals.【Leading】Articulating a clear vision and energizing and enabling organizational members so that they understand the part they play in achieving organizational goals.【Controlling】Evaluating how well an organization is achieving its goals and taking action to maintain or improve performance.3.Levels of management【first-line manager】A manager who is responsible for the daily supervision of non managerial employees【Middle manager】A manager who supervises first-line managers and is responsible for finding the best way to use the resources to achieve organizational goals.【first-line manager】Identifying and selecting appropriate goals【top managers】A manager who establishes organizational goals, decides how departments should interact, and monitors the performanceof middle managers.4.Managerial Roles and skills(1) Managerial Roles Identified by Mintzberg【Decisional】→Entrepreneur(commit resources, decide expansion) →Disturbance Handler(deal with unexpected problems) →Resource Allocator → Negotiator交涉者(work with suppliers, distributors, labor unions, other organization)【Informational】→Monitor(evaluate managers,watch environment) →Disseminator传播者→Spokesperson代言人【Interpersonal】→Figurehead (直译是傀儡,意会下)→leader →liaison(establish alliances between different departments or different organizations)(2) Managerial Skills【conceptual skills】The ability to analyze and diagnose a situation and to distinguish between cause and effect. 【human skills】The ability to understand, alter, lead, and control the behavior of other individuals and groups. 【technical skills】Job specific knowledge and techniques that are required to perform an organizational roles.5.Management in a Global Environment(1) Building a Competitive AdvantageIncreasing efficiency →Increasing quality →Increasing speed, flexibility, and innovation→Increasing responsiveness to customers(2)Maintaining Ethical Standards(3)Managing a Diverse Workforce(4)Utilizing Information Technology and E-commerceChapter 3.Maintaining Ethical Standards1.Factors Influencing Behaviors:→External pressures from stockholders for increased organizational financial performance.→Internal pressures from top management on lower-level managers to increase the organization’s competitive performance and profitability.→Societal, cultural, and environment demands on the organization.2. Ethics and Stakeholders【stakeholders】Shareholders, employees, customers, suppliers, and others who have an interest, claim, or stake in an organization and in what it does.→Each group of stakeholders wants a different outcome and managers must work to satisfy as many as possible.→Managers have the responsibility to decide which goals an organization should pursue to most benefit stakeholders—decisions that benefit some stakeholder groups at the expense of others.【Ethics】Moral principles or beliefs about what is right or wrong.→Ethics guide managers in their dealings with stakeholders and others when the best course of action is unclear.→Managers often experience an ethical dilemma in choosing between theconflicting interests of stakeholders.3. Ethical Decision Models【Utilitarian Model】produces the greatest good for the greatest number of people.【Moral Rights Model】best maintains and protects the fundamental rights and privileges of the people affected by it.【Justice Model】distributes benefits and harms among stakeholders in a fair, equitable, or impartial way.Chapter 4.Managing in a global environment 【organizational environment】A set of forces and conditions that operate beyond an organization’s boundaries but affect a manager’s ability to acquire and utilize resources1. The task environment【suppliers】Individuals and organizations that provide an organization with the input resources that it needs to produce goods and services. (eg. Raw materials, component parts, labor) 【distributors】Organizations that help other organizations sell their goods or services to customers. 【customers】Individuals and groups that buy goods and services that an organization produces. 【competitors】Organizations that produce goods and services that are similar to a particular organization’s goods and services. Barriers to Entry —Government regulations, Brand loyalty, Economies of scale2. The general environment【Economic Forces】Interest rates, inflation, unemployment, economic growth, and other factors that affect the general health and well-being of a nation or the regional economy of an organization【Technological Forces】Outcomes of changes in the technology that managers use to design, produce, or distribute goods and services.【Sociocultural Forces】Pressures emanating from the social structure of a country or society or from the national culture.【Demographic Forces】Outcomes of change in, or changing attitudes toward, the characteristics of a population, such as age, gender, ethnic origin, race, sexual orientation, and social class.【Political and legal Forces】Outcomes of changes in laws and regulations, such as the deregulation of industries, the privatization of organizations, and increased emphasis on environmental protection.【Global Forces】Outcomes of changes in international relationships3. The changing global environment(1)The role of national culture【Values】Ideas about what a society believes to be good, desirable and beautiful【Norms】Unwritten rules and codes of conduct that prescribe how people should act in particular situations.【Hofstede’s Model of National Culture】【Individualism versus Collectivism】Individualism values individual freedom and self-expression and holds a strong belief in personal rights and the need for persons to be judged by their achievements rather their social background. Collectivism values subordination of the individual to the goals of the group.(Japan )【Power Distance】A society’s acceptance of differences in the well bei ng of citizens due to differences in heritage, and physical and intellectual capabilities (individualism).In high power distance societies, the gap between rich and poor becomes very wide (e.g., Panama and Malaysia).In the low power distance societies of western cultures (e.g., United States and Germany), the gap between rich and poor is reduced by taxation and welfare programs.【Achievement versus Nurturing Orientation】Achievement-oriented societies value assertiveness, performance, and success and are results-oriented. (United States and Japan)Nurturing-oriented cultures value quality of life, personal relationships, and service.( Sweden and Denmark)【Uncertainty Avoidance】Societies and people differ in their tolerance for uncertainty and risk. Low uncertainty avoidance cultures (e.g., U.S. and Hong Kong) value diversity and tolerate a wide range of opinions and beliefs.High uncertainty avoidance societies (e.g., Japan and France) are more rigid and expect high conformity in their citizens’ beliefs and norms of behavior.【Long Term Outlook】Cultures (e.g., Taiwan and Hong Kong) with a long-term in outlook are based on the values of saving, and persistence.Short-term outlook societies (e.g., France and the United States) seek the maintenance of personal stability or happiness in the present.【National Culture and Global Management】Management practices that areeffective in one culture often will not work as well in another culture.(2)Declining barriers of distance and culture(3)Declining barriers to trade and investment(4)Effects of free trade on managersChapter 5.Decision Making, Learning, Creativity, and Innovation1. The Nature of Managerial Decision Making【Decision Making】The process by which managers respond to opportunities and threats byanalyzing options and making determinations about specific organizational goals and courses of action.(1) Programmed and Non-programmed Decision Making【Programmed Decision Making】Routine, nearly automatic decision making that follows established rules or guidelines.【Non-programmed Decision Making】Non-routine decision making that occurs in response to unusual, unpredictable opportunities and threats.Faced with non-programmed decision making, managers must search for information about alternative courses of action and rely on intuition and judgment to choose wisely among alternatives. →Intuition直觉Ability to make sound decisions based on one’s past experience and immediate feelings about the information at hand. →Judgment(better than intuition)Ability to develop a sound opinion based on one’s evaluation of the importance of the information at hand.(2) Classical Decision Making Model【Classical Decision Making Model】A prescriptive approach to decision making based on the assumption that the decision maker can identify and evaluate all possible alternatives and their consequences and rationally choose the most appropriate course of action. 【Optimum Decision】The most appropriate decision in light of what managers believe to be the most desirable future consequences for their organization.【Administrative Model】An approach to decision making that explains why decision making is inherently uncertain and risky and why managers usually make satisfactory rather than optimum decisions. The administrative model is based on three important concepts: bounded rationality, incomplete information, and satisficing. 【Bounded Rationality】Cognitive认知的limitations that constrain束缚one’s ability to interpret, process, and act on information. 【Incomplete Information】Information is incomplete because of risk and uncertainty, ambiguity, and time constraints. → Risk : The degree of probability that the possible outcomes of a particular course of action will occur. (有明确的数据表示)→Uncertainty : Unpredictability. (Future is unknown and probabilities cannot be determined) →Ambiguous Information : Information that can be interpreted in multiple and often conflicting ways. →Time Constraints and Information Costs. (记得少女老妇人的画不)【Satisficing】Searching for and choosing an acceptable, or satisfactory, response to problems and opportunities, rather than trying to make the best decision.2. Steps in the Decision-making Process(1)Recognize the Need for a Decision(2)Generate Alternatives(3)Assess alternativesLegality →Ethicalness →Economic Feasibility(与钱有关的) →Practicality(have the ability and resources, not threaten other organizational goals)(4)Choose Among Alternatives(5)Implement the Chosen Alternative(6)Learn from Feedback3. Group Decision Making→【Groupthink】A pattern of faulty and biased decision making that occurs in groups whose members strive for agreement among themselves at the expense of accurately assessing information relevant to a decision. Solutions to groupthink: (i)【Devil’s Advocacy唱反调】Critical analysis of a preferred alternative, made in response to challenges raised by a group member who, playing the role of devil’s advocate, defen ds unpopular or opposing alternatives for the sake of argument. (ii)【Diversity Among Decision Makers】(决策者构成的多样性)4. Organizational Learning and Creativity【Organizational Learning】The process through which managers seek to improve employees’ desire and ability to understand and manage the organization and its task environment. 【Learning Organization】An organization in which managers try to maximize the ability of individuals and groups to think and behave creatively and thus maximize the potential for organizational learning to take place. The heart of the organizational learning is creativity. 【Creativity】A decision maker’s ability to discover original and novel (adj.新奇的) ideas that lead to feasible alternative courses of action. 【Innovation】(创新) The implementation of creative ideas in an organization.Creating a Learning Organization (Senge)(1)Develop personal mastery.(2)Build complex, challenging mental models.(3)Promote team learning.(4)Build shared vision.(5)Encourage systems thinking.Promoting Individual CreativityPromoting Group Creativity【Brainstorming】Brainstorming is a group problem-solving technique in which managers meet face-to-face to generate and debate a wide variety of alternatives from which to make a decision. →Production Blocking: A loss of production in brainstorming sessions due to the unstructured nature of brainstorming.【Nominal Group Technique】民意群体法Nominal Group Technique is a decision-making technique in which group members write down ideas and solutions, read their suggestions to the whole group, and discuss and then rank the alternatives. Nominal Group Technique is especiallyuseful when an issue is controversial有争议的and when different managers might be expected to champion different courses of action. The main improvement of nominal group technique: It provides a more structured way of generating alternatives in writing and gives each manager more time and opportunities to generate alternative solutions.Promoting Creativity at the Global LevelChapter 6.Planning, Strategy, and Change 【Strategy】A cluster of decisions about what goals to pursue, what actions to take, and how to use resources to achieve goals. 【Mission】A broad declaration of an organization’s purpose that identifies the organization’s products and customers and distinguishes the organization from its competitors. Overview: Planning process includes three major steps:(1) Determining an organization’s mission and major goals;(2) Choosing strategies to realize the mission and goals;(3) Selecting the appropriate way of organizing resources to implement the strategies.1. Planning【Planning】Identifying and selecting appropriate goals and courses of action; one of the four principle functions of management. Planning is a three-step activity:(1) Determining the organization’s mission and goals;(2) Formulating strategy;(3) Implementing strategy and changing the organization.In large organizations planning usually takes place at three levels of management: corporate, business or division, and department or functional. 【Division】A business unit that has its own set of managers and functions or departments and competes in a distinct industry. 【Divisional Managers】Managers who control the various divisions of an organization. 【Corporate-level plan】Top management’s decisions pertaining to the organization’s missi on, overall strategy, and structure. 【Corporate-level strategy】A plan that indicates in which industries and national markets an organization intends to compete. 【Business-level plan】Divisional managers’ decisions pertaining to division’s long-term goals, overall strategy, and structure.【Business-level strategy】A plan that indicates how a division intends to compete against its rivals in an industry. 【Functional-level plan】Functional managers’ decisions pertaining to the goals that they propose to pursue to help the division attain its business-level goals. 【Functional-level strategy】A plan that indicates how a function intends to achieve its goals. 【Function】A unit of department in which people have the same skills or use the same resources to perform their jobs. 【Functional Manager】Managers who supervise the various functions, such as manufacturing, accounting, and sales, within a division. Functional goals and strategies should be consistent with divisional goals and strategies, which in turn should be consistent withdivisional goals and strategies, which in turn should be consistent with corporate goals and strategies. Although ultimate responsibility for planning may lie with certain select managers within an organization, all managers and many non-managerial employees typically participate in the planning process.Time Horizons of Plans【Time Horizon周期】The intended duration of a plan. 【Long-term Plan】five years or more. 【Immediate-term Plan】between one and five years. 【Short-term Plan】one year or less. 【Rolling Plan】A plan that is updated and amended every year to take account of changing conditions in the external environment.Standing Plans and Single-use Plans【Standing Plans】Used in situations in which programmed decision making is appropriate.(1) Policy: A general guide to action;(2) Rule: A formal, written guide to action;(3) Standing Operating Procedure (SOP): A written instruction describing the exact series of actions that should be followed in a specific situation.【Single-use Plans】Developed to handle non-programmed decision making in unusual orone-of-a-kind situations.Planning’s Importance(1) Planning is a useful way of getting managers to participate in decision making about the appropriate goals and strategies for an organization.(2) Planning is necessary to give the organization a sense of direction and purpose.(3) A plan helps coordinate managers of the different functions and divisions of an organizationto ensure that they all pull in the same direction.(4) A plan can be used as a device for controlling managers within an organization.Effective plans should have four qualities ( By Henri Fayol ):(1) Unity (一致性): At any one time only one central, guiding plan is put into operation to achieve an organizational goal.(2) Continuity (持续性): Planning is an ongoing process in which managers build and refine (精炼) previous plans and continually modify plans at all levels.(3) Accuracy (准确性): Managers need to make every attempt to collect and utilize all available information at their disposal in the planning process.(4) Flexibility (灵活性)2. Determining Mission and GoalsDefining the Business(1) Who are our customers?(2) What customer needs are being satisfied?(3) How are we satisfying customer needs?Establishing Major GoalsGoals must be challenging but realistic with a definite period in which they are to be achieved. 3. Formulating Strategy: SWOT Analysis【Strategy Formulation】Analysis of an organization’s current situation followed by the development of strategies to accomplish its mission and achieve its goals.【SWOT Analysis】A planning exercise in which managers identify organizational strengths (S), weaknesses (W), environmental opportunities(O), and threats.4. Formulating Strategy: Corporate-levelConcentration on a Single Business (全力做好一项业务)Can become a strong competitor, but can be risky.Diversification (多角化)【Diversification】Expanding operations into a new business or industry and producing new goods or services. 【Related Diversification】Entering a new business or industry to create a competitive advantage in one or more of an organization’s existing divisions or business.Synergy协同效应Performance gains that result when individuals and departments coordinate their actions. 【Unrelated Diversification】Entering a new industry or buying a company in a new industry that is not related in any way to an organization’s current businesses or industries. The reasons to pursue unrelated diversification: (1) Managers can buy a poorly performing company, transfer their management skills to it, turn around its business, and increase its performance. (2) Portfolio Strategy 投资组合战略There is evidence that too much diversification can cause managers to lose control of their organization’s core business.International Expansion (国际化扩张)【Global Strategy】Selling the same standardized product and using the same basic marketing approach in each national market. 【Multidomestic Strategy】(本土化战略) Customizing products and marketing strategies to specific national conditions.Vertical Integration (纵向一体化)A strategy that allows an organization to create value by producing its own inputs or distributing its own products. 【Backward Vertical Integration投入方面(原材料等)】a firm seeks to reduce its input costs by producing its own inputs. 【Forward Vertical Integration】产出方面(分销,销售等 a firm distributes its outputs or products to lower distribution costs and ensure the quality service to customers.5. Formulating Strategy: Business-levelLow-cost Strategy (低成本)Driving the organization’s total costs down below the total costs of rivals.Differentiation Strategy (差异化)Distinguishing an organization’s products from the products of compet itors in dimensions such as product design, quality, or after-sales service.Focused Low-cost Strategy (专一低成本)Serving only one market segment and being the lowest-cost organization serving that segment.Focused Differentiation Strategy (专一差异化)Serving only one market segment as the most differentiated organization serving that segment.6. Formulating Strategy: Functional-level7. Implementing Strategy and Changing the OrganizationStrategy Implementing is a five-step process:(1) Allocate implementation responsibility to the appropriate individuals or groups.(2) Draft detailed action plans for implementation.(3) Establish a timetable for implementation.(4) Allocate appropriate resources.(5) Hold specific groups or individuals responsible for the attainment of corporate, divisional, and functional goals.Chapter anizing: Designing Organizational Structure【Organizational Architecture】The organizational structure, control systems, and culture that together determine how efficiently and efficiently and effectively organizational resources are used.1. Designing Organizational Structure【Organizational Structure】A formal system of task and reporting relationships that coordinates and motivates organizational members so that they work together to achieve organizational goals. 【Organizational Design】The process by which managers make specific organizing choices that result in a particular kind of organizational structure. According to contingency theory, managers design organizational structures to fit the factors or circumstances that are affecting the company the most and causing them the most uncertainty. Thus, there is no one best way to design an organization. In some situations stable, mechanistic structures may be most appropriate while in others flexible, organic structures might be the most effective. In some situations flexible, organic structures might be the most effective. Four factors are important determinants of the type of organizational structure of organizing method managers select: (1) The nature of the organizational environment(2) The type of strategy the organization pursues(3) The technology the organization uses(4) The characteristics of the organization’s human resourcesThe Organizational EnvironmentThe more quickly the external environment is changing and the greater the uncertainty within it, a more organic structure is suitable for the situation. If the external environment is stable, resources are readily available, and uncertainty is low, a more formal structure is suitable for the situation.StrategyA differentiation strategy needs a flexible structure, low cost may need a more formal structure. Increased vertical integration or diversification also requires a more flexible structure.TechnologyMore complex technology makes it harder for managers to regulate the organization. 【Technology】The combination of skills, knowledge, tools, equipment, computers and machines used in the organization. 【Small-batch Technology小批量技术】Technology that is used to produce small quantities of customized, one-of-a-kind products and is based on the skills of people who work together in small groups. 【Mass-production Technology大批量生产技术】Technology that is based on the use of automated machines that are programmed to perform the same operations over and over. A structure that decentralizes authority to employees and allows them to respond flexibly is most appropriate with small-batch technology. A formal structure is the preferred choice because it gives managers the most control over the production process.Human ResourcesHighly skilled workers whose jobs require working in teams usually need a more flexible structure. Higher skilled workers (e.g., CPA’s and doctors) often have internalized professional norms.【Job Design】The process by which managers decide how to divide tasks into specific jobs. 【Division of Labor】Splitting the work to be performed into particular tasks and assigning tasks to individual workers. 【Job Simplification】The process of reducing the number of tasks that each worker performs. →Too much simplification may reduce efficiency. Workers may find their jobs boring and monotonous单调的.Job Enlargement and Job Enrichment【Job Enlargement】Increasing the number of tasks for a given job by changing the division of labor. →The intention is to reduce boredom and fatigue疲乏by increasing variety of tasks performed. 【Job Enrichment】Increasing the degree of responsibility a worker has over a job. →The intention is to increase worker involvement. And it requires a flexible organizational structure to allow employees to act flexibly and creatively. →There are four ways to enrich thejob:(1) Empowering workers to experiment to find better ways of doing the certain job.(2) Encouraging workers to develop new skills.(3) Allowing workers to decide how to respond to unexpected situations.(4) Allowing workers to monitor and measure their own performance.The Job Characteristics Model (工作特征模型)By Hackman & Oldham Every job has five characteristics that determine how motivating the job is.(1) Skill Varity: (技能多样性)The extent to which a job requires an employee to use a wide range of different skills, abilities, or knowledge.(2) Task Identity: (任务完整性)The extent to which a job requires a worker to perform all the tasks required to complete the job from the beginning to the end of the production process.(3) Task Significance: (任务重要性)The degree to which a worker feels his or her job is meaningful because of its effect on people inside the organization.(4) Autonomy: (自主性)The degree to which a job gives an employee the freedom and discretion决定权needed to schedule different tasks and decide how to carry them out.(5) Feedback: (反馈)The extent to which actually doing a job provides a worker with clear and direct information about how well he or she has performed the job.The more employees feel that their work is meaningful and that they are responsible for work outcomes and responsible for knowing how those outcomes affect others, the more motivating work becomes and the more likely employees are to be satisfied and to perform at a high level.3. Grouping Jobs into Functions and DivisionsFunctional Structure (职能型结构)【Function】A function is a group of people, working together, who possess similar skills or use the same kind of knowledge, tools, or techniques to perform their jobs. 【Functional Structure】An organizational structure composed of all the departments that an organization requires to produce its goods or services. →Advantages Encourages learning from others doing similar jobs. Easy for managers to monitor and evaluate workers. →Disadvantages Difficult for departments to communicate with others. Preoccupation with own department and losing sight of organizational goals.Divisional Structures (分部型结构)【Divisional Structure】An organizational structure composed of separate business units within which are the functions that work together to produce a specific product for a specific customer. Divisions develop a business-level strategy to compete. And Functional managers report to。

新物体识别障碍英语The rapid advancements in artificial intelligence and machine learning have revolutionized various industries, including computer vision. One of the key challenges in computer vision is the ability to accurately recognize and classify objects in images or videos. While significant progress has been made in this field, the emergence of new and diverse objects presents ongoing challenges that researchers and developers must address.One of the primary challenges in new object recognition is the ever-expanding variety of objects that need to be identified. As technology progresses and new products are constantly introduced, the pool of potential objects that a computer vision system must be able to recognize continues to grow. This requires continuous model updates, retraining, and the incorporation of new data to ensure the system's accuracy and relevance.Another challenge is the inherent complexity of many new objects. As technology becomes more sophisticated, the objects themselves can become increasingly intricate in their design, materials, andfunctionality. This complexity can make it more difficult for computer vision systems to accurately distinguish between different objects, particularly when they share similar visual characteristics.Furthermore, the environments in which these new objects are encountered can also pose challenges. Computer vision systems must be able to operate in a wide range of lighting conditions, backgrounds, and perspectives, which can significantly impact the ability to recognize objects accurately. Adapting to these variable environmental factors is crucial for ensuring reliable object recognition in real-world scenarios.One particular area of concern is the recognition of objects that are not part of the training data used to develop the computer vision models. This is known as the "open-world" problem, where the system must be able to identify and classify objects that it has not been explicitly trained on. This requires the development of more flexible and adaptable models that can generalize beyond the specific instances used in the training process.Another challenge in new object recognition is the need for efficient and scalable algorithms. As the number of objects to be recognized continues to grow, the computational resources required to process and analyze the data can become increasingly demanding. Developing efficient algorithms that can handle large-scale objectrecognition tasks while maintaining high accuracy is crucial for real-time applications and deployment in resource-constrained environments.Additionally, the incorporation of domain-specific knowledge and contextual information can greatly enhance the performance of new object recognition systems. By leveraging external data sources, such as product databases, user manuals, or expert knowledge, computer vision models can gain a deeper understanding of the objects they are tasked with recognizing. This can help to overcome the limitations of purely visual-based approaches and improve overall recognition accuracy.One promising approach to address these challenges is the use of transfer learning and meta-learning techniques. Transfer learning involves leveraging knowledge gained from training on one set of objects to improve the performance on a different but related set of objects. This can help to accelerate the training process and improve the generalization capabilities of the models.Meta-learning, on the other hand, focuses on developing models that can quickly adapt to new tasks or environments with minimal additional training. By incorporating meta-learning principles, computer vision systems can become more flexible and able to adapt to the recognition of new objects without the need forextensive retraining.Furthermore, the integration of multimodal sensing, such as combining visual, auditory, and tactile information, can provide a more comprehensive understanding of the objects being recognized. This can be particularly useful in scenarios where visual cues alone may not be sufficient for accurate identification.Another important aspect to consider is the ethical and societal implications of new object recognition systems. As these technologies become more widespread, it is crucial to ensure that they are developed and deployed in a responsible and transparent manner, addressing concerns related to privacy, bias, and the potential misuse of the technology.In conclusion, the recognition of new and diverse objects presents significant challenges for computer vision systems. From the ever-expanding variety of objects to the inherent complexity and variable environmental factors, researchers and developers must continually innovate and adapt their approaches to overcome these obstacles. By leveraging advanced techniques like transfer learning, meta-learning, and multimodal sensing, as well as addressing ethical considerations, the field of new object recognition can continue to progress and deliver increasingly accurate and reliable solutions for a wide range of applications.。
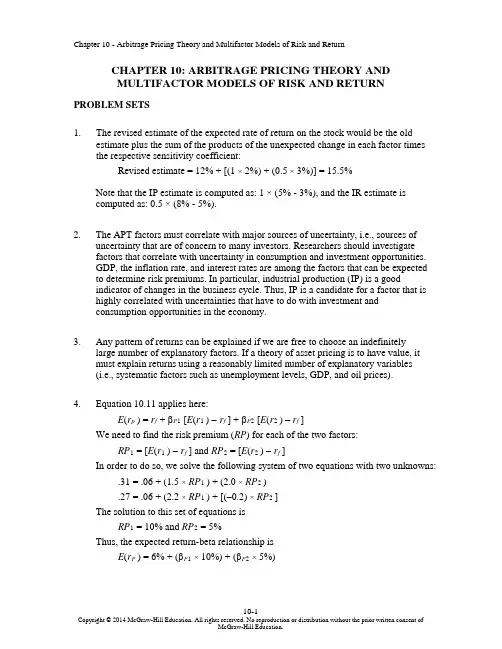
CHAPTER 10: ARBITRAGE PRICING THEORY ANDMULTIFACTOR MODELS OF RISK AND RETURN PROBLEM SETS1. The revised estimate of the expected rate of return on the stock would be the oldestimate plus the sum of the products of the unexpected change in each factor times the respective sensitivity coefficient:Revised estimate = 12% + [(1 × 2%) + (0.5 × 3%)] = 15.5%Note that the IP estimate is computed as: 1 × (5% - 3%), and the IR estimate iscomputed as: 0.5 × (8% - 5%).2. The APT factors must correlate with major sources of uncertainty, i.e., sources ofuncertainty that are of concern to many investors. Researchers should investigatefactors that correlate with uncertainty in consumption and investment opportunities.GDP, the inflation rate, and interest rates are among the factors that can be expected to determine risk premiums. In particular, industrial production (IP) is a goodindicator of changes in the business cycle. Thus, IP is a candidate for a factor that is highly correlated with uncertainties that have to do with investment andconsumption opportunities in the economy.3. Any pattern of returns can be explained if we are free to choose an indefinitelylarge number of explanatory factors. If a theory of asset pricing is to have value, itmust explain returns using a reasonably limited number of explanatory variables(i.e., systematic factors such as unemployment levels, GDP, and oil prices).4. Equation 10.11 applies here:E(r p) = r f + βP1 [E(r1 ) −r f ] + βP2 [E(r2 ) – r f]We need to find the risk premium (RP) for each of the two factors:RP1 = [E(r1 ) −r f] and RP2 = [E(r2 ) −r f]In order to do so, we solve the following system of two equations with two unknowns: .31 = .06 + (1.5 ×RP1 ) + (2.0 ×RP2 ).27 = .06 + (2.2 ×RP1 ) + [(–0.2) ×RP2 ]The solution to this set of equations isRP1 = 10% and RP2 = 5%Thus, the expected return-beta relationship isE(r P) = 6% + (βP1× 10%) + (βP2× 5%)5. The expected return for portfolio F equals the risk-free rate since its beta equals 0.For portfolio A, the ratio of risk premium to beta is (12 − 6)/1.2 = 5For portfolio E, the ratio is lower at (8 – 6)/0.6 = 3.33This implies that an arbitrage opportunity exists. For instance, you can create aportfolio G with beta equal to 0.6 (the same as E’s) by combining portfolio A and portfolio F in equal weights. The expected return and beta for portfolio G are then: E(r G) = (0.5 × 12%) + (0.5 × 6%) = 9%βG = (0.5 × 1.2) + (0.5 × 0%) = 0.6Comparing portfolio G to portfolio E, G has the same beta and higher return.Therefore, an arbitrage opportunity exists by buying portfolio G and selling anequal amount of portfolio E. The profit for this arbitrage will ber G – r E =[9% + (0.6 ×F)] − [8% + (0.6 ×F)] = 1%That is, 1% of the funds (long or short) in each portfolio.6. Substituting the portfolio returns and betas in the expected return-beta relationship,we obtain two equations with two unknowns, the risk-free rate (r f) and the factor risk premium (RP):12% = r f + (1.2 ×RP)9% = r f + (0.8 ×RP)Solving these equations, we obtainr f = 3% and RP = 7.5%7. a. Shorting an equally weighted portfolio of the ten negative-alpha stocks andinvesting the proceeds in an equally-weighted portfolio of the 10 positive-alpha stocks eliminates the market exposure and creates a zero-investmentportfolio. Denoting the systematic market factor as R M, the expected dollarreturn is (noting that the expectation of nonsystematic risk, e, is zero):$1,000,000 × [0.02 + (1.0 ×R M)] − $1,000,000 × [(–0.02) + (1.0 ×R M)]= $1,000,000 × 0.04 = $40,000The sensitivity of the payoff of this portfolio to the market factor is zerobecause the exposures of the positive alpha and negative alpha stocks cancelout. (Notice that the terms involving R M sum to zero.) Thus, the systematiccomponent of total risk is also zero. The variance of the analyst’s profit is notzero, however, since this portfolio is not well diversified.For n = 20 stocks (i.e., long 10 stocks and short 10 stocks) the investor willhave a $100,000 position (either long or short) in each stock. Net marketexposure is zero, but firm-specific risk has not been fully diversified. Thevariance of dollar returns from the positions in the 20 stocks is20 × [(100,000 × 0.30)2] = 18,000,000,000The standard deviation of dollar returns is $134,164.b. If n = 50 stocks (25 stocks long and 25 stocks short), the investor will have a$40,000 position in each stock, and the variance of dollar returns is50 × [(40,000 × 0.30)2] = 7,200,000,000The standard deviation of dollar returns is $84,853.Similarly, if n = 100 stocks (50 stocks long and 50 stocks short), the investorwill have a $20,000 position in each stock, and the variance of dollar returns is100 × [(20,000 × 0.30)2] = 3,600,000,000The standard deviation of dollar returns is $60,000.Notice that, when the number of stocks increases by a factor of 5 (i.e., from 20 to 100), standard deviation decreases by a factor of 5= 2.23607 (from$134,164 to $60,000).8. a. )(σσβσ2222e M +=88125)208.0(σ2222=+×=A50010)200.1(σ2222=+×=B97620)202.1(σ2222=+×=Cb. If there are an infinite number of assets with identical characteristics, then awell-diversified portfolio of each type will have only systematic risk since thenonsystematic risk will approach zero with large n. Each variance is simply β2 × market variance:222Well-diversified σ256Well-diversified σ400Well-diversified σ576A B C;;;The mean will equal that of the individual (identical) stocks.c. There is no arbitrage opportunity because the well-diversified portfolios allplot on the security market line (SML). Because they are fairly priced, there isno arbitrage.9. a. A long position in a portfolio (P) composed of portfolios A and B will offer anexpected return-beta trade-off lying on a straight line between points A and B.Therefore, we can choose weights such that βP = βC but with expected returnhigher than that of portfolio C. Hence, combining P with a short position in Cwill create an arbitrage portfolio with zero investment, zero beta, and positiverate of return.b. The argument in part (a) leads to the proposition that the coefficient of β2must be zero in order to preclude arbitrage opportunities.10. a. E(r) = 6% + (1.2 × 6%) + (0.5 × 8%) + (0.3 × 3%) = 18.1%b.Surprises in the macroeconomic factors will result in surprises in the return ofthe stock:Unexpected return from macro factors =[1.2 × (4% – 5%)] + [0.5 × (6% – 3%)] + [0.3 × (0% – 2%)] = –0.3%E(r) =18.1% − 0.3% = 17.8%11. The APT required (i.e., equilibrium) rate of return on the stock based on r f and thefactor betas isRequired E(r) = 6% + (1 × 6%) + (0.5 × 2%) + (0.75 × 4%) = 16% According to the equation for the return on the stock, the actually expected return on the stock is 15% (because the expected surprises on all factors are zero bydefinition). Because the actually expected return based on risk is less than theequilibrium return, we conclude that the stock is overpriced.12. The first two factors seem promising with respect to the likely impact on the firm’scost of capital. Both are macro factors that would elicit hedging demands acrossbroad sectors of investors. The third factor, while important to Pork Products, is a poor choice for a multifactor SML because the price of hogs is of minor importance to most investors and is therefore highly unlikely to be a priced risk factor. Betterchoices would focus on variables that investors in aggregate might find moreimportant to their welfare. Examples include: inflation uncertainty, short-terminterest-rate risk, energy price risk, or exchange rate risk. The important point here is that, in specifying a multifactor SML, we not confuse risk factors that are important toa particular investor with factors that are important to investors in general; only the latter are likely to command a risk premium in the capital markets.13. The formula is ()0.04 1.250.08 1.50.02.1717%E r =+×+×==14. If 4%f r = and based on the sensitivities to real GDP (0.75) and inflation (1.25),McCracken would calculate the expected return for the Orb Large Cap Fund to be:()0.040.750.08 1.250.02.040.0858.5% above the risk free rate E r =+×+×=+=Therefore, Kwon’s fundamental analysis estimate is congruent with McCracken’sAPT estimate. If we assume that both Kwon and McCracken’s estimates on the return of Orb’s Large Cap Fund are accurate, then no arbitrage profit is possible.15. In order to eliminate inflation, the following three equations must be solvedsimultaneously, where the GDP sensitivity will equal 1 in the first equation,inflation sensitivity will equal 0 in the second equation and the sum of the weights must equal 1 in the third equation.1.1.250.75 1.012.1.5 1.25 2.003.1wx wy wz wz wy wz wx wy wz ++=++=++=Here, x represents Orb’s High Growth Fund, y represents Large Cap Fund and z represents Utility Fund. Using algebraic manipulation will yield wx = wy = 1.6 and wz = -2.2.16. Since retirees living off a steady income would be hurt by inflation, this portfoliowould not be appropriate for them. Retirees would want a portfolio with a return positively correlated with inflation to preserve value, and less correlated with the variable growth of GDP. Thus, Stiles is wrong. McCracken is correct in that supply side macroeconomic policies are generally designed to increase output at aminimum of inflationary pressure. Increased output would mean higher GDP, which in turn would increase returns of a fund positively correlated with GDP.17. The maximum residual variance is tied to the number of securities (n ) in theportfolio because, as we increase the number of securities, we are more likely to encounter securities with larger residual variances. The starting point is todetermine the practical limit on the portfolio residual standard deviation, σ(e P ), that still qualifies as a well-diversified portfolio. A reasonable approach is to compareσ2(e P) to the market variance, or equivalently, to compare σ(e P) to the market standard deviation. Suppose we do not allow σ(e P) to exceed pσM, where p is a small decimal fraction, for example, 0.05; then, the smaller the value we choose for p, the more stringent our criterion for defining how diversified a well-diversified portfolio must be.Now construct a portfolio of n securities with weights w1, w2,…,w n, so that Σw i =1. The portfolio residual variance is σ2(e P) = Σw12σ2(e i)To meet our practical definition of sufficiently diversified, we require this residual variance to be less than (pσM)2. A sure and simple way to proceed is to assume the worst, that is, assume that the residual variance of each security is the highest possible value allowed under the assumptions of the problem: σ2(e i) = nσ2MIn that case σ2(e P) = Σw i2 nσM2Now apply the constraint: Σw i2 nσM2 ≤ (pσM)2This requires that: nΣw i2 ≤ p2Or, equivalently, that: Σw i2 ≤ p2/nA relatively easy way to generate a set of well-diversified portfolios is to use portfolio weights that follow a geometric progression, since the computations then become relatively straightforward. Choose w1 and a common factor q for the geometric progression such that q < 1. Therefore, the weight on each stock is a fraction q of the weight on the previous stock in the series. Then the sum of n terms is:Σw i= w1(1– q n)/(1– q) = 1or: w1 = (1– q)/(1– q n)The sum of the n squared weights is similarly obtained from w12 and a common geometric progression factor of q2. ThereforeΣw i2 = w12(1– q2n)/(1– q 2)Substituting for w1 from above, we obtainΣw i2 = [(1– q)2/(1– q n)2] × [(1– q2n)/(1– q 2)]For sufficient diversification, we choose q so that Σw i2 ≤ p2/nFor example, continue to assume that p = 0.05 and n = 1,000. If we chooseq = 0.9973, then we will satisfy the required condition. At this value for q w1 = 0.0029 and w n = 0.0029 × 0.99731,000In this case, w1 is about 15 times w n. Despite this significant departure from equal weighting, this portfolio is nevertheless well diversified. Any value of q between0.9973 and 1.0 results in a well-diversified portfolio. As q gets closer to 1, theportfolio approaches equal weighting.18. a. Assume a single-factor economy, with a factor risk premium E M and a (large)set of well-diversified portfolios with beta βP. Suppose we create a portfolio Zby allocating the portion w to portfolio P and (1 – w) to the market portfolioM. The rate of return on portfolio Z is:R Z = (w × R P) + [(1 – w) × R M]Portfolio Z is riskless if we choose w so that βZ = 0. This requires that:βZ = (w × βP) + [(1 – w) × 1] = 0 ⇒w = 1/(1 – βP) and (1 – w) = –βP/(1 – βP)Substitute this value for w in the expression for R Z:R Z = {[1/(1 – βP)] × R P} – {[βP/(1 – βP)] × R M}Since βZ = 0, then, in order to avoid arbitrage, R Z must be zero.This implies that: R P = βP × R MTaking expectations we have:E P = βP × E MThis is the SML for well-diversified portfolios.b. The same argument can be used to show that, in a three-factor model withfactor risk premiums E M, E1 and E2, in order to avoid arbitrage, we must have:E P = (βPM × E M) + (βP1 × E1) + (βP2 × E2)This is the SML for a three-factor economy.19. a. The Fama-French (FF) three-factor model holds that one of the factors drivingreturns is firm size. An index with returns highly correlated with firm size (i.e.,firm capitalization) that captures this factor is SMB (small minus big), thereturn for a portfolio of small stocks in excess of the return for a portfolio oflarge stocks. The returns for a small firm will be positively correlated withSMB. Moreover, the smaller the firm, the greater its residual from the othertwo factors, the market portfolio and the HML portfolio, which is the returnfor a portfolio of high book-to-market stocks in excess of the return for aportfolio of low book-to-market stocks. Hence, the ratio of the variance of thisresidual to the variance of the return on SMB will be larger and, together withthe higher correlation, results in a high beta on the SMB factor.b.This question appears to point to a flaw in the FF model. The model predictsthat firm size affects average returns so that, if two firms merge into a largerfirm, then the FF model predicts lower average returns for the merged firm.However, there seems to be no reason for the merged firm to underperformthe returns of the component companies, assuming that the component firmswere unrelated and that they will now be operated independently. We mighttherefore expect that the performance of the merged firm would be the sameas the performance of a portfolio of the originally independent firms, but theFF model predicts that the increased firm size will result in lower averagereturns. Therefore, the question revolves around the behavior of returns for aportfolio of small firms, compared to the return for larger firms that resultfrom merging those small firms into larger ones. Had past mergers of smallfirms into larger firms resulted, on average, in no change in the resultantlarger firms’ stock return characteristics (compared to the portfolio of stocksof the merged firms), the size factor in the FF model would have failed.Perhaps the reason the size factor seems to help explain stock returns is that,when small firms become large, the characteristics of their fortunes (andhence their stock returns) change in a significant way. Put differently, stocksof large firms that result from a merger of smaller firms appear empirically tobehave differently from portfolios of the smaller component firms.Specifically, the FF model predicts that the large firm will have a smaller riskpremium. Notice that this development is not necessarily a bad thing for thestockholders of the smaller firms that merge. The lower risk premium may bedue, in part, to the increase in value of the larger firm relative to the mergedfirms.CFA PROBLEMS1. a. This statement is incorrect. The CAPM requires a mean-variance efficientmarket portfolio, but APT does not.b.This statement is incorrect. The CAPM assumes normally distributed securityreturns, but APT does not.c. This statement is correct.2. b. Since portfolio X has β = 1.0, then X is the market portfolio and E(R M) =16%.Using E(R M ) = 16% and r f = 8%, the expected return for portfolio Y is notconsistent.3. d.4. c.5. d.6. c. Investors will take on as large a position as possible only if the mispricingopportunity is an arbitrage. Otherwise, considerations of risk anddiversification will limit the position they attempt to take in the mispricedsecurity.7. d.8. d.。
Learning Based Super-Resolution Imaging:Use ofZoom as a CueB.Tech.Project ReportSubmitted in partial fulfillmentof the requirements forB.Tech.DegreeinElectrical EngineeringbyRajkiran Panuganti(99007034)under the guidance ofProf.Subhasis ChaudhuriDepartment of Electrical EngineeringIndian Institute of Technology,BombayApril20032Acceptance CertificateDepartment of Electrical EngineeringIndian Institute of Technology,BombayThe Bachelor of Technology project titled Learning Based Super-Resolution Imaging:Use of Zoom as a Cue and the corresponding report was done by Rajkiran Panuganti(99007034) under my guidance and may be accepted.Date:April16,2003(Prof.Subhasis Chaudhuri)AcknowledgmentI would like to express my sincere gratitude towards Prof.Subhasis Chaudhuri for his invaluable guidance and constant encouragement and Mr.Manjunath Joshi for his help during the course of the project.16th April,2003Rajkiran PanugantiAbstractWe propose a novel technique for super-resolution imaging of a scene from observations at different camera zooms.Given a sequence of images with different zoom factors of a static scene,the problem is to obtain a picture of the entire scene at a resolution corresponding to the most zoomed image in the scene.We not only obtain the super-resolved image for known integer zoom factors,but also for unknown arbitrary zoom factors.In order to achieve that we model the high resolution image as a Markov randomfield(MRF)the parameters of which are learnt from the most zoomed observation.The parameters are estimated using the maximum pseudo-likelihood(MPL)criterion.Assuming that the entire scene can be described by a homogeneous MRF,the learnt model parameters are then used to obtain a maximum aposteriori(MAP)estimate of the high resolutionfield.Since there is no relative motion between the scene and the camera,as is the case with most of the super-resolution techniques, we do away with the correspondence problem.Experimental results on synthetic as well as on real data sets are presented.ContentsAcceptance Certificate iAcknowledgment ii Abstract iii Table of Contents iv 1Introduction1 Introduction1 2Related Work4 Related Work4 3Low Resolution Image Model9 Low Resolution Image Model9 4Super-Resolution Restoration12Super-Resolution Resotoration124.1Image Field Modeling (12)4.2Parameter Learning (14)4.3MAP Restoration (15)4.4Zoom Estimation (16)5Experimental Results19Experimental Results195.1Experimentations with Known,Integer Zoom Factors (19)5.2Experiments with unknown zoom factors (25)5.3Experimental Results when parameters are estimated (28)6Conclusion33 Conclusion33 References34Chapter1IntroductionIn most electronic imaging applications,images with high spatial resolution are desired and often required.A high spatial resolution means that the pixel density in an image is high,and hence there are more details and subtle gray level transitions,which may be critical in various applications.Be it remote sensing,medical imaging,robot vision,industrial inspection or video enhancement(to name a few),operating on high-resolution images leads to a better analysis in the form of lesser misclassification,better fault detection,more true-positives,etc. However,acquisition of high-resolution images is severely constrained by the drawbacks of the limited density sensors.The images acquired through such sensors suffer from aliasing and blurring.The most direct solution to increase the spatial resolution is to reduce the pixel size (i.e.,to increase the number of pixels per unit area)by the sensor manufacturing techniques. But due to the decrease in pixel size,the light available also decreases causing more shot noise [1,2]which degrades the image quality.Thus,there exists limitations on the pixel size and the optimal size is estimated to be about40µm2.The current image sensor technology has almost reached this level.Another approach to increase the resolution is to increase the wafer size which leads to an increase in the capacitance[3].This approach is not effective since an increase in the capacitance causes a decrease in charge transfer rate.Hence,a promising approach is to use image processing methods to construct a high-resolution image from one or more available low-resolution observations.Resolution enhancement from a single observation using image interpolation techniquesis of limited application because of the aliasing present in the low-resolution image.Super-resolution refers to the process of producing a high spatial resolution image from several low-resolution observations.It includes upsampling the image thereby increasing the maximum spatial frequency and removing degradations that arise during image capture,viz.,aliasing and blurring.The amount of aliasing differs with zooming.This is because,when one captures the images with different zoom settings,the least zoomed entire area of the scene is represented by a very limited number of pixels,i.e.,it is sampled with a very low sampling rate and the most zoomed scene with a higher sampling frequency.Therefore,the larger the scene(the lesser zoomed area captured),the lower will be the resolution with more aliasing effect.By varying the zoom level,one observes the scene at different levels of aliasing and blurring. Thus one can use zoom as a cue for generating high-resolution images at the lesser zoomed area of a scene.As discussed in the next chapter,researchers traditionally use the motion cue to super-resolve the image.However this method being a2-D dense feature matching technique,re-quires an accurate registration or preprocessing.This is disadvantageous as the problem of finding the same set of feature points in successive images to establish the correspondence between them is a very difficult task.Errors in registration are reflected on the quality of the super-resolved image.Further,the methods based on the motion cue cannot handle observa-tions at varying levels of spatial resolution.It assumes that all the frames are captured at the same spatial resolution.Previous research work with zoom as a cue to solve computer vision problems include determination of depth[4,5,6],minimization of view degeneracies[7],and zoom tracking[8].We show in this paper that even the super-resolution problem can be solved using zoom as an effective cue by using a simple MAP-MRF formulation.The basic problem can be defined as follows:One continuously zooms in to a scene while capturing its images. The most zoomed-in observation has the highest spatial resolution.We are interested in gen-erating an image of the entire scene(as observed by the most wide angle or the least zoomed view)at the same resolution as the most zoomed-in observation.The details of the method are presented in this thesis.We also discuss various issues and limitations of the proposed technique.The remainder of this thesis is organized as follows.In chapter2we review some of the prior work in super-resolution imaging.We discuss how one can model the formation of low-resolution images using the zoom as a cue in chapter3.The zoom estimation,parameter learning and the MAP-MRF approach to derive a cost function for the super-resolution esti-mation is the subject matter for chapter4.We present typical experimental results in chapter5 and chapter6provides a brief summary,along with the future research issues to be explored.Chapter2Related WorkMany researchers have tackled the super-resolution problem for both still and video images, e.g.,[9,10,11,12](see[13,14]for details).The super-resolution idea wasfirst proposed by Tsai and Huang[12].They used the frequency domain approach to demonstrate the ability to reconstruct a single improved resolution image from several down-sampled noise free versions of it.A frequency domain observation model was defined for this problem which considered only globally shifted versions of the same scene.Kim et al.discuss a recursive algorithm, also in the frequency domain,for the restoration of super-resolution images from noisy and blurred observations[15].They considered the same blur and noise characteristics for all the low-resolution observations.Kim and Su[16]considered different blurs for each low-resolution image and used Tikhonov regularization.A minimum mean squared error approach for multiple image restoration,followed by interpolation of the restored images into a single high-resolution image is presented in[17].Ur and Gross use the Papoulis and Brown[18],[19] generalized sampling theorem to obtain an improved resolution picture from an ensemble of spatially shifted observations[20].These shifts are assumed to be known by the authors. All the above super-resolution restoration methods are restricted either to a global uniform translational displacement between the measured images,or a linear space invariant(LSI) blur,and a homogeneous additive noise.A different approach to the super-resolution restoration problem was suggested by Peleg et al.[10,21,22],based on the iterative back projection(IBP)method adapted from computeraided tomography.This method starts with an initial guess of the output image,projects the temporary result to the measurements(simulating them),and updates the temporary guess according to this simulation error.A set theoretic approach to the super-resolution restoration problem was suggested in[23].The main result there is the ability to define convex sets which represent tight constraints on the image to be restored.Having defined such constraints it is straightforward to apply the projections onto convex sets(POCS)method.These methods are not restricted to a specific motion charactarictics.They use arbitrary smooth motion,linear space variant blur,and non-homogeneous additive noise.Authors in[24]describe a complete model of video acquisition with an arbitrary input sampling lattice and a nonzero exposure time.They use the theory of POCS to reconstruct super-resolution still images or video frames from a low-resolution time sequence of images.They restrict both the sensor blur and the focus blur to be constant during the exposure.Ng et al.develop a regularized constrained total least square(RCTLS)solution to obtain a high-resolution image in[25].They consider the presence of ubiquitous perturbation errors of displacements around the ideal sub-pixel locations in addition to noisy observations.In[26]the authors use a maximum a posteriori(MAP)framework for jointly estimating the registration parameters and the high-resolution image for severely aliased observations. They use iterative,cyclic coordinate-descent optimization to update the registration parame-ters.A MAP estimator with Huber-MRF prior is described by Schultz and Stevenson in[27]. Other approaches include an MAP-MRF based super-resolution technique proposed by Rajan et al[28].Here authors consider an availability of decimated,blurred and noisy versions of a high-resolution image which are used to generate a super-resolved image.A known blur acts as a cue in generating the super-resolution image.They model the super-resolved image as an MRF.In[29]the authors relax the assumption of the known blur and extend it to deal with an arbitrary space-varying defocus blur.They recover both the scene intensity and the depthfields simultaneously.For super-resolution applications they also propose a general-ized interpolation method[30].Here a space containing the original function is decomposed into appropriate subspaces.These subspaces are chosen so that the rescaling operation pre-serves properties of the original function.On combining these rescaled sub-functions,theyget back the original space containing the scaled or zoomed function.Nguyen et al[31] proposed a technique for parametric blur identification and regularization based on the gener-alized cross-validation(GCV)theory.They solve a multivariate nonlinear minimization prob-lem for these unknown parameters.They have also proposed circulant block preconditioners to accelerate the conjugate gradient descent method while solving the Tikhonov-regularized super-resolution problem[32].Elad and Feuer[33]proposed a unified methodology for super-resolution restoration from several geometrically warped,blurred,noisy and down-sampled measured images by combining maximum likelihood(ML),MAP and POCS approaches.An adaptivefiltering approach to super-resolution restoration is described by the same authors in[34].They exploit the properties of the operations involved in their previous work[33] and develop a fast super-resolution algorithm in[35]for pure translational motion and space invariant blur.In[36]authors use a series of short-exposure images taken concurrently with a corresponding set of images of a guidestar and obtain a maximum-likelihood estimate of the undistorted image.The potential of the algorithm is tested for super-resolved astronomic imaging.Chiang and Boult[37]use edge models and a local blur estimate to develop an edge-based super-resolution algorithm.They also applied warping to reconstruct a high-resolution image[38]which is based on a concept called integrating resampler[39]that warps the image subject to some constraints.Altunbasak et al.[40]proposed a motion-compensated,transform domain super-resolution procedure for creating high quality video or still images that directly incorporates the trans-form domain quantization information by working in the compressed bit stream.They apply this new formulation to MPEG-compressed video.In[41]a method for simultaneously es-timating the high-resolution frames and the corresponding motionfield from a compressed low-resolution video sequence is presented.The algorithm incorporates knowledge of the spatio-temporal correlation between low and high-resolution images to estimate the original high-resolution sequence from the degraded low-resolution observation.In[42]authors pro-pose to enhance the resolution using a wavelet domain approach.They assume that the wavelet coefficients scale up proportionately across the resolution pyramid and use this property to go down the pyramid.Shechtman et al.[43]construct a video sequence of high space-time res-olution by combining information from multiple low-resolution video sequences of the same dynamic scene.They used video cameras with complementary properties like low-frame rate but high spatial resolution and high frame rate but low spatial resolution.They show that by increasing the temporal resolution using the information from multiple video sequences spatial artifacts such as motion blur can be handled without the need to separate static and dynamic scene components or to estimate their motion.Authors in[44]propose a high-speed super-resolution algorithm using the generalization of Papoulis’sampling theorem for multi-channel data with applications to super-resolving video sequences.They estimate the point spread function(PSF)for each frame and use the same for super-resolution.Capel and Zisserman[45]have proposed a technique for automated mosaicing with super-resolution zoom in which a region of the mosaic can be viewed at a resolution higher than any of the original frames by fusing information from several views of a planar surface in order to estimate its texture.They have also proposed a super-resolution technique from multiple views using learnt image models[46].Their method uses learnt image models either to di-rectly constrain the ML estimate or as a prior for a MAP estimate.Authors in[47]describe image interpolation algorithms which use a database of training images to create plausible high frequency details in zoomed images.In[48]authors develop a super-resolution algorithm by modifying the prior term in the cost to include the results of a set of recognition decisions,and call it as recognition based super-resolution or hallucination.Their prior enforces the condi-tion that the gradient of the super-resolved image should be equal to the gradient of the best matching training image.We now discuss in brief the previous work on MRF parameter estimation.In[49]au-thors use Metroplis-Hastings algorithm and gradient method to estimate the MRF parameters. Laxshmanan and Derin[50]have developed a iterative algorithm for MAP segmentation using the ML estimates of the MRF parameters.Nadabar and Jain[51]estimate the MRF line pro-cess parameters using geometric CAD models of the objects in the scene.A multiresolution approach to color image restoration and parameter estimation using homotopy continuation method was described by[52]As discussed in[47],the richness of the real world images would be difficult to captureanalytically.This motivates us to use a learning based approach,where the MRF parameters of the super-resolved image can be learnt from the most zoomed observation and hence can be used to estimate the super-resolution image for the least zoomed entire scene.In[53],Joshi et al proposed an approach for super-resolution based on MRF modeling of the intensityfield in which MRF parameters were chosen on an adhoc basis.However,a more practical situation is one in which these parameters are to be estimated.In this thesis, we simultaneously estimate the these uknown parameters and obtain the super-resolution in-tensity map.The Maximum Likelihood(ML)estimate of the parameters are obtained by an approximate version MPL estimation in order to reduce the computations.Our approach gen-erates a super-resolved image of the entire scene although only a part of the observed zoomed image has multiple observations.In effect what we do is as follows.If the wide angle view corresponds to afield of view ofαo,and the most zoomed view corresponds to afield of view ofβo(whereαβ),we generate a picture of theαofield of view at a spatial resolution com-parable toβofield of view by learning the model from the most zoomed view.The details of the method are now presented.Chapter3Low Resolution Image ModelThe zooming based super-resolution problem is cast in a restoration framework.There are p observed images Y i p i1each captured with different zoom settings and of size M1M2 pixels each.Figure3.1illustrates the block schematic of how the low-resolution observations of a same scene at different zoom settings are related to the high-resolution image.Here we consider that the most zoomed observed image of the scene Y p(p3in thefigure)has the highest resolution.A zoom lens camera system has complex optical properties and thus it is difficult to model it.As Lavest et al.[5]point out,the pinhole model is inadequate for a zoom lens,and a thick-lens model has to be used;however,the pinhole model can be used if the object is virtually shifted along the optical axis by the distance equal to the distance between the primary and secondary principal planes of the zoom lens.Since we capture the images with a large distance between the object and the camera and if the depth variation in the scene is not very significant compared to its distance from the lens,it is reasonable to assume that the paraxial shift about the optical axis as the zoom varies is negligible.Thus,we can make a reasonable assumption of a pinhole model and neglect the depth related perspective distortion due to the thick-lens behavior.We are also assuming that there is no rotation about the optical axis between the observed images taken at different zooms.However we do allow lateral shift of the optical center as explained in section4.4.Since different zoom settings give rise to different resolutions,the least zoomed scene corresponding to entire scene needs to be upsam-pled to the size of q1q2q p1M1M2N1N2pixels,where q1q2q p1are1Y Y2Y3Figure3.1:Illustration of observations at different zoom levels,Y1corresponds to the least zoomed and Y3to the most zoomed images.Here z is the high-resolution image of the same scene.the zoom factors between observed images of the scene Y1Y2Y2Y3Y p1Y p,respectively. Given Y p,the remaining p1observed images are then modeled as decimated and noisy versions of this single high-resolution image of the appropriate region in the scene.With this the most zoomed observed image will have no decimation.If ym D m z m m1p(3.1)y 1(k,l)y (k,l)y 32(k,l)Figure 3.2:Low resolution image formation model is illustrated for three different zoom lev-els.View fixation block just crops a small part of the high-resolution image z .where D is the decimation matrix,size of which depends on the zoom factor.For an integer zoom factor of q ,decimation matrix D consists of 1q 21110111...0111(3.2)Here p is the number of observations,n m 12exp1T m ngiven yChapter4Super-Resolution RestorationIn order to obtain a regularized estimate of the high resolution image zprovides the necessary prior.4.1Image Field ModelingThe MRF provides a convenient and consistent way of modeling context dependent entities such as pixel intensities,depth of the object and other spatially correlated features.This is achieved through characterizing mutual influence among such entities using conditional probabilities for a given neighborhood.The practical use of MRF models is largely ascribed to the equivalence between the MRF and the Gibbs distributions(GRF).We assume that the high resolution image can be represented by an MRF.Let Z be a randomfield over an arbitrary N N lattice of sites L i j1i j N.For the GRF,we have P Z z Ze U zpis a realization of Z,Z p is the partition function given by∑zθ,θis the parameter that defines the MRF model and U zθ∑c C V c z θdenotes the potential function associated with a clique c and C is the set of all cliques. The clique c consists of either a single pixel or a group of pixels belonging to a particular neighborhood system.In this paper we consider only the symmetricfirst order neighborhoods consisting of the four nearest neighbors of each pixel and the second order neighborhoods consisting of the eight nearest neighbors of each pixel.In particular,we use the following twoβ12β2(a)(b)Figure4.1:Cliques used in modeling the image.(a)First order,and(b)Second order neigh-borhood.and four types of cliques shown in Figure4.1.In thefigure,βi is the parameter specified for clique c i.The Gibbs energy prior for zθZ pexp U zθN2∑k1N2∑l1β1z k l z k l12z k l z k l12β2z k l z k1l2z k l z k1l2for two parametersβ1β2,orU z4.2Parameter LearningWe realize that in order to enforce the MRF priors while estimating the high resolution image zθ(4.2) The probability in equation(4.2)can be expressed asP Z zθP Z k l z k l Z m n z m nθ(4.4)θ∆∏k lwhere m nηk l form the given neighborhood model(thefirst order or the second order neighborhood as chosen in this study).Further it can be shown that equation(4.4)can bewritten asˆP Z z∑zk l G exp∑C:k l C V c z k lθ(4.5)where G is the set of intensity levels used.Considering the fact that thefield zpθ(4.6) We maximize the log likelihood of the above probability by using Metropolis-Hastings algorithm as discussed in[49]and obtain the parameters.4.3MAP RestorationHaving learnt the model parameters,we now try to super-resolve the entire scene.We use the MAP estimator to restore the high resolutionfield zis given byˆz arg maxz y2yP y2y P zm’s are independent,one can show that the high resolutionfield zp ∑m1y2θ(4.9)Since the model parameterθhas already been estimated,a solution to the above equation is,indeed,possible.The above cost function is convex and is minimized using the gradient descent technique.The initial estimate zincreasing zoom factors.Finally the most zoomed observed image with the highest resolution is copied with no interpolation.In order to preserve discontinuities we modify the cost for prior probability term as dis-cussed in section4.1.The cost function to be minimized then becomesˆz argminzmD m z2σ2ηV z∑i jµe zsγe zp(4.11)On inclusion of binary linefields in the cost function,the gradient descent technique cannot be used since it involves a differentiation of the cost function.Hence,we minimize the cost by using simulated annealing which leads to a global minima.However,in order to provide a good initial guess and to speed up the computation,the result obtained using the gradient descent method is used as the initial estimate for simulated annealing.The computational time is greatly reduced upon using mean-field annealing,which leads to a near optimal solution.4.4Zoom EstimationWe now extend the proposed algorithm to a more realistic situation in which the successive observations vary by an unknown rational valued zoom factor.Further,considering a real lens system for the imaging process,the numerical image center can no longer be assumed to be fixed.The zoom factor between the successive observations needs to be estimated during the process of forming an initial guess(as discussed in the chapter3)for the proposed super-resolution algorithm.We,however,assume that there is no rotation about the optical axis between the successive observations though we allow a small amount of lateral shift in the optical axis.The image centers move as lens parameters such as focus or zoom are varied[55, 56].Naturally,the accuracy of the image center estimation is an important factor in obtaining the initial guess for our super resolution algorithm.Generally,the rotation of a lens system will cause a rotational drift in the position of the optical axis,while sliding action of a lens group in the process of zooming will cause a translation motion of the image center[55].Theserotational and translational shifts in the position of the optical axis cause a corresponding shifting of the camera’sfield of view.In variable focal length zoom lenses,the focal length is changed by moving groups of lens elements relative to one another.Typically this is done by using a translational type of mechanism on one or more internal groups.These arguments validate our assumption that there is no rotation of the optical axis in the zooming process and at the same time stress the necessity of accounting for the lateral shift in the image centers of the input observations obtained at different zoom settings.We estimate the relative zoom and shift parameters between two observations by minimiz-ing the mean squared distance between an appropriate portion of the digitally zoomed image of the wide angle view and the narrower view observation.The method searches for the zoom factor and the lateral shift that minimizes the distance.We do this by heirarchially searching for the global minima byfirst zooming the wide angle observation and then searching for the shift that corresponds to a local minima of the cost function.The lower and upper bounds for the zooming process needs to be appropriately defined.Naturally,the efficiency of the algo-rithm is constrained by the closeness of the bounds to the solution.It can be greatly enhanced byfirst searching for a rough estimate of the zoom factor and slowly approaching the exact zoom factor by redefining the lower and upper bounds as the factors that correspond to the least cost and the next higher cost.We do this byfirst searching for a discrete zoom factor (say1.4to2.3in steps of0.1)At this point,we need to note that the digital zooming of an image by a rational zoom factor q mFigure4.2:Illustration of zoom and alignment estimation.’A’is the wide angle view and’B’is the narrower angle view.shift in the optical axis in the zooming process is usually small(2to3pixels).The above discussed zoom estimation and the alignment procedure is illustrated in the Figure4.2.。
Understanding Deep LearningIntroductionDeep learning is a subset of machine learning that focuses on artificial neural networks and their ability to learn and make decisions similar to the human brain. This technology has gained significant popularity in recent years due to its exceptional performance in various applications such as computer vision, natural language processing, and speech recognition. The book “Understanding Deep Learning” provides a comprehensive guide to the principles and algorithms behind thisexciting field.Chapter 1: The Basics of Deep LearningThe first chapter of the book introduces the fundamental concepts of deep learning. It begins by explaining the structure and functioning of artificial neural networks. The authors discuss the various layers and neurons that make up a neural network and explain how they process input data to generate output predictions. Additionally, the chapter explores the importance of activation functions in neural networks and their role in non-linear transformations.Chapter 2: Training Neural NetworksIn this chapter, the book covers the training process of neural networks. It explains the concept of backpropagation, a widely used algorithm for adjusting the weights and biases of neural networks during training. The authors delve into the mathematics behind backpropagation, covering topics such as gradient descent and optimization techniques. Moreover, the chapter provides insights into avoiding overfitting and underfitting by using regularization methods like L1 and L2 regularization.Chapter 3: Convolutional Neural NetworksConvolutional Neural Networks (CNNs) are at the core of many computer vision tasks. Chapter 3 focuses on CNNs, exploring their architecture and functionality. The authors explain how CNNs employ convolutional layers, pooling layers, and fully connected layers to process and classify images. The chapter also explores popular CNN architectureslike AlexNet, VGGNet, and ResNet, discussing their design principles and performance.Chapter 4: Recurrent Neural NetworksRecurrent Neural Networks (RNNs) excel in processing sequential data, making them ideal for tasks like natural language processing and speech recognition. This chapter delves into the mechanics of RNNs, showcasing how they maintain hidden states and utilize them to process sequential data efficiently. The authors explain the vanishing and exploding gradient problems in RNNs and introduce solutions like the Long Short-Term Memory (LSTM) and Gated Recurrent Unit (GRU) architectures.Chapter 5: Generative Adversarial NetworksGenerative Adversarial Networks (GANs) have revolutionized the field of generative modeling. Chapter 5 examines the inner workings of GANs, highlighting the interplay between the generator and discriminator networks. The authors discuss the training process of GANs and how they learn to generate realistic data, such as images or text. The chapter also explores variants of GANs, including Conditional GANs and CycleGANs.Chapter 6: Applications of Deep LearningThe final chapter of the book showcases various real-world applications of deep learning. It explores how deep learning has revolutionizedfields like healthcare, finance, and autonomous vehicles. The authors discuss the challenges and limitations of applying deep learning in these domains, while also highlighting the potential for future advancements. Additionally, the chapter provides insights into transfer learning and the benefits of pre-trained models.Conclusion“Understanding Deep Learning” provides an in-depth and comprehensive exploration of the principles, algorithms, and applications of deep learning. Through its detailed explanations and examples, the book equips readers with the knowledge needed to understand and apply deep learning techniques in various domains. Whether you are a beginner or an experienced practitioner, this book serves as an indispensable resource for mastering the intricacies of deep learning.。

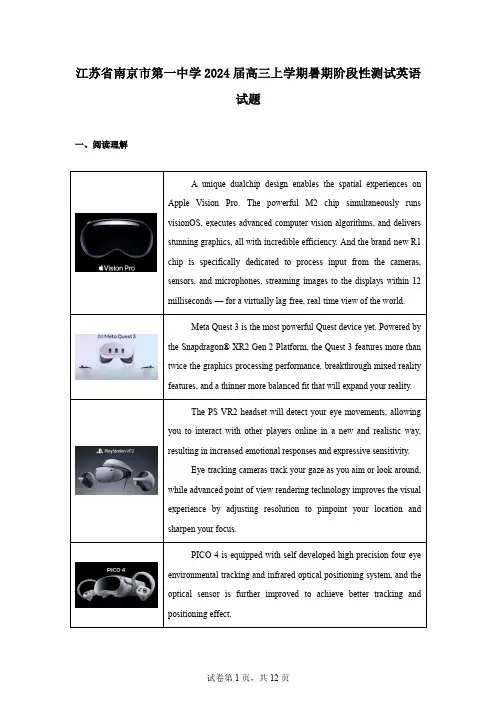
江苏省南京市第一中学2024届高三上学期暑期阶段性测试英语试题一、阅读理解1.Which unique technological feature of the Apple Vision Pro enables an unprecedented mixed reality experience for users?A.Eye-tracking system.B.Dual-chip design.C.Optical sensors.D.High-definition display.2.Which of the following statements accurately compares the capabilities of the four products mentioned?A.Apple Vision Pro is the only one with a dualchip design.B.Meta Quest 3 offers the highest graphics processing performance.C.PS VR2 detects eye movements for online interaction.D.PICO 4 lacks a high-precision tracking system.3.If Simon wanted to buy a product to play a game, which of the following products would be his first choice?A.Apple Vision Pro.B.Meta Quest 3.C.PS VR2.D.PICO 4.“Digital art with iPad and Apple Pencil has helped to expand my creative thinking.”Apichaya "Bim" Wannakit is starting her fourth year in painting, sculpture, and graphic art at Silpakorn University in Bangkok, in the heart of the modern Thai art scene. Growing up in Northeast Thailands creative community in Ubon Ratchatani, Bim developed her passion for art at a young age.She took inspiration from anime like "Dragon Ball Z" cartoons she saw on television and the "Manga" comic books she collected. She put years of hands-on practice into her illustrations using brushes, watercolors, and oil paints. In high school, she discovered even more ways to express herself and expand her creative palette when she started using iPad with Apple Pencil.“I quickly adapted to the precision and flexibility of digital painting using Apple Pencil,” Bim says. “It brought my entire art kit into one magical tool, without sacrificing the natural feel of traditional mediums. It allows me a new way to bring my ideas to life.”When it was time to get ready for university, Bim used iPad to bring her art portfolio together, capturing and storing all her mixed media digitally in iCloud. Bim says, “I initially chose Apple technology because of its cloud service for file management and simple-to-learn design interface — iPad has made my life easier.”Today she uses Procreate on iPad with Apple Pencil for all her creative workflows. Features such as QuickShape and StreamLine with Apple Pencil enable her to quickly add layers, outlines, colors, and shadows in an immersive and playful way. “My love for traditional painting and digital art brings me a new sense of balance. My Apple devices help to make this possible from anywhere.”iPad also supports her daily academic work. Bim uses Apple Pencil with GoodNotes for note-taking, and Microsoft Word on iPad for creating art descriptions. “In class, I use iPad Pro to present my work,” Bim says. “And the 12.9-inch screen is large enough for my professor to view my art comfortably.”“Through my art, I want to tell a story that inspires others and creates a space for experimental ideas.”4.What does Bim Wannakit value most about using Apple devices for her art?A.The cost-effectiveness of the devices.B.The ability to create a balance between traditional and digital art.C.The simplicity of the design interface.D.The ease of file management through cloud services.5.Why did Bim choose to use iPad and Apple Pencil for her artistic work?A.They replicated the feel of traditional art materials exactly.B.They provided a cheaper alternative to professional art tools.C.They allowed her to combine digital flexibility with a natural drawing feel.D.They were the only tools available to her at the time.6.According to the article, how has Bim's artistic practice been enhanced by digital tools?A.She can now create larger artworks than before.B.She has access to a wider range of colors and textures.C.She can share her work instantly with a global audience.D.She can experiment with new techniques and styles more easily.7.Bim mentioned that GoodNotes and Microsoft Word have been helpful in her academic work. What are the main uses of these tools?A.Creating detailed sketches for her art projects.B.Organizing her research and writing academic papers.C.Editing photos for her online art gallery.D.Designing promotional materials for art exhibitions.We explore large-scale training of generative models on video data. Specifically, we train text-conditional diffusion models jointly on videos and images of variable durations, resolutions and aspect ratios. We leverage a transformer architecture that operates on spacetime patches of video and image latent codes. Our largest model, Sora, is capable of generating a minute of high fidelity video. Our results suggest that scaling video generation models is a promising path towards building general purpose simulators of the physical world.We train a network that reduces the dimensionality of visual data. This network takes raw video as input and outputs a latest representation that is compressed both temporally and spatially. Sora is trained on and subsequently generates videos within this compressed latent space. We also train a corresponding decoder model that maps generated latents back to pixel space.All of the results above and in our landing page show text-to-video samples. But Sora can also be prompted with other inputs, such as pre-existing images or video. This capability enables Sora to perform a wide range of image and video editing tasks—creating perfectly looping video, animating static images, extending videos forwards or backwards in time, etc.Sora is also capable of generating images. We do this by arranging patches of Gaussian noise in a spatial grid with a temporal extent of one frame. The model can generate images of variable sizes—up to 2048*2048 resolution.We find that video models exhibit a number of interesting emergent capabilities when trained at scale. These capabilities enable Sora to simulate some aspects of people, animals and environments from the physical world. These properties emerge without any explicit inductivebiases for 3D, objects, etc.—they are purely phenomena of scale.We believe the capabilities Sora has today demonstrate that continued scaling of video models is a promising path towards the development of capable simulators of the physical and digital world, and the objects, animals and people that live within them.8.What is the meaning of the underlined words in the text?A.the original raw video data.B.a compressed version of the video data.C.the process of reducing video quality.D.the spatial and temporal dimensions of a video.9.What is the main content of Paragraph 3?A.Sora's ability to generate high-resolution images.B.The process of training Sora on compressed latent space.C.Sora's various applications in image and video editing.D.The emergence of interesting capabilities in video models.10.Which of the following best describes the overall goal of the research described in the passage?A.To create realistic images and videos using only text prompts.B.To develop a general-purpose simulator capable of simulating various aspects of thephysical world.C.To train a network that can compress video data without losing quality.D.To explore the potential of transformer architectures in video and image generation tasks. 11.What is the author's attitude towards the future development of Sora?A.Skeptical.B.Optimistic.C.Neutral.D.Uncertain.Electric vehicles (EVs) are a strong weapon in the world's efforts against global warming. But the effects of EVs depend on what country you are in. In some nations, electric vehicles lead to the release of more carbon gasses than gasoline cars, new research shows.The Radiant Energy Group (REG) compared gas emissions caused by a gasoline vehicle and from charging an electric vehicle. The study compared the emissions caused by charging a Tesla Model 3 to drive 100 kilometers with the emissions coming from an average gasoline cardriven the same distance.Countries where charging an electric vehicle is cleaner than driving a gasoline-powered car use a lot of hydroelectric, nuclear or solar power.Sales of electric cars are rising the fastest in Europe. Data from REG suggests that EVs in Poland and Kosovo actually create more carbon emissions because their electric systems depend so much on coal.In other European countries, however, EVs result in reduced emissions. The carbon gas reduction depends on what energy supplies electricity systems and the time of day vehicles are charged.The countries with the biggest carbon gas savings from EVs use a lot of nuclear and hydroelectric power. An EV driver in Germany reduces greenhouse gas emissions by 55 percent over a gasoline car. Germany uses a mix of renewable energy and coal to produce electricity.Germany and Spain create a lot of electricity from the sun and wind. But the sun and wind do not add to a country's electricity system equally throughout the day.For this reason, the amount of carbon emissions saved by driving an EV depends on the time of day it is being charged. Charging in the afternoon, when there is more sun and wind, saves 16 to 18 percent more carbon than at night when electricity systems are more likely to be using gas or coal.Automakers including General Motors, Stellantis and V olkswagen have set targets to sell mainly electric vehicles in Europe in the coming years. U.S. car manufacturer General Motors said it will have all new electric cars by 2022.12.Which of the following statements is NOT true according to the passage?A.The amount of carbon emissions saved by EVs depends on the source of electricity used for charging.B.Charging EVs during daylight hours with renewable energy sources can cause more carbon savings.C.The time of day when EVs are charged can significantly affect their carbon footprint.D.General Motors plans to sell only gasoline-powered cars by 2022 in the United States. 13.What can be inferred from the fact that car manufacturers like General Motors, Stellantis, and V olkswagen have set targets to sell mainly electric vehicles in Europe?A.The demand for EVs in Europe is expected to decrease in the near future.B.These manufacturers believe that EVs will become the norm in Europe in the coming years.C.Europe has banned the sale of gasoline-powered cars entirely.D.These manufacturers are not confident in the long-term viability of EVs.14.Based on the information in the passage, which of the following is a potential challenge for the widespread adoption of EVs?A.The limited range of EVs compared to gasoline-powered cars.B.The high initial cost of EVs compared to traditional vehicles.C.The inconsistency of renewable energy sources for EV charging.D.The lack of charging stations in rural areas.15.Which of the following would be the most suitable title for the passage?A.The Environmental Impact of Electric Vehicle Charging.B.The Global Shift to Electric Vehicle Adoption.C.The Economics of Electric Vehicle Ownership.D.The Future of Renewable Energy in Automobiles.In the rapidly advancing world of today, the concept of lifelong learning has become increasingly relevant. 16 Rather, it is essential to continuously adapt and learn throughout one's life. This essay aims to explore the significance of lifelong learning in the modern era, discussing its impact on personal growth, career development, and societal progress.17 As technology and knowledge continue to evolve, it is important to stay updated with new information and ideas. By engaging in lifelong learning, individuals can enhance their cognitive abilities, broaden their horizons, and develop a growth mindset. This, in turn, leads to a more fulfilling and enriching life experience.Lifelong learning is essential for career development. In the modern job market, employers increasingly value candidates who possess the ability to adapt to change and learn new skills quickly. Lifelong learners are more likely to stay relevant and competitive in their field, as they are constantly improving their knowledge and skills. 18Moreover, lifelong learning contributes significantly to societal progress. As individualscontinuously acquire new knowledge and skills, they are able to contribute more effectively to their communities and countries. 19 Lifelong learning also fosters a culture of inclusivity and diversity, as it encourages individuals from different backgrounds and experiences to learn and grow together.In conclusion, lifelong learning is an indispensable aspect of life in the modern era. 20 By committing to lifelong learning, individuals can stay updated with new knowledge and ideas, enhance their cognitive abilities, and contribute more effectively to their communities and countries. Therefore, it is important for us to cultivate a habit of lifelong learning and encourage it among our peers and future generations.A.Additionally, they demonstrate a commitment to personal and professional development. B.With the development of science and technology, humans will continue to be replaced by AI. C.Lifelong learning is crucial for personal growth.D.This can lead to innovations, economic growth, and cultural richness.E.It is essential for personal growth, career development, and societal progress. F.Therefore, only lifelong learning, in order to maintain the leading position.G.It is no longer sufficient to acquire knowledge and skills during one's formal education.二、完形填空Once upon a time, there was a small village hidden deep in the mountains. The villagers led a simple life, depending mostly on farming for their 21 . One day, a young man named Jack arrived in the village. He was 22 and eager to explore the surrounding mountains.Jack quickly 23 with the villagers and became a part of their community. He was fascinated by the 24 tales of the mountains and the mysterious creatures that were said to inhabit them. Determined to find out the truth, Jack decided to embark on a journey of 25 .Before leaving, the villagers warned him of the dangers that awaited him in the mountains. They told him about the 26 weather, the treacherous paths, and the wild animals that roamed the area. But Jack was not 27 . He packed his belongings, bid farewell to the villagers, and started his journey.As he climbed higher and higher, the weather became increasingly 28 . The pathswere slippery and difficult to navigate. But Jack persevered, determined to reach the top of the mountain.After days of 29 , Jack finally reached the summit. The view was breathtaking, with rolling hills and dense forests stretching out as far as the eye could see. But as he was taking in the 30 , he heard a strange sound coming from the bushes nearby.Curious, Jack approached the bushes and peeked inside. To his surprise, he saw a small, 31 creature with big eyes and furry ears. The creature seemed 32 at first, but then it slowly approached Jack, sniffing the air curiously.Jack realized that this was one of the mysterious creatures the villagers had talked about. He felt a sense of 33 and excitement wash over him. He gently reached out his hand and the creature cautiously sniffed it, 34 allowing Jack to pet it.From that day on, Jack and the creature became close friends. They explored the mountains together, 35 each other's company. The villagers were amazed when Jack returned with his newfound friend and shared his adventures with them.The experience taught Jack the value of courage, perseverance, and friendship. It also showed him that there was more to the world than what he had imagined, and that there was always something new and exciting to discover.21.A.income B.entertainment C.inspiration D.experience 22.A.adventurous B.cautious C.lazy D.timid 23.A.argued B.competed C.bonded D.disagreed 24.A.boring B.ordinary C.amazing D.strange 25.A.discovery B.escape C.adventure D.research 26.A.unpredictable B.pleasant C.calm D.mild 27.A.discouraged B.frightened C.delighted D.satisfied 28.A.severe B.comfortable C.warm D.changeable 29.A.hiking B.struggling C.resting D.searching 30.A.scene B.creature C.challenge D.danger 31.A.fierce B.ugly C.cute D.powerful 32.A.aggressive B.nervous C.confident D.happy 33.A.wonder B.relief C.pride D.pity34.A.eventually B.immediately C.suddenly D.frequently 35.A.seeking B.enjoying C.avoiding D.tolerating三、语法填空阅读下面短文,在空白处填入1个适当的单词或括号内单词的正确形式。
摘要数字图像在其形成、传输和记录的过程中,由于成像系统、传输介质和记录设备的不完善往往使得获取的图像受到多种噪声的污染。
因此在模式识别、计算机视觉、图像分析和视频编码等领域,噪声图像的前期处理极其重要,其处理效果的好坏将直接影响到后续工作的质量和结果。
本文主要介绍图像去噪的基本原理、典型方法和最新方法。
考虑到图像去噪技术的飞速发展,本文在论述其基本理论的同时还着重介绍近年来国内有关的最新研究成果和最新方法。
本文被分成四个部分。
第一部分是绪论,论述图像去噪发展趋势及研究图像去噪的理由与意义。
第二部分论述中值滤波法和自适应平滑滤波法的基本原理,完成基于matlab中值滤波的代码实现,并对其结果进行分析。
本文提出两种新的算法,即中值滤波的改进算法即自适应加权算法,和自适应平滑滤波的改进算法。
并且也得出这两种算法的仿真结果,并且对结果进行分析。
第三部分首先论述基于频域的图像去噪方法的基本原理,然后本文对巴特沃斯低通滤波和巴特沃斯高通滤波的基本原理作了论述,并且分别完成基于matlab的巴特沃斯低通滤波和高通滤波的代码实现,对结果进行分析。
同时对程序中的重要语句分别作注释。
第四部分是本文最重要的一章,重点阐述基于小波域的两种图像去噪方法和算法,即小波阈值去噪法与小波维纳滤波去噪法。
在小波阈值去噪法中,本文重点论述小波阈值去噪的三个步骤,并介绍传统经典的阈值化方法即软阈值法、硬阈值法以及四种确定阈值的方法。
其中包括统一阈值法、基于零均值正态分布的置信区间阈值、最小最大阈值法和理想阈值估计法,并且完成小波阈值去噪法的代码实现,将小波阈值去噪法的去噪结果和中值滤波法的去噪结果进行比较分析,得出结论。
在小波维纳滤波去噪法中本文着重论述小波维纳滤波去噪法的基本原理,得到小波维纳滤波去噪法的仿真结果,并且将波维纳滤波去噪法的结果与维纳滤波去噪法的结果进行对比分析。
关键词:图像去噪,维纳滤波,中值滤波,小波变换,阈值AbstractIn its formation, transmission and recording of the process of digital images, because imaging system , transmission media and recording equipment are often imperfect, the obtained images are polluted by a variety of noises. In pattern recognition, computer vision, image analysis and video coding and other fields,noise image pre-processing is extremely important and whether its effect is good or bad will have a direct impact on the following quality and results. This paper introduces the basic principle, the typical method and the latest methods of image denoising.Taking the rapid development of technology of image denoising into account, the paper discusses the basic theory and at the same time also the latest research results and the latest methods in recent years.This paper is divided into four parts.introduction The first part is the introduction and discusses development trend of image denoising and the reasons and significance of studying image denoising. The second part, deals with the basic principles of median filter and adaptive smoothing filter, achieves the completion of median filtering code based on Matlab, and analyzes the results. This paper presents two new algorithm, which is the improved algorithms of the filtering called adaptive weighted algorithm, and the improved algorithm of adaptive smoothing. And the paper has reached this algorithm simulation results, and analyzed the results. The third part firstly discusses the basic principles of image denoising based on frequency domain . Then this paper discusses the basic principles of Butterworth low-pass filter and Butterworth high-pass filtering, and completes the code achieved based on Matlab Butterworth low-pass filter and high-pass filtering and analyzes the results. Meanwhile important statements of the procedures are explained. The fourth part of this article is the most important chapter and focuses on the two methods and algorithms of image denoising based on wavelet domain, which are the wavelet domain thresholding method and wavelet wiener filter method. In wavelet thresholding method, the paper focuses on the three steps of wavelet thresholding and discusses the traditional classical threshold methods,which are soft, and the threshold hard threshold law, and introduces four ways of determining the threshold.The four ways include a single threshold value, intervalthreshold based on the zero mean normal confidence, the largest minimum threshold value and ideal threshold estimates.The paper completes achieving code of wavelet thresholding method and comparatively analyzes the results of wavelet thresholding method and the results of denoising filter method. In wavelet wiener filter ,the paper method focuses on the basic principle of wavelet wiener filter, achieves simulation results of wavelet wiener filter method, and compares the results of wavelet wiener filter method with the results of the wiener filter method.Keywords : image denoising, Wiener filter, filtering, wavelet transform, threshold第1章绪论1.1 图像去噪的发展趋势图像信号处理中最困难的问题之一是:怎样滤出图像中的噪声而又不模糊图像的特征及边缘。
Digital Video RecorderUser ManualProduction InformationThank you for purchasing our DVR! This manual is designed for the installation and operation of this product. You can get more information about the features and functions of this product in details. Please read this manual carefully before using. Please contact us if you have any questions.Legal DisclaimerREGARDING TO THE PRODUCT WITH INTERNET ACCESS, THE USE OF PRODUCT SHALL BE WHOLLY AT YOUR OWN RISKS. OUR COMPANY SHALL NOT TAKE ANY RESPONSIBILITES FOR ABNORMAL OPERATION, PRIVACY LEAKAGE OR OTHER DAMAGES RESULTING FROM CYBER ATTACK, HACKER ATTACK, VIRUS INSPECTION, OR OTHER INTERNET SECURITY RISKS; HOWEVER, OUR COMPANY WILL PROVIDE TIMELY TECHNICAL SUPPORT IF REQUIRED.SURVEILLANCE LAWS VARY BY JURISDICTION. PLEASE CHECK ALL RELEVANT LAWS IN YOUR JURISDICTION BEFORE USING THIS PRODUCT IN ORDER TO ENSURE THAT YOUR USE CONFORMS THE APPLICABLE LAW. OUR COMPANY SHALL NOT BE LIABLE IN THE EVENT THAT THIS PRODUCT IS USED WITH ILLEGITIMATE PURPOSES.IN THE EVENT OF ANY CONFLICTS BETWEEN THIS MANUAL AND THE APPLICABLE LAW, THE LATER PREVAILS.Regulatory InformationFCC InformationPlease take attention that changes or modification are not expressly approved by the party responsible for compliance could void the user’s authority to operate the equipment.FCC Compliance: This equipment has been tested and found to comply with the limits for a Class A digital device, pursuant to part 15 of the FCC Rules. These limits are designed to provide reasonable protection against harmful interference when the equipment is operated in a commercial environ-ment. This equipment generates, uses, and can radiate radio frequency energy and, if not installed and used in accordance with the instruction manual, may cause harmful interference to radio communica-tions. Operation of this equipment in a residential area is likely to cause harmful interference in which case the user will be required to correct the interference at his own expense.FCC ConditionsThis device complies with part 15 of the FCC Rules. Operation is subject to the following two conditions:1.This device may not cause harmful interference.2.This device must accept any interference received, including interference that may cause undesired operation.EU Conformity StatementThis product and -if applicable -the supplied accessories too are marked with "CE" and comply therefore with the applicable harmonized European standards listed under the EMC Directive 2014/30/EU, the LVD Directive 2014/35/EU, the RoHS Directive 2011/65/EU.2012/19/EU(WEEE directive): Products marked with this symbol cannot be disposed of asunsorted municipal waste in the European Union. For proper recycling, return this product to your local supplier upon the purchase of equivalent new equipment, or dispose of it at designated collection points. For more information see: 2006/66/EC (battery directive): This product contains a battery that cannot be disposed of as unsorted municipal waste in the European Union. See the product documentation for specific battery information.The battery is marked with this symbol, which may include lettering to indicate cadmium (Cd), lead (Pb), or mercury (Hg). For proper recycling, return theSafety InstructionThese instructions are intended to ensure that user can use the product correctly to avoid danger or property loss. The precaution measure is divided into [Warnings] and [Cautions].Warnings: Serious injury or death may occur if any of the warnings are neglected.Cautions: Injury or equipment damage may occur if any of the cautions are neglected.Warnings: Follow these safeguards toprevent serious injury or death.Cautions: Follow these precautions to prevent potential injury or material damage.Warnings● Proper configuration of all passwords and other security settings is the responsibility of the installer and/or end-user.● In the use of the product, you must be in strict compliance with the electrical safety regulations of the nation and region. Please refer to technical specifications for detailed information.● Input voltage should meet both the SELV (Safety Extra Low Voltage) and the Limited Power Source with 100 to 240 VAC or 12 VDC according to the IEC60950-1 standard. Please refer to technical specifications for detailed information.● Do not connect several devices to one power adapter as adapter overload may cause over-heating or a fire hazard.● Please make sure that the plug is firmly connected to the power socket.● If smoke, odor or noise rise from the device, turn off the power at once and unplug the power cable, and then please contact the service center.Preventive and Cautionary Tips● Before connecting and operating your device, please be advised of the following tips:● Ensure unit is installed in a well-ventilated, dust-free environment.● Unit is designed for indoor use only. Keep all liquids away from the device.● Ensure environmental conditions meet factory specifications.● Ensure unit is properly secured to a rack or shelf. Major shocks or jolts to the unit as a result of dropping it may cause damage to the sensitive electronics within the unit.● Use the device in conjunction with an UPS if possible.● Power down the unit before connecting and disconnecting accessories and peripherals.● A factory recommended HDD should be used for this device.● Improper use or replacement of the battery may result in hazard of explosion. Replace with the same or equivalent type only. Dispose of used batteries according to the instructions provided by the battery manufacture.ContentChapter 1 Description of Panels (1)1.1 Front Panel (1)1.2 Rear panel (1)Chapter 2 Installation and Connection (2)2.1 DVR Installation (2)2.2 Hard Disk Installation (3)Chapter 3 Menu Operation (4)3.1 Activate Device (4)3.2 Live view (8)3.3 Login the system (9)3.4 Recording setting (10)3.5 Playback recording video (10)3.6 Search&Backup video (11)3.7 Motion detection (13)3.8 Network setting (14)3.9 Email setting (16)Chapter 4 Remote Control (17)4.1 Access via a Web Browser (17)4.2 Access via Guarding Vision (18)4.3 Access via a Smartphone (20)Chapter 5 FAQ & Troubleshooting (23)1.1 Front PanelDetailed information for the front panel button:1.2 Rear panel4CH8CH16CHDuring the installation of the DVR:1. Use brackets for rack mounting.2. Ensure there is ample room for audio and video cables.3. When installing cables, ensure that the bend radius of the cables are no less than five times than its diameter.4. Allow at least 2cm (≈0.75-inch) of space between racks mounted devices.5. Ensure the DVR is grounded.6. Environmental temperature should be within the range of -10º C to 55º C, 14º F to131º F.7. Environmental humidity should be within the range of 10% to 90%.Chapter 2 Installation and Connection2.1 DVR InstallationDetailed information for the rear panel:Notes: This is for reference only, some components may not be included. This description applies toseveral models and the connection methods are similar in spite of the different appearance.DVR system should be installed a 3.5 or 2.5 inches SATA internal hard drive for recording (2.5 inches SATA needs a bracket to hold the HDD). The system shows the real-time viewing interface, but you can’t record or playback without installing the hard drive.2.2 Hard Disk InstallationNotes: Please turn off the power before you install the hard drive. You can skip this step if you has installed the hard drive into your DVR in advance.① Disassemble the screw④ Fix the screw of the hard disk⑦ Cover the machine⑧ Fix the cover⑤ Connect the data wire⑥ Connect the power wire② Disassemble the cover③ Place and fix the hard diskConnect the data wire and the power wire to thecorresponding port of the hard disk.1. Select Language: After the DVR is powered on, automatically enter the “Activate Device” step.Select Language and click “Apply”.3.1 Activate Device2. Set password: Input password and Email (Get the verification code by email after you forgot password), then click “Activate”.3. Set Unlock Pattern: Press the left button to draw a same pattern twice or click right button to skip this setting.4. Time setting: Select the right “Time Zone” and configure date/time, then click “Save and Next” or click “Exit” to skip next setting.5. Network setting: Click and check “DHCP” and “Obtain DNS Automatically”, the DVR will auto get IP address from your home router, then click “Save and Next” or click “Exit” to skip next setting.6. Sannce Home: Click and check “Enable”, set a Verification code and allow internet access. Scan the APP QR code to download mobile APP, scan the device the device QR code to add DVR by APP, then click “Save and Next” or “Next” to skip next setting.7. Add IP Camera: Click “+” to add IP camera (This DVR can connect IP cameras via ONVIF protocol, then click “Save and Next” or “Exit” to skip next setting.8. Storage : Click “Add” to add NAS or IP SAN (If haven’t this storage, skip this step); check and click the HDD and click “Init” to format it, then click “Finish”.Right click on the live view window. [ ]: Click “Live” to view camera video. [ ]: Click it to playback video recording. [ ]: Click it to search and backup video recording.[ ]: Click it to configure DVR.[ ]: Click it to check the DVR system information/log and DVR restore setting.[ ]: Click it to check the DVR alarm information.[ ]: Click it to logout/Shutdown/reboot DVR.[ ]: It mean the camera has alarm information.[ ]: The camera is recording video.[ ]: Instant playback the camera recording video.[ ]: Click to digital zoom the camera video.[ ]: Start and stop video recording.[ ]: Control camera PTZ function(Only for the PTZ camera).[ ]: Preview in single window/four windows.3.2 Live viewRight click on the live view window, press left button to draw the pattern to login DVR or click “Switch user”and input the password, then click “Login”.3.3 Login the system11-10-2019 Sun 10:51:55You can enter [Configuration]-[Record]-[Record]-[Schedule], set the record schedule.[Camera No.]: Select DVR channel.[Enable]: Check and enable it.[Advanced]: Click to enter the advanced setting, you can configure record audio/pre-record/post-re-cord/stream type/expired time(Day).[Continuous]: Set continuous recording.[Event]: Set alarm linkage recording.[None]: Not recording.[Edit]: Click to edit the recording time mode.[Week and time]: Press left button and draw to select the week and time.3.4 Recording setting3.5 Playback recording video1234567You can enter[Playback] to play back recording video.[1]: Select channel split mode[2]: Select the channel for video playback.[3]: Select the date of video playback.[4]: Display video recording of the channel.[5]: Select video playback mode: Normal/Smart/Sub-periods.[6]: Video playback time progress bar.[7]: Video playback toolbar: Clip/30s backward/30s forward/play/pause/speed down/speed up/full screen.3.6 Search&Backup videoYou can enter [Search]to backup video to USB storage.[Time]: Select search time.[Camera]: Select camera.[File type]: Select search file type.[Search by]: Select search criteria.[File Status]: Select file status, include “all/unlocked/locked”.[Quick Export]: Directly back video recording file.[Empty conditions]: Clear search criteria.[Search]: Click to search video recording file.[Save]: Click to save the search condition.Select the file and click “Export” to back up video file to USB storage.Note: Make sure already insert USB storage to DVR USB interface before searching file.You can enter [Configuration]-[Camera]-[Smart Event] to set motion detection function, after finished setting, click “copy to” to set other channel and click “Apply” to save settings.[Camera]: Select the DVR channel.[Enable]: check this setting to enable motion detection.[Area Settings]: Click to set the detect area, Hold down the left button and drag the selected area. The red area is the motion detection area, no color area is not detected area.[Sensitivity]: Set motion detection sensitivity level.[Full screen]: Check it, the alarm channel camera will display full screen after detected motion alarm.[Clear]:Clear all regions setting.3.7 Motion detectionClick “Arming Schedule” to configure the detect motion schedule.[Continuous]: Set continuous motion detection.[None]: Not enable motion detect.[Edit]: Click to edit motion detection start/end time.Click “Linkage Action” to configure the detect link action.[Normal linkage]: Include full screen monitoring/audible warning/notify surveillance center/send email.[Trigger alarm output]: Motion alarm link hardware alarm output , only for the DVR has hardware alarm output.[Trigger channel]: Select the motion alarm trigger camera.3.8 Network settingYou can enter [Configuration]-[Network]-[General] to set network function.[DHCP]: Check it to enable DHCP function, DVR will auto get the IP address from locale router. [Obtain DNS Automatically]: Check it to enable DNS function, DVR will auto get the DNS from locale router.You can enter [Configuration]-[Network]-[Sannce Home] to set network function.[Enable]: Check it to enable Sannce Home function, then the service terms will pop up, enter the verification code.[Stream Encryption]: Check enable stream encryption, verification code is required for remote access and live view.[Verification code]: Enter verification code, verification code is required when visit DVR by mobile app.[Status]: It will display “Online” when DVR connects internet successfully;if displays “Offline”, please try to check the DVR network connection.APP Download QR-Code: Scan the APP QR-Code to download “Sannce Home” or try to search “Sannce Home” in Apple APP store and Google Play store.3.9 Email settingYou can enter [Configuration]-[Network]-[Email]to set Email.[Server Authentication][User name][Password]: Check it to enable the function if the SMTP server requires user authentication and enter user name and password accordingly.[SMTP server]: Input the Email box SMTP server address.[SMTP port]: Input the SMTP server port, it will auto display port when you selected the right encryption protocol.[SSL/TLS]: Check to enable SSL/TLS if required by the SMTP server.[Attached picture]: Check to enable the function if you want to send email with attached alarm images.[Sender]: The name of the sender.[Sender’s address]: Input the sender Email box address.[Select Receivers]: Select the receiver. Up to 3 receivers can be configured.[Receiver]: The name of the receiver.[Receiver's Address]: The Email address of user to be notified.Chapter 4 Remote ControlBefore start:1. Make sure you have a router and high-speed network connection;2. Connect the DVR to your router by using an Ethernet cable;3. Upgrade your client software and mobile app to the latest version;4. Make sure your network speed come up to 1Mbps at least to get the best video recording.5. Go to DVR’s [Configuration] - [Network] - [Sannce Home] - [Status] to confirm “Online”. Go to DVR’s [Configuration] - [Network] - [General] to get your IP address, for example,192.168.2.7. Open your IE browser and input the IP address, login with your user account and password, as shown in the figure below.Notes: The default user name is [admin], and can not be changed. The password is the same to the password of DVR. You will go the interface as shown in the figure below after you login successfully. You will get the image if the camera connects to the channel successfully.4.1 Accessing by Web Browser4.2 Guarding VisionGuarding Vision Client software is in the supplied CD. Double-click the icon of Guarding Vision after installed .Select the DVR and click “Add to Client”Input a DVR name and password,then click “Add” to save the setting.Click “Main view” and double click the DVR group to view video.11-10-2019 Sun 10:51:55Camcra 01a. Install the Sannce Home App for free from the APP Store or Google Play store. Tap the icon Sannce Home to open the APP .b. Select “Select country or region”and click “√” to save the setting.c. Click “login”and “Register” to create an APP account, you can use your mobile phone number or Email address as the APP login account.4.3 Accessing by Mobile Phone4.3.1 iPhone / iPad / AndroidSannce Homed. After login the APP, click “+”, scan the DVR ID QR code (Configuration-Network-Sannce Home) to add DVR.e. Click DVR name to view camera video.f. Click “ “to playback recording video remotely, select channel and date, then click “Start playback”1. No setting interface displayed on the monitor after the device is starting up normally.Possible Reasons:Do not connect your DVR to the port of laptop’s VGA or HDMI directly.Make sure the resolution of monitor higher than the display resolution of DVR. Otherwise, the monitor will not show any image of cameras.Solutions:Method 1: Use the monitor with a higher resolution to connect your DVR so that you can log in DVR and change its display resolution to lower one.Method 2: You can access the camera through CMS software on your computer to change its display resolution to lower one.Method 3: You can access the DVR system on the computer’s browser by DVR's IP and change itsdisplay resolution on web page.2. All cameras has no image showing up on the DVR after the device is starting up normally.Possible Reasons:Make sure all cameras are connected to the port of Video-in with cables and your recorder should be connected to the monitor with the cable, but the video of all cameras are not shown on the monitor (You can still see the setting panel of recorder) .Solutions:Method 1: Check the connection of your system is correct or not.Method 2: Check the camera lens at night and make sure infrared light turns on. Try to connect a 12V power supply to the camera if there is no infrared light.3. You can not view on the mobile phone and computer.Possible Reasons:The Sannce Home status is offline.Solutions:Please check the DVR internet connection.4. No image displayed on some cameras Possible Reasons:Make sure all cameras are connected to DVR/NVR with cables and recorder is connected to the monitor with the cable, one or several cameras has no image displayed on the monitor, but others are working fine, you should make sure the camera, cable, or channel port is damaged or not.For example:1.Connect the camera C1 to the channel A1 with the cable B2 to confirm if it is the cable B1's problem2.Connect the camera C1 to the channel A2 with the cable B2 to confirm if it is the camera C1'sproblem.3. Connect the camera B2 to the channel A1 with the cable B2 to confirm if it is the channel port A1's problem.Solutions:Please make sure whether the camera, cable, or channel port is damaged or not so that we can give you the correct replacement.5. Video can not be recorded.Possible Reasons:The DVR needs an internal hard disk drive for recording. Without hard drive, the system can show live viewing, but can not be recorded or playback. The status of hard drive is abnormal.Solutions:Make sure the hard drive is installed. The hard drive is installed for the first time needs to format, you can enter the [Configuration] - [Record] - [Storage] to click format and select the hard disk.6. Email alerts is failed Possible Reasons:You had better use Gmail, do not use Yahoo or Hotmail. Alarm and email alerts function are not enabled.Solutions:Method 1: Please make sure the DVR has connected to the router and Internet successfully.Method 2: Please enable alarm and email alerts function.7. Forget password Solutions:Method 1: Please use password resetting email to get password.Method 2: Please contact technical engineer to reset password.please visit:Shenzhen Kean Digital co., Ltd.ADD: 10th Floor, Rujun Building, NO. 105, The Center Road,Bantian Street, Longgang District, Shenzhen, 518129,ChinaWeb: https://TechSupport:******************。
Network Video RecorderQuick Start GuideTABLE OF CONTENTSChapter1 Panels Description (8)1.1 Front Panel (8)1.2 Rear Panel (9)NVR-100H-D and NVR-100MH-D Series (9)NVR-100H-D/P and NVR-100MH-D/P Series (10)Chapter 2 Installation and Connections (11)2.1 NVR Installation (11)2.2 Hard Disk Installation (11)2.3 HDD Storage Calculation Chart (13)Chapter 3 Menu Operation (14)3.1 Startup and Shutdown (14)3.2 Activate Your Device (14)3.3 Set the Unlock Pattern for Login (15)3.4 User Login (16)3.5 Network Settings (16)3.6 Add IP Cameras (17)3.7 Live View (18)3.8 Recording Settings (18)3.9 Playback (19)Chapter 4 Accessing by Web Browser (21)Quick Start GuideCOPYRIGHT ©2019 Hangzhou Hikvision Digital Technology Co., Ltd.ALL RIGHTS RESERVED.Any and all information, including, among others, wordings, pictures, graphs are the properties of Hangzhou Hikvision Digital Technology Co., Ltd. or its subsidiaries (hereinafter referred to be “Hikvision”). This user manual (hereinafter referred to be “the Manual”) cannot be reproduced, changed, translated, or distributed, partially or wholly, by any means, without the prior written permission of Hikvision. Unless otherwise stipulated, Hikvision does not make any warranties, guarantees or representations, express or implied, regarding to the Manual.About this ManualThis Manual is applicable to Network Video Recorder (NVR).The Manual includes instructions for using and managing the product. Pictures, charts, images and all other information hereinafter are for description and explanation only. The information contained in the Manual is subject to change, without notice, due to firmware updates or other reasons. Please find the latest version in the company website (/en/).Please use this user manual under the guidance of professionals.Trademarks Acknowledgementand other Hikvision’s trademarks and logos are the properties of Hikvision in various jurisdictions. Other trademarks and logos mentioned below are the properties of their respective owners.The terms HDMI and HDMI High-Definition Multimedia Interface, and the HDMI Logoare trademarks or registered trademarks of HDMI Licensing Administrator, Inc. in the United States and other countries.Legal DisclaimerTO THE MAXIMUM EXTENT PERMITTED BY APPLICABLE LAW, THE PRODUCT DESCRIBED, WITH ITS HARDWARE, SOFTWARE AND FIRMWARE, IS PROVIDED “AS IS”, WITH ALL FAULTS AND ERRORS, AND HIKVISION MAKES NO WARRANTIES, EXPRESS OR IMPLIED, INCLUDING WITHOUT LIMITATION, MERCHANTABILITY, SATISFACTORY QUALITY, FITNESS FOR A PARTICULAR PURPOSE, AND NON-INFRINGEMENT OF THIRD PARTY. IN NO EVENT WILL HIKVISION, ITS DIRECTORS, OFFICERS, EMPLOYEES, OR AGENTS BE LIABLE TO YOU FOR ANY SPECIAL, CONSEQUENTIAL, INCIDENTAL, OR INDIRECT DAMAGES, INCLUDING, AMONG OTHERS, DAMAGES FOR LOSS OF BUSINESS PROFITS, BUSINESS INTERRUPTION, OR LOSS OF DATA OR DOCUMENTATION, IN CONNECTION WITH THE USE OF THIS PRODUCT, EVEN IF HIKVISION HAS BEEN ADVISED OF THE POSSIBILITY OF SUCH DAMAGES.REGARDING TO THE PRODUCT WITH INTERNET ACCESS, THE USE OF PRODUCT SHALL BE WHOLLY AT YOUR OWN RISKS. HIKVISION SHALL NOT TAKE ANY RESPONSIBILITES FOR ABNORMAL OPERATION, PRIVACY LEAKAGE OR OTHER DAMAGES RESULTING FROM CYBER ATTACK, HACKER ATTACK, VIRUS INSPECTION, OR OTHER INTERNET SECURITY RISKS; HOWEVER, HIKVISION WILL PROVIDE TIMELY TECHNICAL SUPPORT IF REQUIRED.SURVEILLANCE LAWS VARY BY JURISDICTION. PLEASE CHECK ALL RELEVANT LAWS IN YOUR JURISDICTION BEFORE USING THIS PRODUCT IN ORDER TO ENSURE THAT YOUR USE CONFORMSTHE APPLICABLE LAW. HIKVISION SHALL NOT BE LIABLE IN THE EVENT THAT THIS PRODUCT IS USED WITH ILLEGITIMATE PURPOSES.IN THE EVENT OF ANY CONFLICTS BETWEEN THIS MANUAL AND THE APPLICABLE LAW, THE LATER PREVAILS.Regulatory InformationFCC InformationPlease take attention that changes or modification not expressly approved by the party responsible for compliance could void the user’s authority to operate the equipment.FCC compliance: This equipment has been tested and found to comply with the limits for a Class A digital device, pursuant to part 15 of the FCC Rules. These limits are designed to provide reasonable protection against harmful interference when the equipment is operated in a commercial environment. This equipment generates, uses, and can radiate radio frequency energy and, if not installed and used in accordance with the instruction manual, may cause harmful interference to radio communications. Operation of this equipment in a residential area is likely to cause harmful interference in which case the user will be required to correct the interference at his own expense.FCC ConditionsThis device complies with part 15 of the FCC Rules. Operation is subject to the following two conditions:1. This device may not cause harmful interference.2. This device must accept any interference received, including interference that may cause undesired operation.EU Conformity StatementThis product and - if applicable - the supplied accessories too are marked with "CE" and comply therefore with the applicable harmonized European standards listed under the EMC Directive 2014/30/EU, the LVD Directive 2014/35/EU, the RoHS Directive 2011/65/EU.2012/19/EU (WEEE directive): Products marked with this symbol cannot be disposed of as unsorted municipal waste in the European Union. For proper recycling, return this product to your local supplier upon the purchase of equivalent new equipment, or dispose of it at designated collection points. For more information see: 2006/66/EC (battery directive): This product contains a battery that cannot be disposed of as unsorted municipal waste in the European Union. See the product documentation for specific battery information. The battery is marked with this symbol, which may include lettering to indicate cadmium (Cd), lead (Pb), or mercury (Hg). For proper recycling, return the battery to your supplier or to a designated collection point. For more information see: Industry Canada ICES-003 ComplianceThis device meets the CAN ICES-3 (A)/NMB-3(A) standards requirements.Applicable ModelsThis manual is applicable to the models listed in the following table.Series ModelNVR-100H-D NVR-104H-D NVR-108H-DNVR-100H-D/P NVR-104H-D/4P NVR-108H-D/8PNVR-100MH-D NVR-104MH-D NVR-108MH-DNVR-100MH-D/P NVR-104MH-D/4P NVR-108MH-D/8PSymbol ConventionsThe symbols that may be found in this document are defined as follows.Symbol DescriptionProvides additional information to emphasize or supplementimportant points of the main text.Indicates a potentially hazardous situation, which if not avoided,could result in equipment damage, data loss, performancedegradation, or unexpected results.Indicates a hazard with a high level of risk, which if not avoided, willresult in death or serious injury.Safety Instructions●Proper configuration of all passwords and other security settings is the responsibility of theinstaller and/or end-user.●In the use of the product, you must be in strict compliance with the electrical safetyregulations of the nation and region. Please refer to technical specifications for detailedinformation.●Input voltage should meet both the SELV (Safety Extra Low Voltage) and the Limited PowerSource with 100~240 VAC, 48 VDC or 12 VDC according to the IEC60950-1 standard. Please refer to technical specifications for detailed information.●Do not connect several devices to one power adapter as adapter overload may causeover-heating or a fire hazard.●Please make sure that the plug is firmly connected to the power socket.●If smoke, odor or noise rise from the device, turn off the power at once and unplug the powercable, and then please contact the service center.●If the POE ports of device do not comply with Limited Power Source, the additional equipmentconnected to POE ports shall have fire enclosure.●The USB interface of the /P devices can be connected with the mouse and U-flash disk storagedevice only.Preventive and Cautionary TipsBefore connecting and operating your device, please be advised of the following tips:●Ensure unit is installed in a well-ventilated, dust-free environment.●Unit is designed for indoor use only.●Keep all liquids away from the device.●Ensure environmental conditions meet factory specifications.●Ensure unit is properly secured to a rack or shelf. Major shocks or jolts to the unit as a result ofdropping it may cause damage to the sensitive electronics within the unit.●Use the device in conjunction with an UPS if possible.●Power down the unit before connecting and disconnecting accessories and peripherals.● A factory recommended HDD should be used for this device.●Improper use or replacement of the battery may result in hazard of explosion. Replace withthe same or equivalent type only. Dispose of used batteries according to the instructionsprovided by the battery manufacturer.Power Supply InstructionsUse only power supplies listed in the user instructions.NVR Models Standard Power Supply Models ManufacturerNVR-104H-D NVR-108H-D NVR-104MH-D NVR-108MH-D EuropeanMSA-C1500IC12.0-18P-DE MOSO Power Supply Technology Co., LtdADS-26FSG-12 12018EPG Shenzhen HONOR Electronic Co., LtdKL-AD3060VA Xiamen Keli Electronics Co., LtdKPD-018-VI Channel Well Technology Co., Ltd BritishADS-25FSG-12 12018GPB Shenzhen HONOR Electronic Co., LtdMSA-C1500IC12.0-18P-GB MOSO Power Supply Technology Co., LtdADS-26FSG-12 12018EPB Shenzhen HONOR Electronic Co., LtdNVR-104H-D/4PNVR-108H-D/8P NVR-104MH-D/4P NVR-108MH-D/8P UniversalMSP-Z1360IC48.0-65W MOSO Power Supply Technology Co., LtdMSA-Z1040IS48.0-65W-Q MOSO Power Supply Technology Co., LtdMSA-Z1360IS48.0-65W-QMOSO Power Supply Technology Co., Ltd●The power supplies list above is for EU countries only.●The power supplies list is subject to change without prior notice.Chapter1 Panels Description 1.1 Front PanelFigure 1-1NVR-100H-D (/P) SeriesFigure 1-2NVR-100MH-D (/P) SeriesTable 1-1Description of Front Panel No. Icon Description1 Indicator turns red when NVR is powered up.2 Indicator lights in red when data is being read from or written to HDD.3 Indicator blinks blue when network connection is functioning properly.1.2 Rear PanelNVR-100H-D and NVR-100MH-D SeriesFigure 1-3NVR-100H-D Rear PanelFigure 1-4NVR-100MH-D Rear PanelNo. Item Description1 Power Supply 12 VDC power supply.2 VGA Interface DB9 connector for VGA output. Display local videooutput and menu.3 HDMI Interface HDMI video output connector.4 USB Interface Universal Serial Bus (USB) ports for additional devicessuch as USB mouse and USB Hard Disk Drive (HDD).5 LAN Network Interface 10/100 Mbps self-adaptive Ethernet interface.6 Ground Ground (needs to be connected when NVR starts up).NVR-100H-D/P and NVR-100MH-D/P SeriesFigure 1-5NVR-100H-D/P Rear PanelFigure 1-6NVR-100MH-D/P Rear PanelTable 1-3Description of Rear Panel No. Item Description1 Power Supply 12 VDC power supply.2 VGA Interface DB9 connector for VGA output. Display local videooutput and menu.3 HDMI Interface HDMI video output connector.4 USB Interface Universal Serial Bus (USB) ports for additional devicessuch as USB mouse and USB Hard Disk Drive (HDD).5 LAN Network Interface 10/100 Mbps self-adaptive Ethernet interface.6 Ground Ground (needs to be connected when NVR starts up).7 Network Interfaces withPoE functionNetwork interfaces for the cameras and to providepower over Ethernet.4 interfaces for /4P models and 8 interfaces for /8Pmodels.Chapter 2 Installation and Connections2.1 NVR InstallationDuring installation of the NVR:●Use brackets for rack mounting.●Ensure ample room for audio and video cables.●When routing cables, ensure that the bend radius of the cables are no less than five times thanits diameter.●Connect the alarm cable.●Allow at least 2cm (≈0.75-inch) of space between racks mounted devices.●Ensure the NVR is grounded.●Environmental temperature should be within the range of -10 to +55º C, +14 to +131º F.●Environmental humidity should be within the range of 10% to 90%.2.2 Hard Disk InstallationBefore you start:Disconnect the power from the NVR before installing a hard disk drive (HDD). A factory recommended HDD should be used for this installation.Tools Required: Screwdriver.Step 1Remove the cover from the device by unfastening the screws on the bottom.Figure 2-1Remove the CoverStep 2Place the HDD on the bottom of the device and then fasten the screws on the bottom to fix the HDD.Figure 2-2Fix the HDDStep 3Connect one end of the data cable to the motherboard of NVR and the other end to the HDD.Step 4Connect the power cable to the HDD.Figure 2-3Connect CablesStep 5Re-install the cover of the NVR and fasten screws.2.3 HDD Storage Calculation ChartThe following chart shows an estimation of storage space used based on recording at one channel for an hour at a fixed bit rate.Bit Rate Storage Used96K42M128K56M160K70M192K84M224K98M256K112M320K140M384K168M448K196M512K225M640K281M768K337M896K393M1024K450M1280K562M1536K675M1792K787M2048K900M4096K 1.8G8192K 3.6G16384K 7.2GPlease note that supplied values for storage space used is just for reference. The storage values in the chart are estimated by formulas and may have some deviation from actual value.Chapter 3 Menu Operation3.1 Startup and ShutdownProper startup and shutdown procedures are crucial to expanding the life of the NVR.To start your NVR:Step 1Check the power supply is plugged into an electrical outlet. It is HIGHLY recommended that an Uninterruptible Power Supply (UPS) be used in conjunction with the device. The Powerbutton) on the front panel should be red, indicating the device is receiving the power.Step 2Press the power switch on the panel. The Power LED should turn blue. The unit will begin to start.After the device starts up, the wizard will guide you through the initial settings, including modifying password, date and time settings, network settings, HDD initializing, and recording.To shut down the NVR:Step 1Go to Menu > Shutdown.Figure 3-1ShutdownStep 2Select Shutdown.Step 3Click Yes.3.2 Activate Your DevicePurpose:For the first-time access, you need to activate the device by setting an admin password. No operation is allowed before activation. You can also activate the device via Web Browser, SADP or client software.Step 1Input the same password in Create New Password and Confirm New Password.Step 2(Optional) Use customized password to activate and add network camera(s) connected to the device.1)Uncheck Use Channel Default Password.2)Enter a password in IP Camera Activation.Figure 3-2Set Admin PasswordSTRONG PASSWORD RECOMMENDED–We highly recommend you create a strong password of your own choosing (Using a minimum of 8 characters, including at least three of the following categories: upper case letters, lower case letters, numbers, and special characters.) in order to increase the security of your product. And we recommend you reset your password regularly, especially in the high security system, resetting the password monthly or weekly can better protect your product.Step 3Click OK.3.3 Set the Unlock Pattern for LoginAdmin can use the unlock pattern for device login.For devices with PoE function, you can draw the device unlock pattern after activation. For other devices, the unlock pattern interface will show after the first-time login.Step 1Use the mouse to draw a pattern among the 9 dots on the screen. Release the mouse when the pattern is done.Figure 3-3Draw the Pattern●Connect at least 4 dots to draw the pattern.●Each dot can be connected for once only.Step 2Draw the same pattern again to confirm it. When the two patterns match, the pattern is configured successfully.3.4 User LoginPurpose:If NVR has logged out, you must login the device before operating the menu and other functions. Step 1Select the User Name in the dropdown list.Figure 3-4LoginStep 2Input Password.Step 3Click OK.In the Login dialog box, if you enter the wrong password 7 times, the current user account will be locked for 60 seconds.3.5 Network SettingsPurpose:Network settings must be properly configured before you operate NVR over network.Step 1Enter the general network settings interface.Menu > Configuration > Network > GeneralFigure 3-5Network SettingsStep 2Configure the following settings: NIC Type, IPv4 Address, IPv4 Gateway, MTU and DNS Server.Step 3If the DHCP server is available, you can check the checkbox of DHCP to automatically obtain an IP address and other network settings from that server.Step 4Click Apply.3.6 Add IP CamerasPurpose:Before you can get live video or record the video files, you should add the network cameras to the connection list of the device.Before you start:Ensure the network connection is valid and correct, and the IP camera to add has already been activated. Please refer to the User Manual for activating the inactive IP camera.You can select one of the following three options to add the IP camera.OPTION 1:Step 1Click to select an idle window in the live view mode.Step 2Click in the center of the window to pop up the Add IP Camera interface.Figure 3-6Add IP CameraStep 3Select the detected IP camera and click Add to add it directly, and you can click Search to refresh the online IP camera manually.Or you can choose to custom add the IP camera by editing the parameters in thecorresponding text field and then click Add to add it.3.7 Live ViewIcons are provided on screen in Live View mode to indicate camera status. These icons include: Live View IconsIn the live view mode, there are icons at the upper-right corner of the screen for each channel, showing the status of the record and alarm in the channel for quick reference.Alarm (video loss, tampering, motion detection, VCA or sensor alarm)Record (manual record, continuous record, motion detection, VCA or alarm triggered record)Alarm and RecordEvent/Exception (event and exception information, appears at the lower-left corner of the screen.)3.8 Recording SettingsBefore you start:Make sure that the disk has already been installed. If not, please install a disk and initialize it. You may refer to the user manual for detailed information.Purpose:Two kinds of record types are introduced in the following section, including Instant Record andAll-day Record. And for other record types, you may refer to the user manual for detailed information.After rebooting all the manual records enabled are canceled.Step 1On the live view window, right lick the window and move the cursor to the Start Recording option, and select Continuous Record or Motion Detection Record on your demand.Figure 3-7Start Recording from Right-click MenuStep 2Click Yes in the pop-up Attention message box to confirm the settings. All the channels will start to record in the selected mode.3.9 PlaybackThe recorded video files on the hard disk can be played back in the following modes: instant playback, all-day playback for the specified channel, and playback bynormal/event/smart/tag/sub-periods/external file search.Step 1Enter playback interface.Click Menu > Playback or from the right-click menuStep 2Check the checkbox of channel(s) in the channel list and then double-click to select a date on the calendar.Step 3You can use the toolbar in the bottom part of Playback interface to control playing progress.Figure 3-8 Playback InterfaceStep 4 Select the channel(s) to or execute simultaneous playback of multiple channels.Chapter 4 Accessing by Web BrowserYou shall acknowledge that the use of the product with Internet access might be under network security risks. For avoidance of any network attacks and information leakage, please strengthen your own protection. If the product does not work properly, please contact with your dealer or the nearest service center.Purpose:You can get access to the device via web browser. You may use one of the following listed web browsers: Internet Explorer 6.0, Internet Explorer 7.0, Internet Explorer 8.0, Internet Explorer 9.0, Internet Explorer 10.0, Internet Explorer 11.0, Apple Safari, Mozilla Firefox, and Google Chrome. The supported resolutions include 1024*768 and above.Step 1Open web browser, input the IP address of the device and then press Enter.Step 2Login to the device.If the device has not been activated, you need to activate the device first before login.Figure 4-1Set Admin Password1)Set the password for the admin user account.2)Click OK.STRONG PASSWORD RECOMMENDED–We highly recommend you create a strong password of your own choosing (using a minimum of 8 characters, including upper case letters, lower case letters, numbers, and special characters) in order to increase the security of your product. And we recommend you reset your password regularly, especially in the high security system, resetting the password monthly or weekly can better protect your product.If the device is already activated, enter the user name and password in the login interface, and click Login.Figure 4-2LoginStep 3Install the plug-in before viewing the live video and managing the camera. Please follow the installation prompts to install the plug-in.You may have to close the web browser to finish the installation of the plug-in.After login, you can perform the operation and configuration of the device, including the live view, playback, log search, configuration, etc.03041041090702。
计算机视觉领域期刊计算机视觉和模式识别领域的代表就是四⼤顶会了:ICCV、ECCV、CVPR、NIPS,还有就是难度最⾼的PAMI了,这些都让⼈望⽽⽣畏。
那么除了这些⽿熟能详的期刊和会议之外,还有哪些该领域的期刊呢?下⾯我收集了⼀些该领域的代表性期刊,并介绍了他们的影响因⼦以及投稿难度和审稿周期。
希望对⼤家有帮助吧,后期⼤家还有发现的可以留⾔,补充哦。
⾸先介绍计算机视觉领域的4个顶级代表性期刊吧。
(1) IEEE Transactions on Pattern Analysis and Machine Intelligence,IEEE模式分析与机器智能汇刊,简称PAMI,是IEEE最重要的学术性汇刊之⼀。
在各种统计中,PAMI被认为有着很强的影响因⼦(2011年影响因⼦为4.9)和很⾼的排名。
显然,这个期刊的中稿难度那是相当的⼤,⼀般先投中CVPR之后再加点东西投该期刊会⽐较好中⼀点。
(2) ACM Transactions on Graphics。
美国计算机协会图形汇刊,简称TOG,该刊侧重于计算机图形的处理,影响因⼦在该领域也⽐较⾼,2011年为3.5。
中稿的难度也极⼤,⼀般该刊对每年的SIGGRAPH(Special Interest Group for Computer GRAPHICS,计算机图形图像特别兴趣⼩组)会议论⽂全⽂收录。
(3) International Journal of Computer vision,该刊也是该领域的顶级期刊之⼀,相⽐于PAMI来讲,该刊侧重于理论的推导。
2011年影响因⼦为3.7,中稿难度也相当⼤。
(4) IEEE Transactions on Image Processing,该刊也是图像处理领域的代表性期刊之⼀,相⽐于上⾯三个期刊来讲,该刊稍微低⼀点层次。
2011年影响因⼦为3.042,中稿难度也⽐较⼤。
审稿周期⼀年左右。
除了上述让⼈望⽽⽣畏的顶级期刊之外,我们再看看⼀般的期刊吧。
Smart RecognitionContents Contents (1)1. Applicable models and software versions (1)2. Restrictions (2)3. Outline (2)4. Using Method (2)4.1. Create parts data (2)4.2. Create model data (4)4.3. Error Message (14)5. Setting (17)1. Applicable models and software versions Applicable items and software version are as below.2. RestrictionsThere are restrictions on use of this function as described below.The system board with a memory capacity of 1GB or more is required.In the case of Smart Recognition parts created before VGOS V3.42STD R1.000 orV4.42STD R1.000 [*1], number of Smart Recognition parts to be recognized is upto “1” in each pick up group. When Smart Recognition parts are mountedcontinuously, the mounting is performed one by one.In the case of Smart Recognition parts created before VGOS V3.42STD R1.000 orV4.42STD R1.000 [*1], when the Smart Recognition parts have many edges, ittakes time to recognize. Therefore, sometimes the recognition doesn’t finish untilthe head arrives at the mounting position and needs to wait to start mounting.The parts data for Smart Recognition is saved only in the following environment.VGOS V30 and P-TOOL(Only YGX file type)3. Outline“Smart Recognition” is a function to execute vision algorithms of general versatility and higher robustness.A template(model) is created from a vision image, and the parts are positioned based on the model. This makes it possible to recognize complicated shape of parts that was unable or difficult to be recognized with the existing algorithms.Parts not applicable to Smart RecognitionThe following parts are not applicable to Smart Recognition.Parts with data that can be created with an alignment group, “Chip”, “IC”, or“Connector”.Parts with data that can be created with an alignment group, “Special” and alignment type, “Special”, “Odd Chip”, “Mark”, “Sq. Quad”, or “Gravity”.Ball partsParts with leads less than 0.3mmToo small or too large parts that can’t satisfy the conditions to register as parts shape models (Number of registration points must be 100 or more and less than1000)4. Using Method4.1. Create parts dataFirst, create parts data for Smart Recognition as follows.↓Set [Alignment Group] to “Special”, and[Align Type] to “Smart Recognition”.Modify the parameters such as [Body Size], [Search Area (mm)], and [Lighting Level] which are necessary for parts recognition↓4.2. Create model data4.2.1 Screen StructureDisplays vision images such as captured image and edge image.② ModeAllows you to select an image type to display on Vision Window.③ Operation WindowAllows you to operate the model creation process here throughout Capturing Image, Creating Model, and Vision Test. This screen is displayed in the wizard format. ④ Guide MessageDisplays guide messages you need to do next.⑤ Screen Change ButtonsNext Goes to the next screen.Back Goes back to the previous screen.OK Saves the model data you are creating in the parts adjust data and goes back to the parts adjust screen.Cancel Cancels all model data you are creating and goes back to the parts adjust screen.Vision WindowVision WindowOperation WindowModeGuide M essageScree n Change Button4.2.2 How to create model dataModel data for Smart Recognition is created through the following procedure.11) Save model dataExplains details of each step below.1) Pick up partsPress the [Pick Up] button on the [Get Image] screen to pick up parts. In case of the parts already picked up on the head, you can skip this step.2) Capture an imagePress the [Get Image] button to capture the parts image.The parts will be recognized by the vision camera and the captured image will be displayed on the vision window.In case of the parts picked up out of the center of the nozzle or with too much rotated, press the [Dump] button and try it again.1) Pick up parts Capture an Image 2)Specify edge detection frame 3) Correct the image angle 4) Move to the Create Model screen 5) Adjust detected edges 6) 7) Set the center of parts 8) Move to the Vision Test screen 9) Set the recognition condition 10) Vi s ion Test3) Specify edge detection frameTo specify an edge detection frame, enclose the parts by dragging the mouse on the vision window.Just after the image captured, the outer frame of the image is automatically set as its edge detection frame. You can go to the next step without adjusting the frame, but in that case, there is a possibility that something on the white space can be detected incorrectly as parts edges. Therefore, it is recommended to set edge detection frame with its absolute minimum margin.4) Correct the image angleTo create a model for Smart Recognition, adjust the angle of the image to make it straight (angle 0°). Mount angle 0°is also based on this angle, so be sure to set this angle precisely.①Rotate the imageAllows you to rotate the image enclosed with the edge detection frame.②Rotating angleAllows you to specify a rotating angle.②5) Move to the Create Model screenPress the [Next] button to go to the [Create Model] screen.When the screen is switched, the edges are detected automatically from the captured image, and the vision window switches to an image superimposing of the detected edge image on the captured parts image.An error may occur if the detected edges are too many or too few.If it is difficult to see detected edges, check only the [Detected Edge] check box.6) Adjust detected edgesAdjust the number of edges that are detected automatically.100 to 999 edges can be set, but the more edges it has, the more time the recognition process will take. Therefore 100 to 499 edges are recommended.Change edge threshold If the edges are too many or few, modify the edge threshold todecrease or increase the number.Compress edge If the edges are too many, thin out some edges.Erase edge manually Erase false detection as parts edges if any.Or erase edges that are not necessary for model creation.①Edge NumThe number of current edges.If the number is not appropriate, the background color will turn to the warning condition as below.100 to 499 : Grey (appropriate)500 to 999 : Yellow (acceptable but takes time)0 to 49 or over 1000 : Red (error at switching the screen)②Edge Threshold(Edit box)Allows you to change the edge threshold value inputting value here.③Edge Threshold(Slide bar)Allows you to change the edge threshold value dragging the slide bar.④Edge Threshold(Slide bar button)Allows you to change the edge threshold value ±1 by one-click.⑤Manual CompressWhen [Manual] is checked, [⑥Manual Compress Level] is enabled.⑥Manual Compress LevelAllows you to select a manual compressing level.You can select a level from 1/1 to 1/10.Compressing level decided automatically is displayed here in gray.⑦Erase edge manuallyWhen [Erase edge manually] is checked, ⑧ to ⑪ are enabled.⑧Erase Edge(Point)Allows you to change how to erase edges to the Point mode.The mouse cursor on the vision window turns to an eraser, and you can erase any edge as you like by dragging the mouse.⑨Erase Edge(Rectangle)Allows you to change how to erase edges to the Rectangle mode.You can select an area by dragging the mouse, and erase edges in the area at once.⑩Erase Edge(Undo)Restores erased edges to the previous status.If the edges have been erased in the point mode, they are not restored point-by-point, but restored by each dragging mouse action.⑪Erase Edge(Undo All)Restores all erased edges to the original status.※ [Attention] Please note that the edge condition will be initialized, if you go back to the [Get Image] screen from the [Create Model] screen※[Attention] Please note that the edge condition will be initialized, if you execute Manual Compress after erasing edges.7) Set the center of the parts.When you go to the [Create Model] screen and parts edges are detected, the edges are surrounded with a circumscribed square frame of green dots line, and its center is automatically detected.However, if you executed [6] Adjust detected edges, the circumscribed frame may have been changed as well. In that case, you need to set the center again. To set the center, press the [Centering] button. Also you can set it manually.①Auto centeringAutomatically detects the center of the circumscribed frame on the visionwindow. Circumscribed frame : Square surrounding the point of max and min XYwhere edges exist.Center Position : The vertex of divided circumscribed frame in half.②Manual centering (Select how to move)Start :Changes to the mode, in which the center of the circumscribed frame is resized with its lower right portion fixed.End :Changes to the mode, in which the center of the circumscribed frame is resized with its upper left portion fixed.Move :Changes to the mode, in which the whole of the center of the circumscribed frame is moved.After you select a mode, press the ④ button to move the frame to the specifiedposition.③Manual centering (Select moving range)Allows you to select a moving range by one-click of [④Manual centering(Move)] to resize or move the circumscribed frame.④Manual centering(Move)Resizes or moves the circumscribed frame. It works in the mode you select in [②Manual(Select how to move)] and [③Manual(Select moving range)].8) Move to the Vision T est screenPress the [Next] button to go to the [Vision Test] screen.Smart Recognition model data will be created based on the data you created on the [Create Model] screen.9) Set recognition conditionsSet conditions for Smart Recognition.Edge Threshold If the reflection of the parts is dark, set a threshold value lower than that you have created on the Create Model screen, which enables to detect more edges.It is recommended to set this value “20” or more.Minimum Match Level This is the basis to judge the match level between model data and recognition image.If the match level is lower than this value, a recognition error occurs.If this level is too low, it can cause mis-recognition or mis-judgement. It is recommended to set this value “80” or more.Angle Search Area Detectable parts angle setting.It is recommended to set this value within “20” degree.①Edge ThresholdInput [Edge Threshold].②Minimum Match LevelInput [Minimum Match Level].③Angle Search AreaInput [Angle Search Area].10) Vision testExecutes a vision test with the created model data and the recognition condition setting.This checks whether or not the recognition result has any fault.①TestExecutes a recognition test.②Monitor ModeChanges the monitor mode of recognition result displayed on the vision window.None Displays only the parts image.Displays the recognition result values.VisionResultDisplays the edge detection range.DetectionRangeModel Displays the model data.Displays the detected edges.EdgePos.Last Pos. Displays the center of parts.Use this to display with some results at once.DetailSetting③Recognition ResultDisplays recognition result.X, Y, R : Displays difference between recognition basis and result. Match :Displays matching value of recognition result.④Recognition Result (Message)Displays a recognition result message.If recognition test is failed, error cause and error number are displayed.11) Save ModelPress the [OK] button to save the created model data.※[Caution] When you press the [OK] button, you go back to the [Parts Adjust] screen, with the model data still kept in the parts adjust data.However, please note that if you press the [Cancel] button on the [Parts Adjust] screen, the model data will be deleted.4.3. Error Message5. Setting5.1. Setting methodThis function is enabled with the following setting.Fig 4.1。
Chapter10VISION AND VIDEO:MODELS AND APPLICATIONSStefan WinklerSwiss Federal Institute of Technology–EPFLSignal Processing Laboratory1015Lausanne,SwitzerlandStefan.Winkler@epfl.chChristian J.van den Branden LambrechtEMC Media Group80South StreetHopkinton,MA01748,USAvdb@Murat KuntSwiss Federal Institute of Technology–EPFLSignal Processing Laboratory1015Lausanne,SwitzerlandMurat.Kunt@epfl.ch1.INTRODUCTIONWhile traditional analog systems still form the vast majority of television sets today,production studios,broadcasters and network providers have been installing digital video equipment at an ever-increasing rate.The border line between analog and digital video is moving closer and closer to the consumer. Digital satellite and cable service have been available for a while,and re-cently terrestrial digital television broadcast has been introduced in a number of locations around the world.12Analog video systems,which have been around for more than half a century now,are among the most successful technical inventions measured by their market penetration(more than1billion TV receivers in the world)and the time span of their widespread use.However,because of the closed-system approach inherent to analog technology,any new functionality or processing is utterly difficult to incorporate in the existing systems.The introduction of digital video systems has given engineers additional degrees of freedom due to theflexibility of digital information processing and the ever-decreasing cost of computing power.Reducing the bandwidth and storage requirements while maintaining a quality superior to that of analog video has been the priority in the design of these new systems.Many optimizations and improvements of video processing methods have relied on purely mathematical measures of optimality,such as mean squared error(MSE)or signal-to-noise ratio(SNR).However,these simple measures operate solely on a pixel-by-pixel basis and neglect the important influence of image content and viewing conditions on the actual visibility of artifacts. Therefore,their predictions often do not agree well with visual perception.In the attempt to increase compression ratios for video coding even further, engineers have turned to vision science in order to better exploit the limitations of the human visual system.As a matter of fact,there is a wide range of applications for vision models in the domain of digital video,some of which we outline in this chapter.However,the human visual system is extremely complex,and many of its properties are still not well understood.While certain aspects have already found their way into video systems design,and while even ad-hoc solutions based on educated guesses can provide satisfying results to a certain extent,significant advancements of the current state of the art will require an in-depth understanding of human vision.Since a detailed treatment of spatial vision can be found in other chapters of this book,our emphasis here is on temporal aspects of vision and modeling, which is the topic of Section2.Then we take a look at the basic concepts of video coding in Section3.An overview of spatio-temporal vision modeling, including a perceptual distortion metric developed by the authors,is given in Section4.We conclude the chapter by applying vision models to a number of typical video test and measurement tasks in Section5.2.MOTION PERCEPTIONMotion perception is a fundamental aspect of vision and aids us in many essential visual tasks:it facilitates depth perception,object discrimination, gaze direction,and the estimation of object displacement.Motion,particularly in the peripheral visualfield,attracts our attention.Vision and Video:Models and Applications3 There are many controversial opinions about motion perception.Motion has often been closely linked to the notion of opticalflow,particularly in the work on motion prediction for video coding.Sometimes,however,motion can be perceived in stimuli that do not contain any actual movement,which is referred to as apparent motion.In light of these concepts,motion is better defined as a psychological sensation,a visual inference,similar to color perception.The images on the retina are just time-varying patterns of light;the evolution of these light distributions over time is then interpreted by the visual system to create a perception of objects moving in a three-dimensional world.Extending spatial models for still images to handle moving pictures calls for a close examination of the way temporally varying visual information is processed in the human brain[73].The design of spatio-temporal vision models(cf.Section4.)is complicated by the fact that much less attention of vision research has been devoted to temporal aspects than to spatial aspects. In this section,we take a closer look at the perception of motion and the temporal mechanisms of the human visual system,in particular the temporal and spatio-temporal contrast sensitivity functions,temporal masking,and pattern adaptation.2.1TEMPORAL MECHANISMSEarly models of spatial vision were based on the single-channel assump-tion,i.e.the entire input is processed together and in the same way.Due to their inability to model signal interactions,however,single-channel models are unable to cope with more complex patterns and cannot explain data from experiments on masking and pattern adaptation.This led to the development of multi-channel models,which employ a bank offilters tuned to different fre-quencies and orientations.Studies of the visual cortex have shown that many of its neurons actually exhibit receptivefields with such tuning characteristics [14];serving as an oriented band-passfilter,the neuron responds to a certain range of spatial frequencies and orientations.Temporal mechanisms have been studied by vision researchers for many years,but there is less agreement about their characteristics than those of spa-tial mechanisms.It is believed that there are one temporal low-pass and one, possibly two,temporal band-pass mechanisms[19,27,39,64],which are gener-ally referred to as sustained and transient channels,respectively.Physiological experiments confirm these results to the extent that low-pass and band-pass mechanisms have been found[17].However,neurons with band-pass prop-erties exhibit a wide range of peak frequencies.Recent results also indicate that the peak frequency and bandwidth of the mechanisms change consider-ably with stimulus energy[18].The existence of an actual third mechanism is questionable,though[19,24].4In a recent study[19],for example,temporal mechanisms are modeled with a two-parameter function and its derivatives.It is possible to achieve a very goodfit to a large set of psychophysical data using only this function and its second derivative,corresponding to one sustained and one transient mechanism, respectively.The frequency responses of the correspondingfilters for a typical choice of parameters are used and shown later in Section4.2.2.2.2CONTRAST SENSITIVITYThe response of the human visual system to a stimulus depends much less on the absolute luminance than on the relation of its local variations to the surrounding luminance.This property is known as Weber’s law,and contrast is a measure of this relative variation of luminance.While Weber’s law is only an approximation of the actual sensory perception,contrast measures based on this concept are widely used in vision science.Unfortunately,a common definition of contrast suitable for all situations does not exist,not even for simple stimuli.Mathematically,Weber contrast can be expressed as C=∆L/L.In vi-sion experiments,this definition is used mainly for patterns consisting of an increment or decrement∆L to an otherwise uniform background luminance L.However,such a simple definition is inappropriate for measuring contrast in complex images,because a few very bright or very dark points would determine the contrast of the entire image.Furthermore,human contrast sensitivity varies with the adaptation level associated with the local average luminance.Local band-limited contrast measures have been introduced to address these issues [41,42,76]and have been used successfully in a number of vision models [12,37].Our sensitivity to contrast depends on the color as well as the spatial and temporal frequency of the stimuli.Contrast sensitivity functions(CSF’s)are generally used to quantify these dependencies.Contrast sensitivity is defined as the inverse of the contrast threshold,i.e.the minimum contrast necessary for an observer to detect a stimulus.Spatio-temporal CSF approximations are shown in Figure10.1.Achro-matic contrast sensitivity is generally higher than chromatic,especially for high spatio-temporal frequencies.The full range of colors is perceived only at low frequencies.As spatio-temporal frequencies increase,sensitivity to blue-yellow stimuli declinesfirst.At even higher frequencies,sensitivity to red-green stimuli diminishes as well,and perception becomes achromatic.On the other hand,achromatic sensitivity decreases slightly at low spatio-temporal frequencies,whereas chromatic sensitivity does not(see Figure10.1).How-ever,this apparent attenuation of sensitivity towards low frequencies may be attributed to implicit masking,i.e.masking by the spectrum of the window within which the test gratings are presented[78].Vision and Video:Models and Applications5Figure10.1Approximations of achromatic(left)and chromatic(right)spatio-temporal contrast sensitivity functions[6,32,33].There has been some debate about the space-time separability of the spatio-temporal CSF.This property is of interest in vision modeling because a CSF that could be expressed as a product of spatial and temporal components would simplify modeling.Early studies concluded that the spatio-temporal CSF was not space-time separable at lower frequencies[34,47].Kelly[31]measured contrast sensitivity under stabilized conditions(i.e.the stimuli were stabilized on the retina by compensating for the observers’eye movements)andfit an analytic function to these measurements[32],which yields a very close ap-proximation of the spatio-temporal CSF for counter-phaseflicker.It was found that this CSF and its chromatic counterparts can also be approximated by linear combinations of two space-time separable components termed excitatory and inhibitory CSF’s[6,33].Measurements of the spatio-temporal CSF for both in-phase and conven-tional counter-phase modulation suggest that the underlyingfilters are indeed spatio-temporally separable and have the shape of low-pass exponentials[77]. The spatio-temporal interactions observed for counter-phase modulation can be explained as a product of masking by the zero-frequency component of the gratings.The important issue of unconstrained eye movements in CSF models is addressed in Chapter??.Natural drift,smooth pursuit and saccadic eye move-ments can be included in Kelly’s formulation of the stabilized spatio-temporal CSF using a model for eye velocity[13].In a similar manner,motion compensa-tion of the CSF can be achieved by estimating smooth-pursuit eye movements under the worst-case assumption that the observer is capable of tracking all objects in the scene[70].62.3TEMPORAL MASKINGMasking is a very important phenomenon in perception as it describes inter-actions between stimuli(cf.Chapter??).Masking occurs when a stimulus that is visible by itself cannot be detected due to the presence of another.Some-times the opposite effect,facilitation,occurs:a stimulus that is not visible by itself can be detected due to the presence of another.Within the framework of imaging and video applications it is helpful to think of the distortion or coding noise being masked(or facilitated)by the original image or sequence acting as background.Masking explains why similar coding artifacts are disturbing in certain regions of an image while they are hardly noticeable elsewhere.Masking is strongest between stimuli located in the same perceptual channel, and many vision models are limited to this intra-channel masking.However, psychophysical experiments show that masking also occurs between channels of different orientations[16],between channels of different spatial frequency, and between chrominance and luminance channels[8,36,56],albeit to a lesser extent.Temporal masking is an elevation of visibility thresholds due to temporal discontinuities in intensity,e.g.scene cuts.Within the framework of television, it wasfirst studied by Seyler and Budrikis[52,53],who concluded that threshold elevation may last up to a few hundred milliseconds after a transition from dark to bright or from bright to dark.In a more recent study on the visibility of MPEG-2coding artifacts after a scene cut,significant visual masking effects were found only in thefirst subsequent frame[57].A strong dependence on stimulus polarity has also been noticed[7]:The masking effect is much more pronounced when target and masker match in polarity,and it is greatest for local spatial configurations.Similar to to the case of spatial stimulus interactions, the opposite of temporal masking,temporal facilitation,has been observed at low-contrast discontinuities.Interestingly,temporal masking can occur not only after a discontinuity (“forward masking”),but also before.This“backward masking”may be explained as the result of the variation in the latency of the neural signals in the visual system as a function of their intensity[1].So far,the above-mentioned temporal masking effects have received much less attention in the video coding community than their spatial counterparts. In principle,temporal masking can be taken into account with a contrast gain control model(cf.Section4.2.3),as demonstrated in[21].A video quality metric that incorporates forward masking effects by means of a low-passfiltered masking sequence is described in[66].Vision and Video:Models and Applications7 2.4ADAPTATIONPattern adaptation in the human visual system is the adjustment of contrast sensitivity in response to the prevailing stimulation patterns.For example, adaptation to patterns of a certain frequency can lead to a noticeable decrease of contrast sensitivity around this frequency[22,55,71].Together with mask-ing,adaptation was one of the major incentives for developing a multi-channel theory of vision.However,pattern adaptation has a distinct temporal com-ponent to it and is not automatically taken into account by a multi-channel representation of the input;it needs to be incorporated explicitly by adapting the pertinent model parameters.A single-mechanism model that accounts for both pattern adaptation and masking effects of simple stimuli was presented in [49],for example.An interesting study in this respect used natural images of outdoor scenes (both distant views and close-ups)as adapting stimuli[68].It was found that exposure to such stimuli induces pronounced changes in contrast sensitivity. The effects can be characterized by selective losses in sensitivity at lower to medium spatial frequencies.This is consistent with the characteristic amplitude spectra of natural images,which decrease with frequency roughly as1/f.Likewise,an examination of how color sensitivity and appearance might be influenced by adaptation to the color distributions of images[69]revealed that natural scenes exhibit a limited range of chromatic distributions,hence the range of adaptation states is normally limited as well.However,the variability is large enough so that different adaptation effects may occur for individual scenes and for different viewing conditions.3.VIDEO CONCEPTS3.1STANDARDSThe Moving Picture Experts Group(MPEG)1is a working group of ISO/IEC in charge of the development of international standards for compression,de-compression,processing,and coded representation of moving pictures,au-dio and their combination.MPEG comprises some of the most popular and widespread standards for video coding.The group was established in January 1988,and since then it has produced:MPEG-1,a standard for storage and retrieval of moving pictures and audio,which was approved in November1992.MPEG-1is intended to be generic,i.e.only the coding syntax is defined and therefore mainly the decoding scheme is standardized.MPEG-1defines a block-based hybrid 1See http://drogo.cselt.stet.it/mpeg/for an overview of its activities.8DCT/DPCM coding scheme with prediction and motion compensation.It also provides functionality for random access in digital storage media.MPEG-2,a standard for digital television,which was approved in Novem-ber1994.The video coding scheme used in MPEG-2is again generic;it is a refinement of the one in MPEG-1.Special consideration is given to interlaced sources.Furthermore,many functionalities such as scala-bility were introduced.In order to keep implementation complexity low for products not requiring all video formats supported by the standard, so-called“Profiles”,describing functionalities,and“Levels”,describ-ing resolutions,were defined to provide separate MPEG-2conformance levels.MPEG-4,a standard for multimedia applications,whosefirst version was approved in October1998.MPEG-4addresses the need for robustness in error-prone environments,interactive functionality for content-based access and manipulation,and a high compression efficiency at very low bitrates.MPEG-4achieves these goals by means of an object-oriented coding scheme using so-called“audio-visual objects”,for example a fixed background,the picture of a person in front of that background,the voice associated with that person etc.The basic video coding structure supports shape coding,motion compensation,DCT-based texture coding as well as a zerotree wavelet algorithm.MPEG-7,a standard for content representation in the context of audio-visual information indexing,search and retrieval,which is scheduled for approval in late2001.The standards being used commercially today are mainly MPEG-1(in older compact discs),MPEG-2(for digital TV and DVD’s),and H.261/H.263(which use related compression methods for low-bitrate communications).Some broadcasting companies in the US and in Europe have already started broadcast-ing television programs that are MPEG-2compressed,and DVD’s are rapidly gaining in popularity in the home video sector.For further information on these and other compression standards,the interested reader is referred to[4].3.2COLOR CODINGMany standards,such as PAL,NTSC,MPEG,or JPEG,are already based on human vision in the way color information is processed.In particular,they take into account the nonlinear perception of lightness,the organization of color channels,and the low chromatic acuity of the human visual system.Conventional television cathode ray tube(CRT)displays have a nonlinear, roughly exponential relationship between frame buffer RGB values or signalVision and Video:Models and Applications9 voltage and displayed intensity.In order to compensate for this,gamma cor-rection is applied to the intensity values before coding.It so happens that thehuman visual system has an approximately logarithmic response to intensity,which is very nearly the inverse of the CRT nonlinearity[45].Therefore,cod-ing visual information in the gamma-corrected domain not only compensatesfor CRT behavior,but is also more meaningful perceptually.Furthermore,it has been long known that some pairs of hues can coexist in asingle color sensation,while others cannot.This led to the conclusion that thesensations of red and green as well as blue and yellow are encoded in separatevisual pathways,which is commonly referred to as the theory of opponentcolors(cf.Chapter??).It states that the human visual system decorrelates itsinput into black-white,red-green and blue-yellow difference signals.As pointed out before in Section2.2,chromatic visual acuity is significantlylower than achromatic acuity.In order to take advantage of this behavior,the color primaries red,green,and blue are rarely used for coding directly.Instead,color difference(chroma)signals similar to the ones just mentioned arecomputed.In component digital video,for example,the resulting color spaceis referred to as Y C B C R,where Y encodes luminance,C B the difference between blue primary and luminance,and C R the difference between redprimary and luminance(the primes are used here to emphasize the nonlinearnature of these quantities due to the above-mentioned gamma correction).The low chromatic acuity now permits a significant data reduction of thecolor difference signals,which is referred to as chroma subsampling.Thenotation commonly used is as follows:4:4:4denotes no chroma subsampling.4:2:2denotes chroma subsampling by a factor of2horizontally;thissampling format is used in the standard for studio-quality componentdigital video as defined by ITU-R Rec.601[29],for example.4:2:0denotes chroma subsampling by a factor of2both horizontallyand vertically;this sampling format is often used in JPEG or MPEGand is probably the closest approximation of actual visual color acuityachievable by chroma subsampling alone.4:1:1denotes chroma subsampling by a factor of4horizontally.3.3INTERLACINGAs analog television was developed,it was noted thatflicker could be per-ceived at certain frame rates,and that the magnitude of theflicker was a functionof screen brightness and surrounding lighting conditions.In a movie theaterat relatively low light levels,a motion picture can be displayed at a frame rate10of 24Hz,whereas a bright CRT display requires a refresh rate of more than 50Hz for flicker to disappear.The drawback of such a high frame rate is the high bandwidth of the signal.On the other hand,the spatial resolution of the visual system decreases significantly at such temporal frequencies (cf.Fig-ure 10.1).These two properties combined gave rise to a technique referred to as interlacing .The concept of interlacing is illustrated in Figure 10.2.Interlacing trades off vertical resolution with temporal resolution.Instead of sampling the video signal at 25or 30frames per second,the sequence is shot at a frequency of 50or 60interleaved fields per second.A field corresponds to either the odd or the even lines of a frame,which are sampled at different time instants and displayed alternately (the field containing the even lines is referred to as the top field,and the field containing the odd lines as the bottom field).Thus the required bandwidth of the signal can be reduced by a factor of 2,while the full horizontal and vertical resolution is maintained for stationary image regions,and the refresh rate for objects larger than one scanline is still sufficientlyhigh.1/2fFigure 10.2Illustration of interlacing.The top sequence is progressive;all lines of each frame are transmitted at the frame rate f .The bottomsequence is interlaced;eachframe is split in two fields con-taining the odd and the evenlines (shown in bold),respec-tively.These fields are trans-mitted alternately at twice theoriginal frame rate.MPEG-1handles only progressive video,which is better adapted to computer displays.MPEG-2on the other hand was designed as the new standard to transmit television signals.Therefore it was decided that MPEG-2would support both interlaced and progressive video.An MPEG-2bitstream can contain a progressive sequence encoded as a succession of frames,an interlaced sequence encoded as a succession of fields,or an interlaced sequence encoded as a succession of frames.In the latter case,each frame contains a top and a bottom field,which do not belong to the same time instant.Based on this,a variety of modes and combinations of motion prediction algorithms were defined in MPEG-2.Interlacing poses quite a problem in terms of vision modeling,especially from the point of view of temporal filtering.It is not only an implementationVision and Video:Models and Applications11 problem,but also a modeling problem,because identifying the signal that is actually perceived is not obvious.Vision models have often overlooked this issue and have taken simplistic approaches;most of them have restricted themselves to progressive input.Newer models incorporate de-interlacing approaches,which aim at creating a progressive video signal that has the spatial resolution of a frame and the temporal frequency of afield.A simple solution,which is still very close to the actual signal perceived by the human eye,consists in merging consecutivefields together into a full-resolution50or 60Hz signal.This is a valid approach as eachfield is actually displayed for twofield periods due to the properties of the CRT phosphors.Other solutions interpolate both spatially and temporally by upsampling thefields.Although the latter might seem more elegant,it feeds into the vision model a signal which is not the one that is being displayed.Reviews of various de-interlacing techniques can be found in[15,59].3.4ARTIFACTSThefidelity of compressed and transmitted video sequences is affected by the following factors:any pre-or post-processing of the sequence outside of the compression module.This can include chroma subsampling and de-interlacing,which were discussed briefly above,or frame rate conversion.One particular example is3:2pulldown,which is the standard way to convert progressive film sequences shot at24frames per second to interlaced video at30 frames per second.the compression operation itself.the transmission of the bitstream over a noisy channel.3.4.1Compression Artifacts.The compression algorithms used in var-ious video coding standards today are very similar to each other.Most of them rely on block-based DCT with motion compensation and subsequent quantiza-tion of the DCT coefficients.In such coding schemes,compression distortions are caused by only one operation,namely the quantization of the DCT coeffi-cients.Although other factors affect the visual quality of the stream,such as motion prediction or decoding buffer,these do not introduce any distortion per se,but affect encoding process indirectly by influencing the quantization scale factor.A variety of artifacts can be distinguished in a compressed video sequence:blockiness or blocking effect,which refers to a block pattern of size 8×8in the compressed sequence.This is due to the8×8block DCT quantization of the compression algorithm.12bad edge rendition:edges tend to be fuzzy due to the coarser quantization of high frequencies.mosquito noise manifests itself as an ambiguity in the edge direction:an edge appears in the direction conjugate to the actual edge.This effect is due to the implementation of the block DCT as a succession of a vertical and a horizontal one-dimensional DCT[9].jagged motion can be due to poor performance of the motion estimation.When the residual error of motion prediction is too large,it is coarsely quantized by the DCT quantization process.flickering appears when a scene has a high texture content.Texture blocks are compressed with varying quantization factors over time,which results in a visibleflickering effect.smoothing,loss of detail are typical artifacts of quantization.aliasing appears when the content of the scene is above the Nyquist rate, either spatially or temporally.An excellent survey of the various artifacts introduced by typical compres-sion schemes can be found in[79].3.4.2Transmission Errors.A very important and often overlooked source of distortions is the transmission of the bitstream over a noisy channel.Dig-itally compressed video is typically transferred over a packet network.The actual transport can take place over a wire or wireless,but some higher level protocol such as ATM or TCP/IP ensures the transport of the video stream. Most applications require the streaming of video,i.e.the bitstream needs to be transported in such a way that it can be decoded and displayed in real time. The bitstream is transported in packets whose headers contain sequencing and timing information.This process is illustrated in Figure10.3.Streams can also carry additional signaling information at the session level.A popular trans-port protocol at the moment is TCP/IP.A variety of protocols are then used to transport the audio-visual information.The real-time protocol(RTP)is used to transport,synchronize and signal the actual media and add timing information [51];RTP packets are transported over UDP.The signalling is taken care of by additional protocols such as the H.323family from the ITU[30],or the suite of protocols(SIP,SAP,SDP)from the Internet Engineering Task Force[50].A comparison of these schemes is provided in[11].Two different types of impairments can occur when transporting media over noisy channels.Packets can be lost due to excessive buffering in intermediate routers or switches,or they can be delayed to the point where they are not received in time for decoding.The latter is due to the queuing algorithm in。