wireshark练习及答案lab-protocol-layers
- 格式:docx
- 大小:1.56 MB
- 文档页数:13
以下是一些可能的Wireshark题目及其解答示例:1. 题目: 如何使用Wireshark捕获网络流量?解答:- 打开Wireshark应用程序。
- 在顶部菜单栏中选择 "Capture",然后选择 "Interfaces"。
- 在弹出的窗口中,选择你要捕获流量的网络接口。
- 点击 "Start" 开始捕获流量。
- 在捕获过程中,你可以暂停或停止捕获,也可以应用过滤器来筛选特定的流量。
- 捕获完成后,可以选择保存捕获的数据包以便后续分析。
2. 题目: 如何在Wireshark中过滤HTTP流量?解答:- 在Wireshark的主界面,点击顶部菜单栏的 "Filter",然后选择 "Apply a display filter..."。
- 在显示过滤器输入框中输入 "http",然后按回车键。
- 这样Wireshark就会只显示HTTP协议的相关数据包。
3. 题目: 如何在Wireshark中查找特定的字符串?解答:- 在Wireshark的主界面,点击顶部菜单栏的 "Edit",然后选择 "Find Packet..."。
- 在弹出的查找窗口中,选择 "String" 或 "Bytes",然后在搜索框中输入你要查找的字符串。
- 可以选择搜索的方向(向上或向下)和匹配的模式(精确匹配、包含匹配等)。
- 点击 "Find" 开始搜索,Wireshark会高亮显示匹配到的数据包。
4. 题目: 如何在Wireshark中分析TCP三次握手过程?解答:- 使用Wireshark捕获网络流量。
- 应用显示过滤器 "tcp.flags.syn == 1" 来只显示TCP SYN标志设置为1的数据包,这些数据包通常是TCP三次握手的第一步。
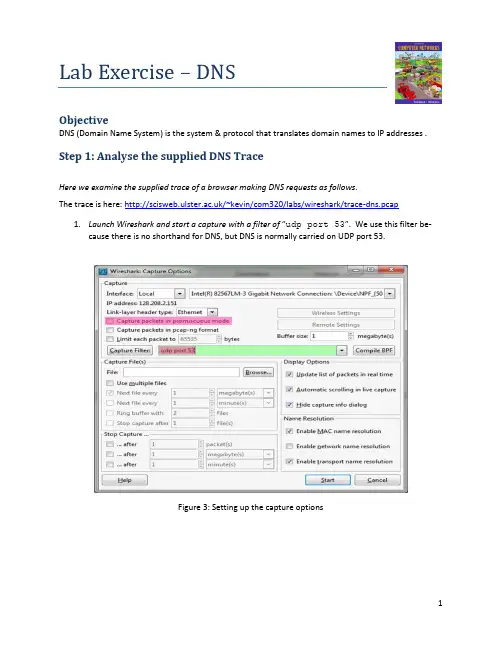
Lab Exercise – DNSObjectiveDNS (Domain Name System) is the system & protocol that translates domain names to IP addresses . Step 1: Analyse the supplied DNS TraceHere we examine the supplied trace of a browser making DNS requests as follows.The trace is here: /~kevin/com320/labs/wireshark/trace-dns.pcapunch Wireshark and start a capture with a filter of “udp port 53”.We use this filterbe-cause there is no shorthand for DNS, but DNS is normally carried on UDP port 53.Figure 3: Setting up the capture optionsStep 2: Inspect the TraceTo explore the details of DNS packets, select a DNS query expand its Domain Name System block (by us-ing the “+” expander or icon). Your display should be similar to the one shown in our figure, with a series of packets with protocol DNS.. We have selected the first DNS message.Figure 3: Trace of DNStraffic showing the details of the DNS headerLook for the following details:∙The DNS block follows the IP and UDP blocks. This is because DNS messages are carried in UDP segments within IP packets. You will see that the UDP port used by a nameserver is 53.∙The DNS header starts with a Transaction ID that is used to link a request and the corresponding reply – they both carry the same Transaction ID.∙Next come a set of flags that you can expand. They indicate whether the DNS message is a query or response, amongst other details.∙Then comethe number of query, answer, authority and additional records. These fields conclude the header.∙After the DNS header, the remainder of the message consists of the indicated number of query, answer, authority and additional records. Often there will be only one query – for the IP address of the domain name we are seeking – but there may be many of the other records. Theserecords are grouped in sections, such as the Authority section for all of the authority records.Each query has a Type code that indicates the kind of record sought, whether an IP address orotherwise. Each of the other recordsalso has a Type code that indicates whether it carries an IP address of a host, the name of a nameserver, or something else. The format of an individualrecord depends on its type. The entire DNS message is designed to fit within one UDP message.∙Wireshark may show other information, such as the number of the packet that carries the re-sponse to this request or the response time for the DNS exchange, but this is derived informa-tion. It is not actually carried on any packet.Repeat the above to look at a DNS response. You should see a larger set of records in this message; while DNS queries mostly serve to carry the query, DNS responses often return a set of useful information.Step 3: Details of DNS MessagesSelect the first DNS querypacket in your trace, with the first several packetscorresponding to earlier dig commands. To check, see if there are several queries that list the domain you chose in the Info column, each followed by a response.Look at the DNS header, and answer the following questions: (Answers on next page).1.How many bits long is the Transaction ID? Based on this length, take your best guess as to howlikely it is that concurrent transactions will use the same transaction ID.2.Which flag bit and what values signifies whether the DNS message is a query or response?3.How many bytes long is the entire DNS header? Use information in the bottom status line whenyou select parts of the packet and the bottom panel to help you work this out.Now examine the responses to DNS queries in the trace.The initial response should have provided another nameserver one step closer to the nameserver, but not the final answer. You should find that it includes the original query in its Query section. It will also include records with both the name of the nameservers to contact next, and the IP addresses of those nameservers. The final response in this se-ries will include the IP address of the domain name – this is the answer to the query.Look at the body of the DNS response messages, and answer the following questions: (answers overleaf)4.For the initial response, in what section are the names of the nameservers carried? What is theType of the records that carry nameserver names?5.Similarly, in what section are the IP addresses of the nameservers carried, and what is the Typeof the records that carry the IP addresses?6.For the final response, in what section is the IP address of the domain name carried?Answers to Step 3: Details of DNS Messages1.The Transaction ID is 16 bits long, which makes collisions unlikely,. Since the host computer issetting this value, it can use all 2^16 choices before repeating. This means that 2^16query/response pairs would need to be outstanding at the same time to cause a collision. For a normal computer, this is an extremely or implausibly high DNS workload.2.The first flag bit signifies query or response. A “0” indicates a query, and hence a “1” a response.3.The DNS header is 12 bytes long.4.The names of name servers are carried in the Authority section in an NS (NameServer) record.5.The IP addresses of the name servers are carried in the Additional section. The Type of record isA, for an IPv4 address, or AAAA for an IPv6 address.6.The IP address of the queried domain name is carried in the Answer section (in an A or AAAArecord.)Step 4: DNS Response TimeTo conclude this lab, we will look at the DNS response time of the DNS queries. This is a normal DNS usage, in which a computer sends a single query and receives the answer in the response. The response time is the delay between when the computer sends the query to the local nameserver and when it receives the response from the local nameserver. This time includes the time taken by the local name-server to contact remote nameservers, if the answer is not cached. Since this response time can delay connections to sites, it should be as small as possible.Proceed as follows to generate an “IO Graph” of the DNS response time s. IO graphs are a standard fea-ture of Wireshark available under the Statistics menu. By default, this graph shows the rate of packets over time. We will tweak it to show the DNS response time over the trace with the following changes: ∙On the x-axis, adjust the tick interval and pixels per tick for viewing. The tick interval should be small enough to see into the behavior over the trace.One second is probably a good choice foryour trace. The pixels per tick can be adjusted to make the graph wider or narrower to fill thewindow; you can also adjust the width of the window.∙On the y-axis, change the unit to be “Advanced”. The default is Packet/Tick. “Advanced” is a special keyword that will let us access different data values to graph. Once you select it, a new“Calc:” box will appear to let us specify the data values.∙Enter “dns.time” into the calculation box and set the pull-down menu to be“MAX(*)”.dns.time is a virtual field calculated by Wireshark from the query and responsemessages. It is shown with DNS responses, and gives the DNS response time. Choosing “MAX(*)”will let us see the largest DNS response time in every tick interval so that we can spot outliers.“AVG(*)” would also be a reasonable choice.∙Press Enter, and click the “Graph” button ifnecessary. You may need to do this to trigger a redis-play. You should now have a graph of response times similar to our graph in the figure below. We expect that you will see many small DNS response times, and a scattering of larger DNS response times. In our graph, most times are very small, likely because the correct answer is cached by the local nameserver. In some cases, however, there is a longer delay of hundreds of milliseconds as remote na-meservers must be queried. You can click a point on the graph to be taken to the nearest point in the trace if there is a feature you would like to investigate.Figure 4: DNS response time via an IO graphIf you look over the DNS traffic caused by your browser, you are likely to see a greater range of beha-viors than in the DNS traffic caused by the dig commands. This behavior might include new types of records, such as CNAME (canonical name, to provide information about aliases when one machine is known by multiple names), answers that indicate that a name does not exist, and so forth. Explore Your NetworkWe encourage you to explore DNSon your own once you have completed this lab. Some ideas:∙Look up other types of DNS records, such as MX to find the mail server for a domain, and AAAA to find the IPv6 address of a domain.∙Google provides an alternate DNS nameserver system that you may use called “Google P ublic DNS”. Look it up, and follow the configuration instructions to test it out. Experiment to see ifthis DNS service is faster than your existing DNS arrangement.。
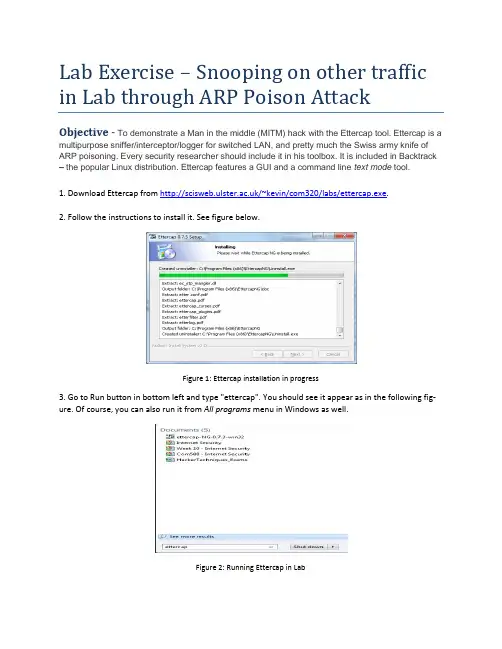
Lab Exercise – Snooping on other traffic in Lab through ARP Poison AttackObjective - To demonstrate a Man in the middle (MITM) hack with the Ettercap tool.Ettercap is a multipurpose sniffer/interceptor/logger for switched LAN, and pretty much the Swiss army knife of ARP poisoning. Every security researcher should include it in his toolbox. It is included in Backtrack – the popular Linux distribution. Ettercap features a GUI and a command line text mode tool.1. Download Ettercap from /~kevin/com320/labs/ettercap.exe.2. Follow the instructions to install it. See figure below.Figure 1: Ettercap installation in progress3. Go to Run button in bottom left and type "ettercap". You should see it appear as in the following fig-ure. Of course, you can also run it from All programs menu in Windows as well.Figure 2: Running Ettercap in Lab4. Next select Unified Sniffing from the Sniff menu option as show in figure 3.Figure 3: Step 1 in process of snooping5. Select the first Etternet interface (in this case it is “eXtreme Gigabit Ethernet Driver” network interface (see figure 4).Figure 4: Selection of network interface1.Next you should be presented with a series of menu options including Start, Targets, Hosts, ViewMitm, Filters, Logging and Plugins. You should select the Hosts option and choose Scan for Hosts.See figure 5.Figure 5: Selection of hosts to scan on LAN2.Once you select Scan for hosts, you should see a pop up window displaying the progess when all255 hosts on the local network are scanned. See figure 6.Figure 6: Hosts being scanned locally3.Next you should select Hosts List from the Hosts menu. You should then see a screen similar tofigure 7 with a list of hosts that have been found.Figure 7: Hosts that were scanned locally4.Please ask permission from a colleague to allow you to select their computer to be scanned.They should confirm their IP address to you. That can be found as in previous weeks by typing cmd in the windows start menu and opening a command prompt. Then in the command prompt, type ipconfig and note the ipv4 address displayed. You may need to scroll up to see it in the command prompt window. Here in figure 8, host 193.61.190.73 is being selected for scanning.Figure 8: host 193.61.190.73 is being selected for scanning5.Once you have the target selected with your mouse, then select the Add to Target 1 button. Seefigure 9.Figure 9: host 193.61.190.73 is being added to Target 1.6.Select the Targets menu option and then select C urrent Targets as shown in figure 10.Figure 10: Targets being selected7.Now you should only see your class mates computer shown as in figure 11.Figure 11: host selected for attack8.Now go to the mitm option as show in figure 12. Select Arp poisoning.Figure 12: ARP Poisoning selection9.Once Arp poisoning is selected, you will be presented with the dialogue window as shown in fig-ure 13. Simply click OK.Figure 13: Options for ARP poison attack10.You will then be presented with a window once again which is similar to figure 14. The ARP poi-son attack however is happening underneath. You now have access to all the traffic which is be-ing routed to the IP address which you have entered earlier. We will now move to Wireshark to see the power of an ARP poison mitm attack.Figure 14: Main window after attack has been started11.Open Wireshark by typing wireshark at the run programs option. You will then select the usualEtternet Intel Interface and Start a capture. In the display filter, type the following:ip.src==yourfriendsipaddress&&tcp.port==80 e.g. ip.src==193.61.191.88 &&tcp.port==80. See figure 15.Figure 15: Sample scan of web traffic on IP address 193.61.191.8812.Get your friend to browse to any site. In this example below, I have gone to a CNN page whichdiscusses Coca-Cola remarks from the CEO. It is at/2013/02/05/business/coke-ceo-muhtar-kent-capitalism-evolve/Figure 16: Sample page surfed.13.Once your friend has started to surf, you should start to see a lot of HTTP and TCP packets ap-pear in your packet list window. After some time you can stop the capture. You may also choose to stop the mitm attack. You can always resume the attack to see ‘fresh’ traffic remotely. You should then select the page that he surfed through e.g. CNN and right click on it as displayed be-low and select Follow TCP Stream.Figure17: Sample page from CNN being selected in the Wireshark interface. Note the ip address and port filtering14.The TCP Follow Stream should lead you to a window such as displayed below. Note the contentsof the GET and HOST on the first two lines. When we put them together we get the location of the site visited which is /2013/02/05/business/coke-ceo-muhtar-kent-capitalism-evolve/. This should now show you that all surfing can be snooped on a LAN.Figure18: CNN page after selecting Follow TCP Stream20.Now get your friend to go to a site which requires a login or passing information such as cnnweather at: /weather. Here type a city such as Belfast:21. Next, examine the wireshark tr ace, you should see a captured packet with “cit y-Search/json/true HTTP/1.1” showing the ‘sensitive data’.22.Finally, please return to the ettercap program and select Mitm and click on Stop mitm attack(s).This will ensure that the ARP tables return to normal and no unnecessary snooping of a newco-mer to your friend’s machine takes place. See figure 19.Figure19: Stopping the man in the middle ARP attack23.The following popup windows should confirm that all man in the middle attacks have stopped.People are now safe again in the lab.Figure 20: Confirmation of mitm attack being stopped.24.Finally, you can exit the program.Figure 21: Ensuring you exit the attack vector programPlease be responsible with this new knowledge……。
1.What is the IP address and TCP port number used by the clientcomputer (source) that is transferring the file to ?Ip address 192.168.1.36TCP port number:19572.What is the IP address of ? On what port numberis it sending and receiving TCP segments for this connection?the IP address of :128.119.245.12port number:803.What is the sequence number of the TCP SYN segment that is usedto initiate the TCP connection between the client computer and ? What is it in the segment that identifies the segment as a SYN segment?sequence number:0syn 被设置为1说明是syn段4.What is the sequence number of the SYNACK segment sent bygaia.cs.umass.ed to the client computer in reply to the SYN? What is the value of the ACKnowledgement field in the SYNACK segment?How did determine that value? What is it in the segment that identifies the segment as a SYNACK segment?The sequence number of the SYNACK segment sent by is:0SYNACK segment 中ACKnowledgement 的值为1;ACKnowledgement number的值为SYN消息中sequencenumber加上1所得;SYN 和Acknowledgement f都置为1说明这是一个SYNACK segment.5.What is the sequence number of the TCP segment containing theHTTP POST command?第11号报文段是包含HTTP POST 命令的TCP segment。
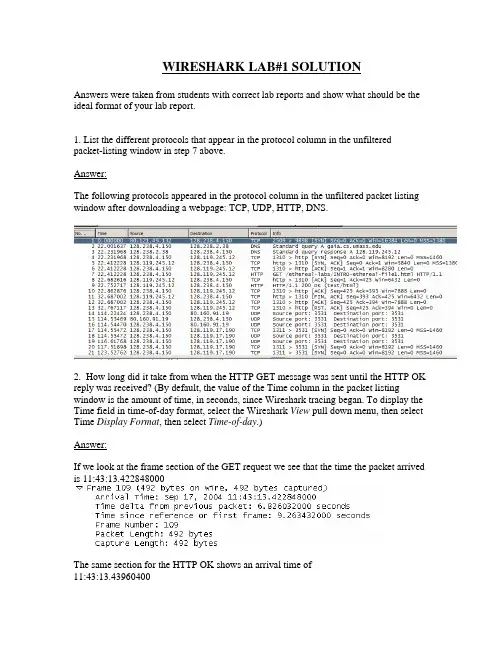
WIRESHARK LAB#1 SOLUTIONAnswers were taken from students with correct lab reports and show what should be the ideal format of your lab report.1. List the different protocols that appear in the protocol column in the unfiltered packet-listing window in step 7 above.Answer:The following protocols appeared in the protocol column in the unfiltered packet listing window after downloading a webpage: TCP, UDP, HTTP, DNS.2. How long did it take from when the HTTP GET message was sent until the HTTP OK reply was received? (By default, the value of the Time column in the packet listing window is the amount of time, in seconds, since Wireshark tracing began. To display the Time field in time-of-day format, select the Wireshark View pull down menu, then select Time Display Format, then select Time-of-day.)Answer:If we look at the frame section of the GET request we see that the time the packet arrived is 11:43:13.422848000The same section for the HTTP OK shows an arrival time of11:43:13.43960400The difference of these 2 times gives.43960400 - .426032000 = 0.013572 seconds3. What is the Internet address of the (also known as)? What is the Internet address of your computer?Answer:If we look at the IP section of the GET request, the source and destination are shownThe source is the local machine’s address and the destination is the web server’s public My (local machine’s) address = 128.238.244.28IP address 128.119.245.12 = .This can also be seen during the DNS query4. Print the two HTTP messages displayed in step 9 above. To do so, select Print from the Wireshark File command menu, and select “Selected Packet Only” and “Print as displayed” and then click OK.Answer:Here is the information for the HTTP GET and OK packets:HTTP GET:Frame 4 (862 bytes on wire, 862 bytes captured)Ethernet II, Src: Netgear_61:8e:6d (00:09:5b:61:8e:6d), Dst: WestellT_9f:92:b9(00:0f:db:9f:92:b9)Internet Protocol, Src: 192.168.1.46 (192.168.1.46), Dst: 128.119.245.12(128.119.245.12)Transmission Control Protocol, Src Port: 1474 (1474), Dst Port: http (80), Seq: 1, Ack: 1, Len: 808Hypertext Transfer ProtocolGET /wireshark-labs/INTRO-wireshark-file1.html HTTP/1.1\r\nHost: \r\nUser-Agent: Mozilla/5.0 (Windows; U; Windows NT 5.1; en-US; rv:1.8.1.4)Gecko/20070515 Firefox/2.0.0.4\r\nAccept:text/xml,application/xml,application/xhtml+xml,text/html;q=0.9,text/plain;q=0.8,im age/png,*/*;q=0.5\r\nAccept-Language: en-us,en;q=0.5\r\nAccept-Encoding: gzip,deflate\r\nAccept-Charset: ISO-8859-1,utf-8;q=0.7,*;q=0.7\r\nKeep-Alive: 300\r\nConnection: keep-alive\r\nHTTP OK:Frame 6 (439 bytes on wire, 439 bytes captured)Ethernet II, Src: WestellT_9f:92:b9 (00:0f:db:9f:92:b9), Dst: Netgear_61:8e:6d(00:09:5b:61:8e:6d)Internet Protocol, Src: 128.119.245.12 (128.119.245.12), Dst: 192.168.1.46(192.168.1.46)Transmission Control Protocol, Src Port: http (80), Dst Port: 1474 (1474), Seq: 1, Ack: 809, Len: 385Hypertext Transfer ProtocolHTTP/1.1 200 OK\r\nDate: Thu, 07 Jun 2007 18:09:01 GMT\r\nServer: Apache/2.0.52 (CentOS)\r\nLast-Modified: Thu, 07 Jun 2007 18:08:01 GMT\r\nETag: "d6c69-50-cb94a240"\r\nAccept-Ranges: bytes\r\nContent-Length: 80Keep-Alive: timeout=10, max=100\r\nConnection: Keep-Alive\r\nContent-Type: text/html; charset=ISO-8859-1\r\n\r\nLine-based text data: text/html。
Lab Exercise – UDPObjectiveTo look at the details of UDP (User Datagram Protocol). UDP is a transport protocol used throughout the Internet as an alternative to TCP when reliability is not required. It is covered in §6.4 of your text. Re-view that section before doing this lab.The trace file is here: /~kevin/com320/labs/wireshark/trace-udp.pcapStep 1: Capture a TraceThere are many ways to cause your computer to send and receive UDP messages since UDP is widely used as a transport protocol. The easiest options are to:•Do nothing but wait for a while. UDP is used for many “system protocols” that typically run in the background and produce small amounts of traffic, e.g., DHCP for IP address assignment and NTP for time synchronization.•Use your browser to visit sites. UDP is used by DNS for resolving domain names to IP addresses, so visiting fresh sites will cause DNS traffic to be sent. Be careful not to visit unsafe sites; pickrecommended sites or sites you know about but have not visited recently. Simply browsing the web is likely to cause a steady stream of DNS traffic.•Start up a voice-over-IP call with your favorite client. UDP is used by RTP, which is the protocol commonly used to carry media samples in a voice or video call over the Internet.Proceed as follows to capture a trace of UDP traffic; alternatively, you may use a supplied trace:unch Wireshark and start a capture with a filter of “udp“.Figure 1: Setting up the capture options2.When the capture is started, perform some activities that will generate UDP traffic. We de-scribed several options above, e.g., browse the web or start a short VoIP call.3.Wait a little while (say 60 seconds) after you have stopped your activity to also observe anybackground UDP traffic. It is likely that you will observe a trickle of UDP traffic because system activity often uses UDP to communicate. We want to see some of this activity.e the Wireshark menus or buttons to stop the capture. You should now have a trace with pos-sibly many UDP packets. Our example is shown below. We have selected a packet and expand-ed the detail of the UDP header.Figure 2: Trace of UDP traffic showing the details of the UDP headerStep 2: Inspect the TraceDifferent computers are likely to capture different kinds of UDP traffic depending on the network setup and local activity. Observe that the protocol column is likely to show multiple protocols, none of which is UDP. This is because the listed protocol is an application protocol layered on top of UDP. Wireshark gives the name of the application protocol, not the (UDP) transport protocol unless Wireshark cannot determine the application protocol. However, even if the packets are listed as an application protocol, they will have a UDP protocol header for us to study, following the IP and lower-layer protocol headers. Select different packets in the trace (in the top panel) and browse the expanded UDP header (in the mid-dle panel). You will see that it contains the following fields:•Source Port, the port from which the UDP message is sent. It is given as a number and possibly a text name; names are given to port values that are registered for use with a specific application.•Destination Port. This is the port number and possibly name to which the UDP message is des-tined. Ports are the only form of addressing in UDP. There computer is identified using the IPaddress in the lower IP layer.•Length. The length of the UDP message.•Checksum. A checksum over the message that is used to validate its contents. Is your checksum carrying 0 and flagged as incorrect for UDP messages sent from your computer? On some com-puters, the operating system software leaves the checksum blank (zero) for the NIC to compute and fill in as the packet is sent. This is called protocol offloading. It happens after Wireshark sees the packet, which causes Wireshark to believe that the checksum is wrong and flag it with a dif-ferent color to signal a problem. You can remove these false errors if they are occurring by tell-ing Wireshark not to validate the checksums. Select “Preferences” from the Wireshark menusand expand the “Protocols” area. Look under the list until you come to UDP. Uncheck “Validate checksum if possible”.That is it. The UDP header has different values for different messages, but as you can see, it is short and sweet. The remainder of the message is the UDP payload that is normally identified the higher-layer pro-tocol that it carries, e.g., DNS, or RTP.Step 3: UDP Message StructureTo check your understanding of UDP, you should sketch a figure of the UDP message structure as you ob-served. It should show the position of the IP header, UDP header, and UDP payload. Within the UDP header, show the position and size of each UDP field you can observe using Wireshark. Your figure can simply show the message as a long, thin rectangle.Try not to look at the figure of a UDP segment in the answer on next page. To work out sizes, observe that when you click on a protocol block in the middle panel (the block itself, not the “+” expander) then Wireshark will highlight the bytes it corresponds to in the packet in the lower panel and display the length at the bottom of the window.By looking at the details of the UDP messages in your trace, answer these questions:1.What does the Length field include? The UDP payload, UDP payload and UDP header, or UDPpayload, UDP header, and lower layer headers?2.How long in bits is the UDP checksum?3.How long in bytes is the entire UDP header?(Please note that answers are on next page).Solutions – Step 3 UDP Message StructureFigure 1: Structure of a UDP messageThis drawing shows the same UDP header fields as in the book in a slightly different format and with lengths given in bytes, not bits. It also shows the relation of the IP header and UDP payload to the UDP header.The answers to the questions are:1.The Length field gives the length of the UDP payload plus the UDP header.2.The checksum is 16 bits long.3.The UDP header is 8 bytes long.[END]Step 4: UDP UsageTo complete our understanding of UDP, we will look at how UDP is used in practice as a transport by ap-plications. Beginning with IP, the next lower protocol layer, there are several issues we can consider. A first issue is how IP knows that the next higher protocol layer is UDP. The answer is that there is a Proto-col field in the IP header that contains this information.1.Give the value of the IP Protocol field that identifies the upper layer protocol as UDP.A second issue is how UDP messages are typically addressed at the IP layer. You might be surprised to find UDP messages in your trace that neither come from your computer or are sent only to your com-puter. You can see this by sorting on the Source and Destination columns. The source and destinations will be domain names, if Network layer name resolution is turned, and otherwise IP addresses. (You can toggle this setting using the View menu and selecting Name resolution.) You can find out the IP address of your computer using the “ipconfig” command (Windows).The reason you may find UDP messages without your com puter’s IP address as either the source or des-tination IP address is that UDP is widely used as part of system protocols. These protocols often send messages to all local computers who are interested in them using broadcast and multicast addresses. In our traces, we find DNS (the domain name system), MDNS (DNS traffic that uses IP multicast), NTP (for time synchronization), NBNS (NetBIOS traffic), DHCP (for IP address assignment), SSDP (a service discov-ery protocol), STUN (a NAT traversal protocol), RTP (for carrying audio and video samples), and more. Your trace may have other protocols you have not heard about; it is OK, as there are a lot of protocols out there. You can look them up on the web for fun.2.Examine the UDP messages and give the destination IP addresses that are used when your com-puter is neither the source IP address nor the destination IP address. (If you have only your com-puter as the source or destination IP address then you may use the supplied trace.)Finally, let us look at the lengths of typical UDP messages. We know that UDP messages can be as large as roughly 64Kbytes. But as you browse you should see that most UDP messages are much shorter than this maximum, so that UDP messages fit in a single packet.3.What is the typical size of UDP messages in your trace?(Please note that answers are on next page).Solutions to Step 4: UDP UsageThe answers to the questions are:1.The IP Protocol field value of 17 indicates UDP.2. A variety of broadcast and multicast addresses may be found. These include the Internet broad-cast address of 255.255.255.255, subnet broadcast addresses such as 192.168.255.255 (where the 192.168 portion is the subnet number and the .255.255 portion means broadcast), and mul-ticast IP addresses such as 224.0.xx.xx (such as 224.0.0.251 for multicast DNS).3.This answer will vary with your trace. Most often they are a few hundred bytes or less, and oftenmay be around 100 bytes. That is, many messages are relatively short packets.。
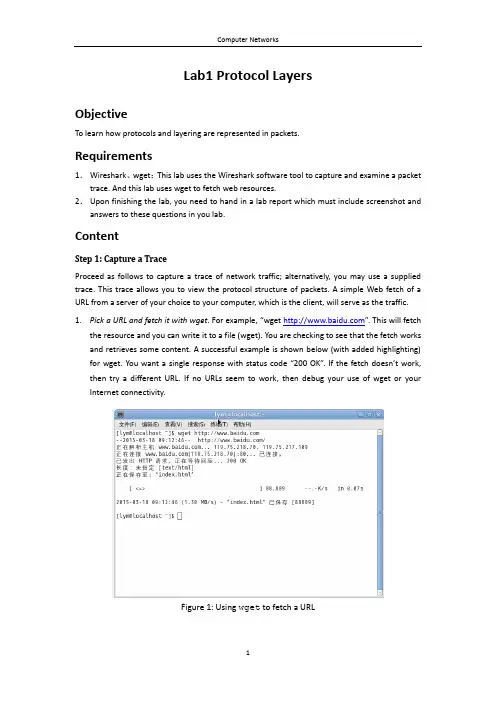
Lab1 Protocol LayersObjectiveTo learn how protocols and layering are represented in packets.Requirements1.Wireshark、wget:This lab uses the Wireshark software tool to capture and examine a packet trace. And this lab uses wget to fetch web resources.2.Upon finishing the lab, you need to hand in a lab report which must include screenshot and answers to these questions in you lab.ContentStep 1: Capture a TraceProceed as follows to capture a trace of network traffic; alternatively, you may use a supplied trace. This trace allows you to view the protocol structure of packets. A simple Web fetch of a URL from a server of your choice to your computer, which is the client, will serve as the traffic.1.Pick a URL and fetch it with wget. For example, “wget ”. This will fetchthe resource and you can write it to a file (wget). You are checking to see that the fetch works and retrieves some content. A successful example is shown below (with added highlighting) for wget. You want a single response with status c ode “200 OK”. If the fetch doesn’t work, then try a different URL. If no URLs seem to work, then debug your use of wget or your Internet connectivity.Figure 1: Using wget to fetch a URL2.Close unnecessary browser tabs and windows. By minimizing browser activity, you will stopyour computer from fetching unnecessary web content, thus avoiding incidental traffic in the trace.unch Wireshark and start a capture with a filter of “tcp port 80”and check “enablenetwork name resolution”.This filter will record only standard web traffic without other kinds of packets that your computer may send. The checking will translate the addresses of the computers sending and receiving packets into names, which should help you recognizing whether the packets are going to or from your computer.Figure 2: Setting up the capture options4.When the capture is started, repeat the web fetch using wget/curl above. This time, thepackets will be recorded by Wireshark as the content is being transferred.5.After the fetch is successful, return to Wireshark and use the menus or buttons to stop thetrace. If you have succeeded, the upper Wireshark window will show multiple packets, and it will most likely be full. How many packets are captured will depend on the size of the web page, but there should be at least 8 packets in the trace, and typically 20-100, and many ofthese packets will be colored green. An example is shown below. Congratulations, you have captured a trace!Figure 3: Packet trace of wget trafficStep 2: Inspect the TraceSelect a packet for which the Protocol column is “HTTP” and the Info column says it is a GET. It is the packet that carries the web (HTTP) request sent from your computer to the server. You can click the column headings to sort by that value although it should not be difficult to find an HTTP packet by inspection. Take a closer look to see how the packet structure reflects the protocols that are in use.Since we are fetching a web page, we know that the protocol layers being used are as shown below. That is, HTTP is the application layer web protocol used to fetch URLs. Like many Internet applications, it runs on top of the TCP/IP transport and network layer protocols. The link and physical layer protocols depend on your network, but are typically combined in the form of Ethernet (shown) if your computer is wired or 802.11 (not shown) if your computer is wireless.Figure 4: Protocol stack for a web fetchHTTPTCPIPEthernet ClientServer HTTP TCP IP EthernetpacketWith the HTTP GET packet selected, look closely to see the similarities and differences between it and our protocol stack as described next. The protocol blocks are listed in the middle panel. You can expand each block (by cl icking on the “+” expander or icon) to see its details.∙The first Wireshark block is “Frame”. This is not a protocol. It is a record that describes overall information about the packet including when it was captured and how many long it has in terms of the number of bits.∙The second block is “Ethernet”. This mat ches our diagram! Note that you may have taken a trace on a computer using 802.11 yet still see an Ethernet block instead of an 802.11 block.Why? It happens because we asked Wireshark to capture traffic in Ethernet format on the capture options. Therefore, Wireshark converted the real 802.11 header into a pseudo-Ethernet header.∙Then come IP, TCP and HTTP, which are just as we wanted. Note that the order is from the bottom of the protocol stack upwards. This is because as packets are passed down the stack, the header information of the lower layer protocol is added to the front of the information from the higher layer protocol, as in Fig. 1-15 of your text. That is, the lower layer protocols come firs t in the packet “on the wire”.Now, find another HTTP packet, i.e., the response from the server to your computer, and look at the structure of this packet for the differences compared to the HTTP GET packet.This packet should have “200 OK” in the Info fi eld, denoting a successful fetch. In our trace, there are two extra blocks in the detail panel as seen in the next figure.∙The first extra block says “[11 reassembled TCP segments …]”. Details in your capture will vary, but this block is describing more than the packet itself. Most likely, the web response was sent across the network as a series of packets that were put together after they arrived at the computer. The packet labeled HTTP is the last packet in the web response, and the block lists packets that are joined together to obtain the complete web response. Each of these packets is shown as having protocol TCP even though the packets carry part of an HTTP response. Only the final packet is shown as having protocol HTTP when the complete HTTP message may be understood, and it lists the packets that are joined together to make the HTTP response.∙The second extra block says “Line-based text data …”. Details in your capture will vary, but this block is describing the contents of the web page that was fetched. In our case it is of type text/html, though it could easily have been text/xml, image/jpeg, or many other types. As with the Frame record, this is not a true protocol. Instead, it is a description of packet contents that Wireshark is producing to help us understand the network traffic.Figure 5: Inspecting a HTTP “200 OK” responseStep 3: Packet StructureTo show your understanding of packet structure, draw a figure of an HTTP GET packet that shows the position and size in bytes of the TCP, IP and Ethernet protocol headers. Your figure can simply show the overall packet as a long, thin rectangle. Leftmost elements are the first sent on the wire. On this drawing, show the range of the Ethernet header and the Ethernet payload that IP passed to Ethernet to send over the network. To show the nesting structure of protocol layers, note the range of the IP header and the IP payload. You may have questions about the fields in each protocol as you look at them. We will explore these protocols and fields in detail in future labs. To work out sizes, observe that when you click on a protocol block in the middle panel (the block itself, not the “+” expander), then Wireshark will highlight the bytes it corresponds to in the packet in the lower panel and display the length at the bottom of the window. For instance, clicking on the IP version 4 header of a packet in our trace should show that the length is 20 bytes. (Your trace will be different if it is IPv6, and may be different even with IPv4 depending on various options.) You may also use the overall packet size shown in the Length column or Frame detail block.Turn-in: Hand in your packet drawing.Step 4: Protocol OverheadEstimate the download protocol overhead or percentage of the download bytes taken up by protocol overhead.To do this, consider HTTP data (headers and message) to be useful data for the network to carry and lower layer headers (TCP, IP and Ethernet) to be the overhead. We would like this overhead to be small so that most bits are used to carry content that applicationscare about. To work this out, first, look at only the packets in the download direction for a single web fetch. You might sort on the Destination column to find them. The packets should start with a short TCP packet described as a SYN ACK which is the beginning of a connection. They will be followed by mostly longer packets in the middle (roughly 1 to 1.5KB) of which the last one is an HTTP packet. This is the main portion of the download. And they will likely end with a short TCP packet that is part of ending the connection. For each packet, you can inspect how much overhead it has in the form of Ethernet/IP/TCP headers and how much useful HTTP data it carries in the TCP payload. You may also look at the HTTP packet in Wireshark to learn how much data there is in the TCP payloads over all download packets.Turn-in: Your estimate of download protocol overhead as defined above. Tell us whether you find this overhead to be significant.Step 5: Demultiplexing KeysWhen an Ethernet frame arrives at a computer, the Ethernet layer must hand the packet that it contains to the next higher layer to be processed. The act of finding the right higher layer to process received packets is called demultiplexing. We know that in our case the higher layer is IP. But how does the Ethernet protocol know this? After all, the higher-layer could have been another protocol entirely (such as ARP). We have the same issue at the IP layer, i.e., IP must be able to determine that the contents of IP message is a TCP packet so that it can hand it to the TCP protocol to be processed. The answer is that protocols use information in their header known as a “demultiplexing key” to determine the higher layer.Look at the Ethernet and IP headers of a download packet in detail to answer the following questions:1.Which Ethernet header field is the demultiplexing key that tells it that the next higher layer isIP? What value is used in this field to indicate “IP”?2.Which IP header field is the demultiplexing key that tells it that the next higher layer is TCP?What value is used in this field to indicate “TCP”?Turn-in: Hand in your answers to the above questions.Explore on your ownWe encourage you to explore protocols and layering once you have completed this lab. Some ideas:∙Look at a short TCP packet that carries no higher-layer data. To what entity is this packet destined? After all, if it carries no higher-layer dat a then it doesn’t seem to be very useful toa higher layer protocol such as HTTP!∙In a classic layered model, one message from a higher layer has a header appended by the lower layer to make it a new message. But this is not always the case. Above, we saw a trace in which the web response (one HTTP message that is comprised of an HTTP header and an HTTP payload) was converted into multiple lower layer messages (multiple TCP packets).Imagine that you have drawn the packet structure (as seen in Step 2) for the first and last TCP packet carrying the web response. How will the drawings differ?∙In a classic layered model, lower layers append headers to the messages passed down from higher layers. How will this model change if a lower layer adds encryption?∙In a classic layered model, lower layers append headers to the messages passed down from higher layers. How will this model change if a lower layer adds compression?。
Lab 3 Wireshark Lab: TCP STEPS• Start up your web browser. Go the and retrieve an ASCII copy of Alice in Wonderland. Store this file somewhere on your computer.• Next go to•Use the Browse button in this form to enter the name of the file (full path name) on your computer containing Alice in Wonderland (or do so manually). Don’t yet press the “Upload file” button.•Now start up Wireshark and begin packet capture (Capture->Options) and then press OK on the Wireshark Packet Capture Options screen (we’ll not need to select any options here).•Returning to your browser, press the “Upload file” button to upload the file to the server. Once the file has been uploaded, a short congratulations message will be displayed in your browser window.• Stop Wireshark packet capture.•First, filter the packets displayed in the Wireshark window by entering “tcp” (lowercase, no quotes, and don’t forget to press return after entering!) into the display filter specification window towards the top of the Wireshark window.QUESTIONS1. What is the IP address and TCP port number used by the client computer (source) that is transferring the file to To answer this question, it’s probably easiest to select an HTTP message and explore the details of the TCP packet used to carry this HTTP message, using the “details of the selected packet header window”. The IP address is The TCP port number is 1161.2. What is the IP address of On what port number is it sending and receiving TCP segments for this connectionThe IP address is The TCP port number is 80.3. What is the IP address and TCP port number used by your client computer (source) to transfer the file to IP address is The TCP port number is 51458.4. What is the sequence number of the TCP SYN segment that is used to initiate the TCP connection between the client computer and What is it in the segment that identifies the segment as a SYN segmentThe sequence number of the TCP SYN segment is 0. The SYN flag is set to 1 identifies the segment as a SYN segment.5. What is the sequence number of the SYNACK segment sent by to the client computer in reply to the SYN What is the value of the ACKnowledgement field in the SYNACK segment How did determine that value What is it in the segment that identifies the segment as a SYNACK segmentThe sequence number of the SYNACK segment sent by is 0. The value of the Acknowledgement field in the SYNACK segment is 1. The value is adding 1 to the initial sequence number of SYN segment. The SYN flag and Acknowledgement flag in the segment are set to 1 identifies the segment as a SYNACK segment.6. What is the sequence number of the TCP segment containing the HTTP POST command Note that in order to find the POST command, you’ll need to dig into the packet content field at the bottom of the Wireshark window, looking for a segment with a “POST” within its DATA field.The sequence number of the TCP segment containing the HTTP POST command is 1.7. Consider the TCP segment containing the HTTP POST as the first segment in the TCP connection. What are the sequence numbers of the first six segments in the TCP connection (including the segment containing the HTTP POST) At what time was each segment sent When was the ACK for each segment received Given the difference between when each TCP segment was sent, and when its acknowledgement was received, what is the RTT value for each of the six segments What is the EstimatedRTT value (see page 249 in text) after the receipt of each ACK Assume that the value of the EstimatedRTT is equal to the measured RTT for the first segment, and then is computed using the EstimatedRTT equation on page 249 for all subsequent segments.Note: Wireshark has a nice feature that allows you to plot the RTT for each of the TCP segments sent. Select a TCP segment in the “listing of captured packets”window that is being sent from the client to the server. Then select: Statistics->TCP Stream Graph- >Round Trip Time Graph.We can get table 1:Table 1Then, we can get table 2 form table 1. Table 26EstimatedRTT after the receipt of the ACK of segment 1:EstimatedRTT= sEstimatedRTT after the receipt of the ACK of segment 2:EstimatedRTT=*+*= sEstimatedRTT after the receipt of the ACK of segment 3:EstimatedRTT=*+*= sEstimatedRTT after the receipt of the ACK of segment 4:EstimatedRTT=*+*= sEstimatedRTT after the receipt of the ACK of segment 5:EstimatedRTT=*+*= sEstimatedRTT after the receipt of the ACK of segment 6:EstimatedRTT=*+*= s8. What is the length of each of the first six TCP segmentsAccording to Table 1, we can get that the first TCP segment’s length is 565 bytes. The other 5 is 1460 bytes.9. What is the minimum amount of available buffer space advertised at the received for the entire trace Does the lack of receiver buffer space ever throttle the sender The minimum amount of available buffer space advertised at the received for the entire trace is 5840 bytes. We can see that the sender is never throttle because of the lack of receiver buffer space.10. Are there any retransmitted segments in the trace file What did you check for (in the trace) in order to answer this questionThere aren’t any retransmitted segments in the trace file. We can check the Time-Sequence-Graph (S tevens). In the graph, there aren’t two dots in the same y-line.11. How much data does the receiver typically acknowledge in an ACK Can you identify cases where the receiver is ACKing every other received segment (see Table on page 257 in the text).The receiver typically acknowledge 1460 bytes in an ACK.80th is ACKing every other received segment. It acks 76th and 77th two segment.12. What is the throughput (bytes transferred per unit time) for the TCP connection Explain how you calculated this value.The last segment’s sequence number is 164091. So the total data is 164091-1=164090 bytes. The whole time is – = s. So the throughput is 164090/= KB/sec.STEPS•Select a TCP segment in the Wireshark’s “listing of captured-packets” window. Then select the menu : Statistics->TCP Stream Graph-> Time-Sequence-Graph(Stevens). You should see a plot that looks similar to the following plot, which was created from the captured packets in the packet trace tcp-etherealtrace-1 in QUESTIONS13. Use the Time-Sequence-Graph(Stevens) plotting tool to view the sequence number versus time plot of segments being sent from the client to the server. Can you identify where TCP’s slowstart phase begins and ends, and where congestion avoidance takes over Comment on ways in which the measured data differs from the idealized behavior of TCP that we’ve studied in the text.TCP slow start begins at the start of the connection. So when the HTTP POST segment is sent out, the slow start begins. But if we want to identify w here TCP’s slow start phase ends and where congestion avoidance takes over, we have to know the value of congestion window size of this sender. Sadly, we can’t get the value directly. All we can do is to estimate it by the amount of data without acknowledgement. Becausewe know that LastByteSend –LastbyteAcked <= min{ CongWin, RcvWin} and the RcvWin is large enough. But even we get the lower bound of the TCP window size, it is still hard to identify where TCP’s slow start phase ends and where congestion avo idance takes over. After all, the amount of data without acknowledgement doesn’t equal to the value of congestion window size.The idealized behavior of TCP that we’ve studied in the te xt: TCP sender will try to send more data. When it get an ACK, it will send more data. But once congestion happened, the Congwin will drop down to a half. But in practice, TCP behavior also depends on the application. For example, i n some web applications, the web object’s size is very small. So before the end of slow start, the transmission is over. Then we will get a long delay and a small throughput.14. Answer each of two questions above for the trace that you have gathered whenyou transferred a file from your computer to slow start begins at the start of the connection. So when the HTTP POST segment is sent out, the slow start begins. But if we want to identify where TCP’s slow start phase ends and where congestion avoidance takes over, we have to know the value of congestion window size of this sender. Sadly, we c an’t get the value directly. All we can do is to estimate it by the amount of data without acknowledgement. Because we know that LastByteSend –LastbyteAcked <= min{ CongWin, RcvWin} and the RcvWin is large enough. But even we get the lower bound of the TCP window size, it is still hard to identify where TCP’s slow start phase ends and where congestion avoidance takes over. After all, the amount of data without acknowledgement doesn’t equal to the value of congestion window size.The idealized behavior of TC P that we’ve studied in the text: TCP sender will try to send more data. When it get an ACK, it will send more data. But once congestion happened, the Congwin will drop down to a half. But in practice, TCP behavior also depends on the application. For exam ple, in some web applications, the web object’s size is very small. So before the end of slow start, the transmission is over. Then we will get a long delay and a small throughput.。
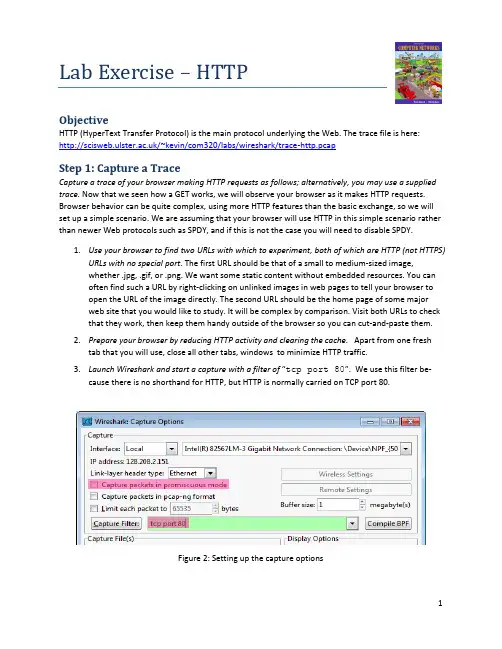
Lab Exercise – HTTPObjectiveHTTP (HyperText Transfer Protocol) is the main protocol underlying the Web. The trace file is here: /~kevin/com320/labs/wireshark/trace-http.pcapStep 1: Capture a TraceCapture a trace of your browser making HTTP requests as follows; alternatively, you may use a supplied trace. Now that we seen how a GET works, we will observe your browser as it makes HTTP requests. Browser behavior can be quite complex, using more HTTP features than the basic exchange, so we will set up a simple scenario. We are assuming that your browser will use HTTP in this simple scenario rather than newer Web protocols such as SPDY, and if this is not the case you will need to disable SPDY.e your browser to find two URLs with which to experiment, both of which are HTTP (not HTTPS)URLs with no special port. The first URL should be that of a small to medium-sized image,whether .jpg, .gif, or .png. We want some static content without embedded resources. You canoften find such a URL by right-clicking on unlinked images in web pages to tell your browser toopen the URL of the image directly. The second URL should be the home page of some majorweb site that you would like to study. It will be complex by comparison. Visit both URLs to check that they work, then keep them handy outside of the browser so you can cut-and-paste them.2.Prepare your browser by reducing HTTP activity and clearing the cache. Apart from one freshtab that you will use, close all other tabs, windows to minimize HTTP traffic.unch Wireshark and start a capture with a filter of “tcp port 80”.We use this filter be-cause there is no shorthand for HTTP, but HTTP is normally carried on TCP port 80.Figure 2: Setting up the capture options4.Fetch the following sequence of URLs, after you wait for a moment to check that there is noHTTP traffic. If there is HTTP traffic then you need to find and close the application that is caus-ing it. Otherwise your trace will have too much HTTP traffic for you to understand. You will paste each URL into the browser URL bar and press Enter to fetch it. Do not type the URL, as this may cause the browser to generate additional HTTP requests as it tries to auto-complete your typing.a.Fetch the first static image URL by pasting the URL into the browser bar and pressing“Enter” or whatever is required to run your browser.b.Wait 10 seconds, and re-fetch the static image URL. Do this in the same manner, andwithout using the “Reload” button of your browser, lest it trigger other behavior.c.Wait another 10 seconds, and fetch the second home page URL.5.Stop the capture after the fetches are complete. You should have a window full of trace in whichthe protocol of some packets is listed as HTTP – if you do not have any HTTP packets there is a problem with the setup such as your browser using SPDY instead of HTTP to fetch web pages.Figure 3: Trace of HTTP traffic showing the details of the HTTP headerStep 2: Inspect the TraceTo focus on HTTP traffic, enter and apply a filter expression of“http”. This filter will show HTTP re-quests and responses, but not the individual packets that are involved. Recall that an HTTP response car-rying content will normally be spread across multiple packets. When the last packet in the response ar-rives, Wireshark assembles the complete response and tags the packet with protocol HTTP. The earlier packets are simply TCP segments carrying data; the last packet tagged HTTP includes a list of all the ear-lier packets used to make the response. A similar process occurs for the request, but in this case it is common for a request to fit in a single packet. With the filter expression of “http” we will hide the in-termediate TCP packets and see only the HTTP requests and responses. With this filter, your Wireshark display should be similar to the figure showing our example.Select the first GET in the trace, and expand its HTTP block. This will let us inspect the details of an HTTP request. Observe that the HTTP header follows the TCP and IP headers, as HTTP is an application proto-col that is transported using TCP/IP. To view it, select the packet, find the HTTP block in the middle panel, and expand it (by using the “+” expander or icon). This block is expanded in our figure.Explore the headers that are sent along with the request. First, you will see the GET method at the start of the request, including details such as the path. Then you will see a series of headers in the form of tagged parameters. There may be many headers, and the choice of headers and their values vary from browser to browser. See if you have any of these common headers:•Host. A mandatory header, it identifies the name (and port) of the server.•User-Agent. The kind of browser and its capabilities.•Accept, Accept-Encoding, Accept-Charset, Accept-Language. Descriptions of the formats that will be accepted in the response, e.g., text/html, including its encoding, e.g., gzip, and language.•Cookie. The name and value of cookies the browser holds for the website.•Cache-Control. Information about how the response can be cached.The request information is sent in a simple text and line-based format. If you look in the bottom panel you can read much of the request directly from the packet itself!Select the response that corresponds to the first GET in the trace, and expand its HTTP block. The Info for this packet will indicate “200 OK” in the case of a normal, successful transfer. You will see that the re-sponse is similar to the request, with a series of headers that follow the “200 OK” status code. However, different headers will be used, and the headers will be followed by the requested content. See if you have any of these common headers:•Server. The kind of server and its capabilities.•Date, Last-Modified. The time of the response and the time the content last changed.•Cache-Control, Expires, Etag. Information about how the response can be cached.Answer the following questions: (answers on next page)1.What is the format of a header line? Give a simple description that fits the headers you see.2.What headers are used to indicate the kind and length of content that is returned in a response?Answers to Inspect the Trace1.Each header line consists of the name of the header field and its value separated by a colon.There can be whitespace before (and after) the value. The line ends with a “carriage return, line feed” pair of characters, often written CRLF or “\r\n”.2.The type of the content is given by the Content-Type header, and its length is normally given bythe Content-Length header. (It is possible but unlikely that these headers are not present.)Step 3: Content CachingThe second fetch in the trace should be a re-fetch of the first URL. This fetch presents an opportunity for us to look at caching in action, since it is highly likely that the image or document has not changed and therefore does not need to be downloaded again. HTTP caching mechanisms should identify this oppor-tunity. We will now see how they work.Select the GET that is a re-fetch of the first GET, and expand its HTTP block. Likely, this will be the second GET in the trace. However, look carefully because your browser may issue other HTTP requests for its own reasons. For example, you might see a GET for /favicon.ico in the trace. This is the browser request-ing the icon for the site to use as part of the browser display. Similarly, if you typed in the URL bar your browser may have issued GETs as part of its auto-completion routine. We are not interested in this background browser activity at the moment.Now find the header that will let the server work out whether it needs to send fresh content. We will ask you about this header shortly. The server will need to send fresh content only if the content has changed since the browser last downloaded it. To work this out, the browser includes a timestamp tak-en from the previous download for the content that it has cached. This header was not present on the first GET since we cleared the browser cache so the browser had no previous download of the content that it could use. In most other respects, this request will be the same as the first time request. Finally, select the response to the re-fetch, and expand its HTTP block. Assuming that caching worked as expected, this response will not contain the content. Instead, the status code of the response will be “304 Not Modified”. This tells the browser that the content is unchanged from its previous copy, and the cached content can then be displayed.Answer the following questions (answer on next page).1.What is the name of the header the browser sends to let the server work out whether to sendfresh content?2.Where exactly does the timestamp value carried by the header come from?Answers to Content Caching1.The header is called “If-Modified-Since”, i.e., it asks the server to send the content if it has beenmodified since a given time.2.The timestamp value comes from the “Last-Modified” header of the most recent download ofthe content. It is a server timestamp for when the content last changed – it is not a timestamp according to the browser clock, and it is not a timestamp of the time of the downloadStep 4: Complex PagesNow let’s examine the third fetch at the end of the trace. This fetch was for a more complex web page that will likely have embedded resources. So the browser will download the initial HTML plus all of the embedded resources needed to render the page, plus other resources that are requested during the ex-ecution of page scripts. As we will see, a single page can involve many GETs!To summarize the GETs for the third page, bring up a HTTP Load Distribution panel. You will find this panel under “Statistics” and “HTTP”. You can filter for the packets that are part of the third fetch by re-moving the packets from the earlier part of the trace by either time or number. For example, use “frame.number>27” or “frame.time_relative>24” for our trace.Looking at this panel will tell you how many requests were made to which servers. Chances are that your fetch will request content from other servers you might not have suspected to build the page. These other servers may include third parties such as content distribution networks, ad networks, and analytics networks. Our panel is shown below – the page fetch involved 95 requests to 4 different serv-ers!Figure 4: HTTP Load Distribution panelFor a different kind of summary of the GETs, bring up a HTTP Packet Counter panel. You will also find this pane l under “Statistics” and “HTTP”, and y ou should filter for the packets that are part of the third fetch as before. This panel will tell you the kinds of request and responses. Our panel is shown in the figure below. You can see that it consists entirely of GET requests that are matched by 200 OK responses. However, there are a variety of other response codes that you might observe in your trace, such as when the resource is already cached.Figure 5: HTTP Packet Counter panelYou might be curious to know what content is being downloaded by all these requests. As well as seeing the URLs in the Info column, you can get a summary of the URLs in a HTTP Request panel under “Statis-tics” and “HTTP”. Each of the individual requests and responses has the same form we saw in an earlier step. Collectively, they are performed in the process of fetching a complete page with a given URL.For a more detailed look a t the overall page load process, use a site such as Google’s PageSpeed or . These sites will test a URL of your choice and generate a report of the page load activity, telling what requests were fetched at what times and giving tips for decreasing the overall page load time. We have shown the beginning of the “waterfall” diagram for the page load corresponding to our trace in the figure below. After the initial HTML resource is fetched there are many subsequent quick fetches for embedded resources such as JavaScript scripts, CSS stylesheets, images, and more.Figure 6: Start of waterfall graph for (from ) Homework - Explore Your Network Explore HTTP on your own once you have finished this lab. Some suggestions:• Study how web pages lead to a pattern of HTTP requests. Many popular web sites have relative-ly complex pages that require many HTTP requests to build. Moreover, these pages may contin-ue to issue “asynchronous” HTTP requests once they appear to have loaded, to load interactive displays or prepare for the next page, etc. You will see this activity when you find HTTP requests that continue after a page is loaded.• Look at video streaming HTTP traffic. We have looked at web HTTP traffic, but other applica-tions make HTTP requests too. It is common for streaming video clients embedded in browsers like Netflix to download content using a HTTP fetches of many small “chunks” of video. If y ou look at other applications, you may find that many of them use HTTP to shift about content, though often on a port different than port 80... .。
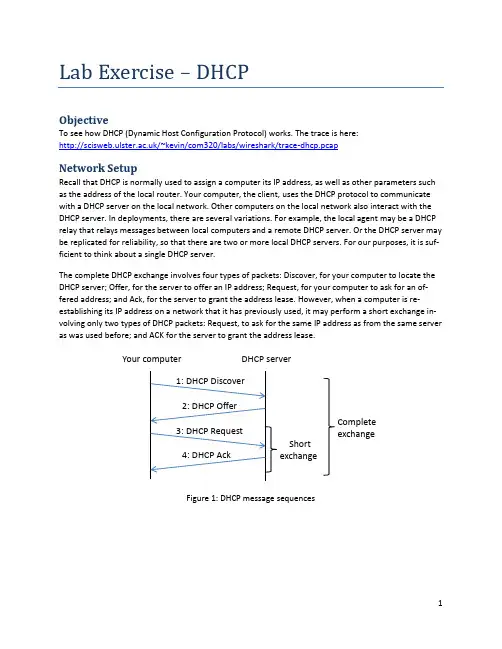
Lab Exercise – DHCPObjectiveTo see how DHCP (Dynamic Host Configuration Protocol) works. The trace is here: /~kevin/com320/labs/wireshark/trace-dhcp.pcap Network SetupRecall that DHCP is normally used to assign a computer its IP address, as well as other parameters such as the address of the local router. Your computer, the client, uses the DHCP protocol to communicate with a DHCP server on the local network. Other computers on the local network also interact with the DHCP server. In deployments, there are several variations. For example, the local agent may be a DHCP relay that relays messages between local computers and a remote DHCP server. Or the DHCP server may be replicated for reliability, so that there are two or more local DHCP servers. For our purposes, it is suf-ficient to think about a single DHCP server.The complete DHCP exchange involves four types of packets: Discover, for your computer to locate the DHCP server; Offer, for the server to offer an IP address; Request, for your computer to ask for an of-fered address; and Ack, for the server to grant the address lease. However, when a computer is re-establishing its IP address on a network that it has previously used, it may perform a short exchange in-volving only two types of DHCP packets: Request, to ask for the same IP address as from the same server as was used before; and ACK for the server to grant the address lease.Figure 1: DHCP message sequencesYour computer DHCP serverShortexchange Complete exchangeStep 1: Capture a TraceProceed as follows to renew your IP address and gather a trace of DHCP traffic. Note, however, that the following procedure will not work in the unlikely case that your computer’s IP address is statically a s-signed. Alternatively, you may use a supplied trace. Take care not to perform this lab remotely, since when you tell your computer to shut down and restart its network interface you will lose connectivity!unch Wireshark and start a capture with a filter of “(udp port 67) or (udp port 68)”.There is no shorthand to indicate DHCP, so we filter traffic using the UDP ports reserved forDHCP. (Note, in the display filter on main screen you can also type udp.port==67 II udp.port==68)Figure 2: Setting up the capture options2.When the capture is started, release and renew your IP address with the command given below.This procedure may cause your computer to lose network connectivity temporarily, and depend-ing on the operating system it may disrupt network connections. To minimize the disruption,close any programs that are using remote servers and enter the commands into a local window.Windows: T ype the command “ipconfig /release” followed by “ipconfig/renew”.(See figure below.)If on Linux: Find the name of the main network interface by typing “ifconfig” and observing the output.The interface may be called “eth0” or something else. Now use the “dhclient” command to first r e-lease the leased IP address and then to renew the lease. Type, for example, “sudodhclient –reth0” to do the release followed by “sudodhclient eth0” to renew the lease.Figure 5: Releasing and renewing the IP address on Windows 3.Once you have captured some DHCP traffic, stop the capture.Step 2: Inspect the TraceIn this step and the steps that follow, we will inspect only the short DHCP exchange described above. This is because the traffic you have captured can vary widely across settings. You may have as few as two DHCP packets on a quiet network or many DHCP packets on a busy network (especially if a class is running this lab!). The details of DHCP packets may vary depending on how the computers implement DHCP. There may be multiple packets of a single kind in an exchange due to replicated servers, and dif-ferent types of DHCP packets too.Look for the shortDHCP exchange (of a DHCP Request packet followed by a DHCP Ack packet) in your trace. Select the DHCP Request packet, and observe the protocol stack to see how DHCP messages are carried. The link protocol is likely Ethernet, and the next higher protocol is IP. Then comes UDP, so each DHCP message is carried in a UDP packet. On top of UDP, Wireshark is likely to say BOOTP (Bootstrap Protocol) instead of DHCP. This is a bit confusing, but DHCP is implemented as an extension of an older protocol called BOOTP. You can think of the BOOTP section as the DHCP header and message. An exam-ple window is shown below.Figure 3: Capture of DHCP packets, showing details of a DHCP RequestExpand the BOOTP (DHCP) section (using the “+” expander or icon) to look at the details of a DHCP Re-quest message. There are many fields, and we will only point out a few rather than cover them all. These fields are carried in all DHCP messages, though they have different values in different messages.∙The message begins with a Message Type. It is a Boot Request, which is used for all DHCP mes-sages sent from your computer to a DHCP server.∙After a few fields there is a Transaction ID field. All DHCP packets in a specific exchange betweena client and server carry the same transaction ID; that is how both ends know that the packetsbelong to the exchange rather than another concurrent DHCP operation.∙There are several IP address fields. These fields are used to carry IP addresses such as the one that the computer is being assigned.∙There is a Magic Cookie field. It carries a value that indicates the rest of the message contains a series of DHCP Options. That is, this really is a DHCP message, not a BOOTP message.∙Each DHCP option is self-contained, with a type code saying what it represents, along with a length and value. The first option is DHCP Message Type, which says what kind of DHCP message is being carried. The other options vary with the type of DHCP message. For example, a DHCPRequest will have aRequested IP Address option to ask for a specific address, which a DHCP Ack will have a IP Address Lease Time option to say for how long the IP address is being assigned.Now select a DHCP Ack packet and compare the BOOTP fields. We will ask questions about these fields in the next section, but for now want you to observe that the DHCP Ack has the same overall format, but different values for the fields and carries different DHCP options.You can browse the options for DHCP Requests and Acks to learn about DHCP. You can see, for example, how long the IP address is assigned by the server, whether seconds, minutes, hours or days.You will also see the other configuration parameters that are assigned by the DHCP server, such as the IP address of the domain name server and router, the subnet mask, the domain name for the host, and more.You can also try to make out the whole sequence of DHCP messages that is exchanged for your network setup. If may be as simple as the short exchange of Request and Ack, or it may be the complete ex-change of Discover, Offer, Request and Ack. It may have additional messages such as Release, and it may have multiple of the messages (e.g., two or more Offers or Acks) due to multiple local DHCP servers. Complicating the exchange with your computer is that the trace may capture concurrent DHCP traffic from other local computers. You can use the Transaction IDs to separate the different exchanges, and look at the Ethernet source address to see which DHCP messages were sent by your computer. It is likely that other DHCP traffic is mixed in with your exchange.Step 3: Details of DHCP MessagesSpend time understanding DHCP. Note the position of the Ethernet, IP, UDP, and BOOTP protocol block. Answer the following questions based on your examination of the BOOTP/DHCP fields for both the DHCP Request and DHCP Ack. Answers on next page.1.What are the two values of the BOOTP Message Type field?2.How long is the Transaction ID field? Say whether it is likely that concurrent DHCP operationsdone by different computers will happen to pick the same Transaction ID.3.What is the name of the field that carries the IP address that is being assigned to the client?Youwill find this field filled in on the DHCP Ack, as that message is completing the assignment.4. What is the value of the Magic Cookie that stands for DHCP?5.The first DHCP option is DHCP Message Type. What option value stands for this type?6.DHCP Requests will typically have a Client Identifier option. Look at the value of this option. Howdoes it identify the client? Take a guess.7.DHCP Acks will typically have a Server Identifier option. Look at the value of this option. Howdoes it identify the server? Take a guess.8.What option value stands for the Requested IP Address option? And for the IP Address LeaseTime option?9.How does the recipient of a DHCP message know that it has reached the last option?Step 3: Answers to details of DHCP MessagesFigure 1: Structure of a DHCP message1. The two values are Boot Request (1) and Boot Reply (2).2. The Transaction ID is 4 bytes long. Thus it is very unlikely that there will be collisions in a relative-ly small number of concurrent DHCP operations (until that number approaches 216!)3.The “Your (client) IP address” field carries the IP address being leased to the client. 4.The DHCP magic cookie value is 0x63825363. 5. The option value of 53 stands for DHCP Message Type.6. It is typical for the Client Identifier to carry the Ethernet address of the client, but possible to use some other kind of identifier (e.g., hostname, serial number).7. It is typical for the Server Identifier to carry the IP address of the DHCP server, but possible to use some other kind of identifier.8. The option value of 50 stands for Requested IP Address and the value of 51 stands for IP Address Lease Time.9. The end of the DHCP options is identified with a DHCP option called End with value 255. Ether-net IP header UDP header BOOTP fields DHCP Op-tionsStep 4: DHCP Message AddressingNow we will look at how DHCP messages are addressed to computers at the UDP, IP and Ethernet layers. This is interesting because DHCP is used to assign IP addresses – a computer requesting a DHCP address may neither have its own IP address nor know the IP address of the DHCP server.Start by selecting a DHCP Request packet and looking at its UDP details in the middle Wireshark panel. We will only look at the DHCP Request message to keep things simple, as the details of addressing differ for other DHCP messages. Answers on next page.1.What port number does the DHCP client use, and what port number does the DHCP server use?Ports matter because UDP messages are addressed using ports. Both of these port numbers are on the Request in the source and destination port fields (and you will also see them on the Ack). Now look at the IP addresses in the IP protocol header of the packet for the next question. Do not look inside the BOOTP fields for the DHCP parameters, as we care about how DHCP messages are addressed at lower protocol layers. When the request is sent, your computer has no IP address and may not even know the IP address of the DHCP server, so the IP addressing differs from a routine IP packet.2.What source IP address is put on the Request message?It is a special value meaning “this hoston this network” used for initialization.3.What destination IP address is put on the Request message? It is also a reserved value designedto reach the DHCP server wherever it is on the local network.Finally, look at the Ethernet addresses for the next question.4.What source Ethernet address is put on the Request message, and what destination Ethernetaddress is put on the Request message? One of these addresses is a reserved address. Looking at the addressing should help you to understand why your computer may record the DHCP traf-fic of other local computers in your trace. Since the IP addressing is not yet established, many DHCP messages are sent to all computers on the local network. This makes sure every computer receives DHCP messages intended for them, but it poses a difficulty: one computer may receive DHCP messages intended for another computer.5.How does a computer work out whether a DHCP message it receives is intended as a reply to itsDHCP Request message, and not a reply to another computer? Hint: if you are not sure then go over the fields you inspected previously in Step 2 above.Step 4: Answers to DHCP Message Addressing1. The DHCP client (your computer) uses UDP port 68 and the DHCP server uses UDP port 67.2. The source IP address is 0.0.0.0. It is a special address used during address initialization.3. The destination IP address is 255.255.255.255. It is the broadcast address, which means the mes-sage is intended for all computers on the network. (It is not possible to use a more restricted subnet broadcast, e.g., 192.168.255.255, as the subnet mask is not yet known by the client.)4. The source Ethernet addres s is simply your own computer’s Ethernet address, since that is a l-ready assigned to your NIC. The destination Ethernet address is ff:ff:ff:ff:ff:ff, the reserved broadcast Ethernet address, so that the packet reaches all computers on the local network.5. The DHCP messages in a single exchange carry the same Transaction ID. Thus a computer looks for a DHCP reply such as an Ack with a Transaction ID that matches the value it placed on the earlier DHCP message such as a Request. (This is in addition to any Ethernet address filtering: if the reply is un-icast then it will have the computer’s Ethernet address as its destination.)。
题目一:某分局申告故障,局域网内多台电脑网速慢, ping 网关掉包严重。
该局用户通过光收发器接网线到上层 2 层汇聚交换机上,归属于同 1 条 vlan,带宽 10M, ip 地址范围10.229.143.1/24。
(限时 10 分钟)总分: 15 分第一、请大概说明可能造成该故障的原因。
答案: 1、传输层问题(含光路质量,网线质量,光收发器故障等) (1 分)2、网络层问题(含数据流量拥塞,病毒等) (1 分)第二、已确定非物理链路问题,请简要说明处理该故障的必要步骤?(注:该 2 层交换机上有空余电口)答案: 1、登录 2 层交换机,对该用户端口做镜像(2 分)2、将电脑通过网线直接接在镜像端口上( 2 分)3、运行电脑抓包软件(如 sniffer, ethereal 等),对抓包软件结果进行分析,根据分析结果判断故障原因。
(2 分)第三、根据以下图示,分析故障原因,及最快捷的恢复手段。
答案:如图所示,历时 5.4 秒,IP 为 10.229.143.150 的主机(2 分),已经发送了6048 个 IP 包,共 6061540 个 Bytes,换算下来:6061540*8/5.4≈9Mbit/s,因用户链路带宽仅为 10M,(2 分)所以出现拥塞,导致掉包( 1 分) 。
该主机上行数据量过大,有可能是中病毒所致,将该 IP 主机断开网络,故障可恢复。
(2 分)实操部分:给予参赛选手笔记本电脑,控制线,网线 2 段,网线钳,测线仪,水晶头 4 个,普通傻瓜式 2 层交换机一台(含电源),插板一个。
其中交换机,多余网线,多余水晶头为陷阱。
题目二:请参赛选手根据所获取的资源,合理有效利用,完成对 6503 汇聚交换机上 vlan 号为 120 的故障用户的抓包分析(抓包时间请控制为 60 秒),该交换机可用的以太网接口为E1/0/40,保存抓包结果 (以分公司名称 ---参赛选手名字为保存的文件名,如:红花岗---XX,并根据抓包结果提供收包个数和发包个数最多的主机 IP 及其 MAC 。
网络协议数据获取与TC P/IP协议分析一、实验环境介绍网络接入方式:校园网宽带接入,IP获取方式:DHCP;操作系统为w i ndow s7旗舰版;本机MAC地址为5c:f9:dd:70:6a:89,IP地址为10.104.5.53。
图1 网络状态截图二、实验步骤1. 启动wire shark;2. 启动一个网页浏览器,并键入一个U RL地址,如:www.baidu.com。
注意此时不要按下回车键;3. 清除电脑中的D NS缓存,启动wire shark,开始抓包;4. 在浏览期网页位置按下回车键,开始访问指定的网页。
5. 一旦网页内容下载完毕,立即停止Mi croso f t Networ k Monito r抓包,并将抓到的数据包存入文件中,同时将显示的网页存储下来,以便后面参考。
三、实验过程使用wire shark前清除DNS缓存截图如下。
图2 清除DNS缓存抓取协议如下图所示:图3 抓取协议四、协议分析1. 抓取的协议类型检查在Mic rosof t Networ k Monito r顶端窗口的协议一列,确认你已经抓到了DNS、TCP和HTTP数据包。
答:由图3可看出抓到了DNS、TCP、HTTP数据包。
2. 以太网帧,IP分组和U D P数据报(1) 检查客户端发出的第一个D NS分组a.确定客户端的以太网地址和IP地址答:如图4,客户端的MA C地址为5c:f9:dd:70:6a:89;IPv4地址为:10.104.5.53。
b.以太网帧结构的TYPE字段是什么内容?答:如图所示,以太网帧结构的TYPE字段为:0x0800,表示该帧是I P协议。
c.目的以太网地址和目的I P地址分别是什么?这些地址对应哪些计算机?解释这些结果与你连接到In ter net 的计算机有关系。
卓越计Y111欧晓强2011004030581. Is your browser running HTTP version 1.0 or 1.1? What version of HTTP is the server running? 答:2. What languages (if any) does your browser indicate that it can accept to the server?答:3. What is the IP address of your computer? Of the server?答:本机IP地址:172.17.171.204,服务器IP地址:128.119.245.124. What is the status code returned from the server to your browser?答:5. When was the HTML file that you are retrieving last modified at the server?答:6. How many bytes of content are being returned to your browser?答:7. By inspecting the raw data in the packet content window, do you see any headers within the data that are not displayed in the packet-listing window? If so, name one.答:没有。
8. Inspect the contents of the first HTTP GET request from your browser to theserver. Do you see an “IF-MODIFIED-SINCE” line in the HTTP GET?答:没有看到。
wireshark实验⼀答案1.What is the IP address and TCP port number used by the clientcomputer (source) that is transferring the file to /doc/8d460b7e8e9951e79b892738.html ?Ip address 192.168.1.36TCP port number:19572.What is the IP address of /doc/8d460b7e8e9951e79b892738.html ? On what port numberis it sending and receiving TCP segments for this connection?the IP address of /doc/8d460b7e8e9951e79b892738.html :128.119.245.12port number:803.What is the sequence number of the TCP SYN segment that is usedto initiate the TCP connection between the client computer and /doc/8d460b7e8e9951e79b892738.html What is it in the segment that identifies the segment as a SYN segmentsequence number:0syn 被设置为1说明是syn段4.What is the sequence number of the SYNACK segment sent bygaia.cs.umass.ed to the client computer in reply to the SYN? What is the value of the ACKnowledgement field in the SYNACK segment?How did /doc/8d460b7e8e9951e79b892738.html determine that value? What is it in the segment that identifies the segment as a SYNACK segment?The sequence number of the SYNACK segment sent by /doc/8d460b7e8e9951e79b892738.html is:0 SYNACK segment 中ACKnowledgement 的值为1;ACKnowledgement number的值为SYN消息中sequencenumber加上1所得;SYN 和Acknowledgement f都置为1说明这是⼀个SYNACK segment.5.What is the sequence number of the TCP segment containing theHTTP POST command?第11号报⽂段是包含HTTP POST 命令的TCP segment。
Lab Exercise – IPv4ObjectiveTo learn about the details of IP (Internet Protocol). IP is the network layer protocol used throughout the Internet. We will examine IP version 4, since it is ubiquitously deployed, while the IP version 6 is partly deployed.The trace is here: /~kevin/com320/labs/wireshark/trace-ipv4.pcapThe text file is here: /~kevin/com320/labs/wireshark/trace-ipv4.txt RequirementsWireshark: This lab uses the Wireshark software tool to capture and examine a packet trace. A packet trace is a record of traffic at a location on the network, as if a snapshot was taken of all the bits that passed across a particular wire. The packet trace records a timestamp for each packet, along with the bits that make up the packet, from the lower-layer headers to the higher-layer contents. Wireshark runs on most operating systems, including Windows, Mac and Linux. It provides a graphical UI that shows the sequence of packets and the meaning of the bits when interpreted as protocol headers and data. It col-or-codes packets by their type, and has various ways to filter and analyze packets to let you investigate the behavior of network protocols. Wireshark is widely used to troubleshoot networks. You can down-load it from if it is not already installed on your computer. We highly recommend that you watch the short, 5 minute video “Introduction to Wireshark” that is on the site.wget / curl: This lab uses wget (Linux and Windows) and curl (Mac) to fetch web resources. wget and curl are command-line programs that let you fetch a URL. Unlike a web browser, which fetches and executes entire pages, wget and curl give you control over exactly which URLs you fetch and when you fetch them. Under Linux, wget can be installed via your package manager. Under Windows, wget is available as a binary; look for download information on /software/wget/. Under Mac, curl comes installed with the OS. Both ha ve many options (try “wget --help” or “curl --help” to see) but a URL can be fetched simply with “wget URL” or “curl URL”. traceroute / tracert: This lab uses “traceroute” to find the router level path from your computer to a remote Internet host. traceroute is a standard command-line utility for discovering the Internet paths that your computer uses. It is widely used for network troubleshooting. It comes pre-installed on Win-dow and Mac, and can be installed using your package manager on Linux. On Windows, it is called “tracert”. It has various options, but simply issuing the command “traceroute .au” will cause your computer to find and print the path to the remote computer (here .au).Step 1: Capture a TraceProceed as follows to capture a trace assuming that your computer has IPv4 connectivity; alternatively, you may use a supplied trace. The trace we want to gather is a simple web fetch from a remote server, which will cause your computer to send and receive IP packets, followed by a traceroute to the re-mote server to find the path it uses over the Internet.1.Pick a URL at a remote server, e.g., .au/ and check that you can fetch thecontents with wget or curl, e.g., “wget .au/” or “curl.au/”. This will fetch the resource and either write it to a file (wget) or to the screen (curl). With wget, you want a single response with status code “200 OK”. Ifthe fetch does not work then try a different URL; keep in mind that you may be referring to aURL by a shortcut for which browsers must do work to find the intended content, e.g., may really be /index.html. If no URLs seem to work then de-bug your use of wget/curl or your Internet connectivity.2.Perform a traceroute to the same remote server to check that you can discover informationabout the network path.On Windows, type, e.g., “tracert .au”. On Linux / Mac, type, e.g., “traceroute .au”. If you are on Linux / Mac and behind aNAT (as most home users or virtual machine users) then use the –I option (that was a capital i)to traceroute, e.g., “traceroute –I .au”. This will cause traceroute to send ICMP probes like tracert instead of its usual UDP probes; ICMP probes are better ableto pass through NAT boxes. A successful example is shown below; save the output as you willneed it for later steps. Note that traceroute may take up to a minute to run. Each line shows information about the next IP hop from the computer running traceroute towards the tar-get destination. T he lines with “*”s indicate that there was no response from the network toidentity that segment of the Internet path. Some unidentified segments are to be expected.However, if traceroute is not working correctly then nearly all the path will be “*”s. In thiscase, try a different remote server, experiment with traceroute, or use the supplied traces.Figure 1: Running traceroute (as tracert on Windows)unch Wireshark and start a capture with a filter of “tcp port 80“. Make sure to check“enable network name resolution”. We use this filter to record only standard web traffic. Name resolution will translate the IP addresses of the computers sending and receiving packets into names. It will help you to recognize whether the packets are going to or from your computer.Your capture window should be similar to the one pictured below, other than our highlighting.Select the interface from which to capture as the main wired or wireless interface used by your computer to connect to the Internet. If unsure, guess and revisit this step later if your capture is not successful. Uncheck “capture packets in promiscuous mode”. This mode is useful to over-hear packets sent to/from other computers on broadcast networks. We only want to record packets sent to/from your computer. Leave other options at their default values. The capture filter, if present, is used to prevent the capture of other traffic your computer may send or re-ceive. On Wireshark 1.8, the capture filter box is present directly on the options screen, but on Wireshark 1.9, you set a capture filter by double-clicking on the interface.Figure 2: Setting up the capture options4.After the capture is started, repeat the wget/curl command above. This time, the packets willalso be recorded by Wireshark.5.After the command is complete, return to Wireshark and stop the trace. You should now have ashort trace similar to that shown in the figure below, along with the output of a traceroute you ran earlier to the corresponding server.Figure 3: Trace of wget/curl traffic showing the details of the IP headerStep 2: Inspect the TraceSelect any packet in the trace and expand the IP header fields (using the “+” expander or icon) to see the details. You can simply click on a packet to select it (in the top panel). You will see details of its structure (in the middle panel) and the bytes that make up the packet (in the bottom panel). Our interest is the IP header, and you may ignore the other higher and lower layer protocols. When you click on parts of the IP header, you will see the bytes that correspond to the part highlighted in the bottom panel. We have expanded the IP header and clicked on all the IP header fields in the figure above.Let us go over the fields in turn:•The version field is set to 4. This is “IPv4” after all.•Then there is the header length field. Observe by looking at the bytes selected in the packet da-ta that version and header length are both packed into a single byte.•The Differentiated Services field contains bit flags to indicate whether the packet should be handled with quality of service and congestion indications at routers.•Then there is the Total Length field.•Next is the Identification field, which is used for grouping fragments, when a large IP packet is sent as multiple smaller pieces called fragments. It is followed by the Flags and the Fragmentoffset fields, which also relate to fragmentation. Observe they share bytes.•Then there is the Time to live or TTL field, followed by the Protocol field.•Next comes the header checksum. Is your header checksum carrying 0 and flagged as incorrect for IP packets sent from your computer to the remote server? On some computers, the operat-ing system software leaves the header checksum blank (zero) for the NIC to compute and fill in as the packet is sent. This is called protocol offloading. It happens after Wireshark sees thepacket, which causes Wireshark to believe that the checksum is wrong and flag it with a differ-ent color to signal a problem. A similar issue may happen for the TCP checksum. You can remove these false errors if they are occurring by telling Wireshark not to validate the checksums. Select “Preferences” from the Wireshark menus and expand the “Protocols” area. Look under the list until you come to IP v4. Uncheck “Validate checksum if possible”. Similarly, you may uncheckchecksum validation for TCP if applicable to your case.•The last fields in the header are the normally the source and destination address. It is possible for there to be IP options, but these are unlikely in standard web traffic.•The IP header is followed by the IP payload. This makes up the rest of the packet, starting with the next higher layer header, TCP in our case, but not including any link layer trailer (e.g., Ether-net padding).Step 3: IP Packet StructureTo show your understanding of IP, sketch a figure of an IP packet you studied. It should show the position and size in bytes of the IP header fields as you can observe using Wireshark.Since you cannot easily de-termine sub-byte sizes, group any IP fields that are packed into the same bytes. Your figure can simply show the frame as a long, thin rectangle. Try not to look at the figure of an IPv4 packet in your text; check it afterwards to note and investigate any differences.To work out sizes, observe that when you click on a protocol block in the middle panel (the block itself, not the “+” expander) Wireshark will highlight the corresponding bytes in the packet in the lower panel, and display the length at the bottom of the window. You may also use the overall packet size shown in the Length column or Frame detail block. Note that this method will not tell you sub-byte positions.By looking at the IP packets in your trace, answer these questions:1.What are the IP addresses of your computer and the remote server?2.Does the Total Length field include the IP header plus IP payload, or just the IP payload?3.How does the value of the Identification field change or stay the same for different packets? Forinstance, does it hold the same value for all packets in a TCP connection or does it differ for each packet? Is it the same in both directions? Can you see any pattern if the value does change?4.What is the initial value of the TTL field for packets sent from your computer? Is it the maximumpossible value, or some lower value?5.How can you tell from looking at a packet that it has not been fragmented? Most often IP pack-ets in normal operation are not fragmented. But the receiver must have a way to be sure. Hint: you may need to read your text to confirm a guess.6.What is the length of the IP Header and how is this encoded in the header length field? Hint: no-tice that only 4 bits are used for this field, as the version takes up the other 4 bits of the byte.You may guess and check your text.Step 4: Internet PathsThe source and destination IP addresses in an IP packet denote the endpoints of an Internet path, not the IP routers on the network path the packet travels from the source to the destination. traceroute is a utility for discovering this path. It works by eliciting responses (ICMP TTL Exceeded messages) from the router 1 hop away from the source towards the destination, then 2 hops away from the source, then 3 hops, and so forth until the destination is reached. The responses will identify the IP address of the router. The output from traceroute normally prints the information for one hop per line, including the measured round trip times and IP address and DNS names of the router. The DNS name is handy for working out the organization to which the router belongs. Since traceroute takes advantage of common router implementations, there is no guarantee that it will work for all routers along the path, and it is usual to see “*” re sponses when it fails for some portions of the path.Using the traceroute output, sketch a drawing of the network path. If you are using the supplied trace, note that we have provided the corresponding traceroute output as a separate file.Show your computer (lefthand side) and the remote server (righthand side), both with IP addresses, as well as the routers along the path between them numbered by their distance on hops from the start of the path. You can find the IP address of your computer and the remote server on the packets in the trace that you captured. The output of traceroute will tell you the hop number for each router.To finish your drawing, label the routers along the path with the name of the real-world organization to which they belong. To do this, you will need to interpret the domain names of the routers given by traceroute. If you are unsure, label the routers with the domain name of what you take to be the or-ganization. Ignore or leave blank any routers for which there is no domain name (or no IP address).This is not an exact science, so we will give some examples. Suppose that traceroute identifies a router along the path by the domain name . Normally, we can ig-nore at least the first part of the name, since it identifies different computers in the same organization and not different organizations. Thus we can ignore at least “arouter” in the domain name. For ge-neric top-level domains, like “.com” and “.edu”, the last two domains give the domain name of the or-ganization. So for our example, it is “”. To translate this domain name into the real-world name of an organization, we might search for it on the web. You will quickly find that is the University of Washington. This means tha t “cac” portion is an internal structure in the University of Washington, and not important for the organization name. You would write “University of Washington” on your figure for any routers with domain names of the form *. Alternatively, consider a router with a domain name like .au. Again, we ignore at least the “arouter” part as indicating a computer within a specific organization. For country-code top-level domains like “.au” (for Australia) the last three domain s in the name will normally give the organization. In this case the organization’s domain name is .au. Using a web search, we find this domain represents AARNET, Australia’s research and education network. The “syd” por-tion is internal structure, and a good guess is that it means the router is located in the Sydney part of AARNET. So for all routers with domain names of the form *.au, you would write“AARNET” on your figure. While there are no guarantees, you should be able to reason similarly and at least give the domain name of the organizations near the ends of the path.Step 5: IP Header ChecksumWe will now look at the IP header checksum calculation by validating a packet. The checksum algorithm adds the header bytes 16 bits at a time. It is computed so that re-computing the sum across the entire IP header (including the checksum value) will produce the result of zero. A complicating factor for us is that this is done using 1s complement arithmetic, rather than 2s complement arithmetic that is normally used for computing. The steps below explain how to perform the necessary computation.From the trace, pick a packet sent from the remote server to your computer and check that you have a non-zero value in the checksum field. The checksum value sent over the network will be non-zero, so if you have a zero value it is because of the capture setup. Try a packet that has an IP header of 20 bytes, the minimum header size when there are no options, to make this exercise easier.Follow these steps to check that the checksum value is correct:1.Divide the header into 10 two byte (16 bit) words. Each word will be 4 hexadecimal digits shownin the packet data panel in the bottom of the Wireshark window, e.g., 05 8c2.Add these 10 words using regular addition. You may add them with a hexadecimal calculator(Google to find one), or convert them to decimal, add them, and convert them back to hexadec-imal. Do whatever is easiest.3.To compute the 1s complement sum from your addition so far, take any leading digits (beyondthe 4 digits of the word size) and add them back to the remainder. For example: 5a432 will be-come a432 + 5= a437.4.The end result should be 0xffff. This is actually zero in 1s complement form, or more precise-ly 0xffff is -0 (negative zero) while 0x0000 is +0 (positive zero).If you cannot get your sum to come out and are sure that the checksum must be wrong, you can get Wireshark to check it. See whether it says “[correct]” already. If it does not then use the menus to go to Preferenc es, expand Protocols, choose IPv4 from the list, and check “validate header checksum”. Now Wireshark will check the checksum and tell you if it is correct.Extra - Explore on your ownWe encourage you to explore IP on your own once you have completed this lab. Some ideas: •Read about and experiment with IPv6. Modern operating systems already include support for IPv6, so you may be able to capture IPv6 traffic on your network. You can also “join the IPv6”backbone by tunneling to an IPv6 provider.•Learn about tunnels, which wrap an IP packet within another IP header.•Read about IP geolocation. It is the process of assigning a geographical location to an IP address using measurements or clues from its name administrative databases. Try a geolocation service.•Learn about IPsec or IP security. It provides confidentiality and authentication for IP packets, and is often used as part of VPNs.。
Lab Exercise – Protocol LayersObjectiveTo learn how protocols and layering are represented in packets. They are key concepts for structuring networks that are covered in the text.The trace for this lab is here:/~kevin/com320/labs/wireshark/trace-protocol-layers.pcap(although the main trace you will look at is from a site you pick such as in the exam-ples which follow).RequirementsWireshark: This lab uses the Wireshark software tool to capture and examine a packet trace. A packet trace is a record of traffic at a location on the network, as if a snapshot was taken of all the bits that passed across a particular wire. The packet trace records a timestamp for each packet, along with the bits that make up the packet, from the lower-layer headers to the higher-layer contents. Wireshark runs on most operating systems, including Windows, Mac and Linux. It provides a graphical UI that shows the sequence of packets and the meaning of the bits when interpreted as protocol headers and data. It col-or-codes packets by their type, and has various ways to filter and analyze packets to let you investigate the behavior of network protocols. Wireshark is widely used to troubleshoot networks. You can down-load it from for your personal computer. It is an ideal packet analyzer for our labs –it is stable, has a large user base and well-documented support that includes a user-guide /docs/wsug_html_chunked), and a detailed FAQ, rich functionality that in-cludes the capability to analyze hundreds of protocols, and a well-designed user interface. It operates in computers using Ethernet, serial (PPP and SLIP), 802.11 wireless LANs, and many other link-layer tech-nologies (if the OS on which it is running allows Wireshark to do so). It is already installed in the labs.A quick help guide to Wireshark display filters is here: /wireshark_filters.php Wireshark is a c ore tool for any wireless ‘man in the middle’ or similar snooping attack. It is simply in-dispensable for those who wish to examine packets being transferred over a network –good or bad…..Wireshark & Packet Sniffing BackgroundThe basic tool for observing the messages exchanged between executing protocol entities is called a packet sniffer. As the name suggests, a packet sniffer captures (“sniffs”) messages being sent/received from/by your computer; it will also typically store and/or display the contents of the various protocol fields in these captured messages. A packet sniffer itself is passive. It observes messages being sent and received by applications and protocols running on your computer, but never sends packets itself. Simi-larly, received packets are never explicitly addressed to the packet sniffer. Instead, a packet sniffer re-ceives a copy of packets that are sent/received from/by application and protocols executing on your machine.Figure 1 shows the structure of a packet sniffer. At the right of Figure 1 are the protocols (in this case, Internet protocols) and applications (such as a web browser or ftp client) that normally run on your computer. The packet sniffer, shown within the dashed rectangle in Figure 1 is an addition to the usual software in your computer, and consists of two parts. The packet capture library receives a copy of eve-ry link-layer frame that is sent from or received by your computer. Messages exchanged by higher layer protocols such as HTTP, FTP, TCP, UDP, DNS, or IP all are eventually encapsulated in link-layer frames that are transmitted over physical media such as an Ethernet cable.Figure 1: Packet Sniffer StructureIn Figure 1, the assumed physical media is an Ethernet, and so all upper-layer protocols are eventually encapsulated within an Ethernet frame. Capturing all link-layer frames thus gives you all messagessent/received from/by all protocols and applications executing in your computer.The second component of a packet sniffer is the packet analyzer, which displays the contents of all fields within a protocol message. In order to do so, the packet analyzer must “understand” the structure of all messages exchanged by protocols. For example, suppose we are interested in displaying the various fields in messages exchanged by the HTTP protocol in Figure 1. The packet analyzer understands the format of Ethernet frames, and so can identify the IP datagram within an Ethernet frame. It also under-stands the IP datagram format, so that it can extract the TCP segment within the IP datagram. Finally, it understands the TCP segment structure, so it can extract the HTTP message contained in the TCP seg-ment. Finally, it understands the HTTP protocol and so, for example, knows that the first bytes of an HTTP message will contain the string “GET,”“POST,” or “HEAD,”.Step 1: Capture a Traceunching WiresharkYou can type Wireshark in the run box of main Windows 8 start screen. Press the Windows key on the keyboard and type “wireshark”. If a problem launching it then see here1.Figure 2: Wireshark in lab2.Just close the dialog box which prompts you to install a new version. You will then see a startupscreen, as shown next.Figure 3: Initial Wireshark Screen3.Take a look at the left hand side of the screen –you’ll see an “Interface list”. This is the list ofnetwork interfaces on your computer. Choose Ethernet.1 It should load but there can be a problem with the new lab configuration for Wireshark and npf driver. Therefore if this is not working…. then please do the next step. Launch Wireshark as follows. Click desktop icon on main windows screen & use the file explorer to browse to C:\local Disk (C)\Program Files\Wireshark. Finally, RIGHT CLICK on Wireshark as “Run as administrator”.4.Next, click Start (as shown below).5.Wireshark will capture all packets on that interface. Click on the network card on the particularmachine you are working on. In the example above, it is the Ethernet Driver to start packet cap-ture (i.e., for Wireshark to begin capturing all packets being sent to/from that interface), ascreen like the one below will be displayed, showing information about the packets being cap-tured. Once you start packet capture, you can stop it by using the Capture pull down menu and selecting Stop.We want this trace to look at the protocol structure of packets. A simple Web fetch of a URL from a server of your choice to your computer, which is the client, could also serve as traffic.6.Open your browser, e.g. Chrome and pick a URL & fetch it e.g.”.7.Close unnecessary browser tabs and windows. By minimizing browser activity you will stop yourcomputer from fetching unnecessary web content, and avoid incidental traffic in the trace.8.Now return to Wireshark and you will see a screen similar to below.That is all for now. Next you will read a little more about Wireshark and tracing packets.Main Wireshark InterfaceThe Wireshark interface has five major components:Figure 4: Wireshark Graphical User Interface, during packet capture and analysis• The command menus are standard pull down menus located at the top of the window. The File menu allows you to save captured packet data or open a file containing previously captured packet data. The Capture menu allows you to begin packet capture.• The packet-listing window displays a one-line summary for each packet captured, including the pack-et number (assigned by Wireshark; this is not a packet number contained in any protocol’s header), the time at which the packet was captured, the packet’s source and destination addresses, the protocol type, and protocol-specific information contained in the packet. The packet listing can be sorted accord-ing to any of these categories by clicking on a column name. The protocol type field lists the highest-level protocol that sent or received this packet, i.e., the protocol that is source or ultimate sink for this packet.• The packet-header details window provides details about the packet selected (highlighted) in the packet-listing window. (To select a packet in the packet-listing window, place the cursor over the pack-et’s one-line summary in the packet-listing window and click with the left mouse button.). These details include information about the Ethernet frame (assuming the packet was sent/received over an Ethernet interface) and IP datagram that contains this packet. The amount of Ethernet and IP-layer detail dis-played can be expanded or minimized by clicking on the plus minus boxes to the left of the Ethernet frame or IP datagram line in the packet details window.• The packet-contents window displays the entire contents of the captured frame, in both ASCII and hexadecimal format. Towards the top of the Wireshark graphical user interface, is the packet display fil-ter field, into which a protocol name or other information can be entered in order to filter the infor-mation displayed in the packet-listing window.Filtering TrafficNow return to your Wireshark trace captured earlier. We will look to see how we can isolate the Web Page traffic from the other protocol packets.9.You have two options. You can simply type “tcp.port==80” in the main filter box on the mainscreen like below.10.Instead of the method above, you can also filter by typing “port 80” in the filter box like below.This filter will record only standard web traffic and not other kinds of packets that your comput-er may send. The checking will translate the addresses of the computers sending and receivingpackets into names, which should help you to recognize whether the packets are going to orfrom your computer. Your capture window will be similar to the one pictured in next screenshot.Figure 5: Setting up the capture options11.When the capture is started, visit a site which uses http (not https). This time, the packets will berecorded by Wireshark as the content is transferred. Try again, in your browser.12.After the fetch is successful, return to Wireshark and use the menus or buttons to stop the trace.If you have succeeded, the upper Wireshark window will show multiple packets, and most likely it will be full. How many packets are captured will depend on the size of the web page, but there should be at least 8 packets in the trace, and typically 20-100, and many of these packets will be colored green. I recommend you stop recording by pressing the Red Stop button on the inter-face as this will make it easier for you to scroll back to the start of the request to find the “200 OK” packet. An example is shown below. Congratulations, you have captured a trace!Figure 6: Packet trace of web browsing trafficStep 2: Inspect the TraceSelect a packet for which the Protocol column is “HTTP” and the Info column says it is a GET. It is the packet that carries the web (HTTP) request sent from your computer to the server. (You can click the column headings to sort by that value, though it should not be difficult to find an HTTP packet by inspec-tion.) Let’s have a closer look to s ee how the packet structure reflects the protocols that are in use. Since we are fetching a web page, we know that the protocol layers being used are as shown below. That is, HTTP is the application layer web protocol used to fetch URLs. Like many Internet applications, it runs on top of the TCP/IP transport and network layer protocols. The link and physical layer protocols depend on your network, but are typically combined in the form of Ethernet (shown) if your computer is wired, or 802.11 (not shown) if your computer is wireless.Figure 7: Protocol stack for a web fetchWith the HTTP GET packet selected, look closely to see the similarities and differences between it and our protocol stack as described next. The protocol blocks are listed in the middle panel. You can expand each block (by clicking on the “+” expander or icon) to see its details.• The first Wireshark block is “Frame”. This is not a protocol, it is a record that describes overall information about the packet, including when it was captured and how many bits long it is.• The second block is “Ethernet”. Note that you may have taken a trace on a computer using 802.11 yet still see an Ethernet block instead of an 802.11 block. Why? It happens because we asked Wireshark to capture traffic in Ethernet format on the capture options, so it converted the real 802.11 header into a pseudo-Ethernet header.• Then come IP, TCP, and HTTP, which are just as we wanted. Note that the order is from the bot-tom of the protocol stack upwards. This is because as packets are passed down the stack, the header information of the lower layer protocol is added to the front of the information from the higher layer protocol, as in Fig. 1-15 of your text. That is, the lower layer protocols come first in the packet “on the wire”.HTTPTCPIP Ethernet ClientServer HTTP TCP IPEthernetpacketStep 3: Inspect the Trace AgainNow find another HTTP packet, the response from the server to your computer, and look at the structure of this packet for the differences compared to the HTTP GET packet.This packet should have “200 OK” in the Info field, denoting a successful fetch. In our trace, there are two extra blocks in the detail panel as seen in the next figure.•The first extra block says something like “[... reassembled TCP segments …]”. Details in your cap-ture will vary, but this block is describing more than the packet itself. Most likely, the web re-sponse was sent across the network as a series of packets that were put together after they ar-rived at the computer. The packet labeled HTTP is the last packet in the web response, and the block lists packets that are joined together to obtain the complete web response. Each of these packets is shown as having protocol TCP even though the packets carry part of an HTTP re-sponse. Only the final packet is shown as having protocol HTTP when the complete HTTP mes-sage may be understood, and it lists the packets that are joined together to make the HTTP re-sponse.•The second extra block says “Line-based text data …”. Details in your capture will vary, but this block is describing the contents of the web page that was fetched. In our case it is of typetext/html, though it could easily have been text/xml, image/jpeg, or many other types. As with the Frame record, this is not a true protocol. Instead, it is a description of packet contents that Wireshark is producing to help us understand the network traffic.Figure 8: Inspecting a HTTP “200 OK” response1.Locate the HTTP GET packet which has “200 OK (text/html)” in the Info field, denoting asuccessful fetch. See below for instance in the third line in white.2.Scroll down in the middle pane to [+] Line-based text data: text/html and rightclick with your mouse. (See above)3.From the context menu which now appears, select Copy -→ Bytes → Printable Text Only Youshould see a window similar to the following popup window below.4.This copies all the code for the Ulster home page.5.Open up a text editor such as notepad++ and paste this HTML code into a new document. Saveas UlsterHomePage.html in a directory such as W: or downloads. Next open up explorer and scroll to where you have saved the file and open it in the default browser by clicking on it.6.Note how much of the Ulster home page actually gets sent over the wire to your PC.Step 4: Packet StructureExamine a HTTP GET packet that shows the position and size in bytes of the TCP, IP and Ethernet proto-col headers. Note the range of the Ethernet header and the Ethernet payload that IP passes to Ethernet to send over the network. Note also the range of the IP header and the IP payload.To work out sizes, observe that when you click on a protocol block in the middle panel (the block itself, not the “+” expander) then Wireshark will highlight the bytes it corresponds to in the packet in the lower panel and display the length at the bottom of the window. For instance, clicking on the IP version 4 header of a packet in our trace shows us that the length is 20 bytes. (Your trace will be different if it is IPv6, and may be different even with IPv4 depend-ing on various options.) You may also use the overall packet size shown in the Length column or Frame detail block. AnswerFigure 9: Protocol layer structure of the HTTP GET packet There are several features to note:• The order of the headers (Ethernet, IP, TCP, HTTP) is the protocol stack from the bottom up-wards because the lower layers are outermost in the packet as it travels through the network. • Observant students will note some differences between the Ethernet header size in Wireshark and in the text that will be explored in later labs.• The size of the IP and TCP headers is normally around 20 bytes each, but it may be larger in some cases depending on the OS, e.g., IPv6 instead of IPv4 and optional TCP header fields might double these numbers.• The size of the HTTP message will vary depending on what tool and URL is used to send the web request. For wget/curl, it is likely to be around 100-300 bytes.• The Ethernet payload comprises everything beyond the Ethernet header. That is, Ethernet does not understand the IP / TCP / HTTP internal structure; it is up to higher layers to determine their headers and message boundaries.• Similarly, the IP payload comprises everything beyond the IP header. Note that neither the IP header nor payload covers the Ethernet header. HTTP EthernetIP TCP 14 bytes 20 bytes20 bytes 112 bytesEthernet header Ethernet payload166 bytes totalStart of packetIP header IP payloadStep 5: Demultiplexing KeysWhen an Ethernet frame arrives at a computer, the Ethernet layer must hand the packet that it contains to the next higher layer to be processed. The act of finding the right higher layer to process received packets is called demultiplexing. We know that in our case the higher layer is IP. But how does the Ethernet protocol know this? After all, the higher-layer could have been another protocol entirely (such as ARP). We have the same issue at the IP layer – IP must be able to determine that the contents of IP message is a TCP packet so that it can hand it to the TCP protocol to process. The answer is that proto-cols use information in their header known as a “demultiplexing key” to determine the higher layer. Look at the Ethernet and IP headers of a download packet in detail to answer the following questions:1.Which Ethernet header field is the demultiplexing key that tells it the next higher layer is IP?What value is used in this field to indicate “IP”?Answer. The demultiplexing key for Ethernet is the Type field. It holds 0x800 when the higherlayer is IP.2.Which IP header field is the demultiplexing key that tells it the next higher layer is TCP? Whatvalue is used in this field to indicate “TCP”?Answer: The demultiplexing key for IP is the Protocol field. It has value 6 when the higher layer is TCP.。