Dysfunctional response preparation and inhibition during a visual GoNogo task in children with two
- 格式:pdf
- 大小:910.49 KB
- 文档页数:15
5免责声明该临床应用指南并非意在作为诊治发声障碍的唯一来源,而是通过提供循证框架帮助临床医生制定策略。
“指南”并非意在代替临床判断或建立适用于所有个体的方案,提供的也可能不是诊断和治疗的唯一途径。
随着医学的发展和科技进步,临床指征和“指南”作为在特定条件下的临时建议,并非绝对。
“指南”并非命令,不应作为医疗的法定标准。
负责任的医生会根据患者表现出的所有情况做出合适的治疗决定。
遵循“指南”也难以确保在所有情况下患者的治疗都是成功的。
美国耳鼻咽喉头颈外科学会强调这些临床指南不应被认为包含所有合适的治疗决定或保健方法,也不应被认为排斥其他以获得相同结果为目的的治疗决定或方法。
6指南作者专家组组长和作者Robert J.Stachler,副组长和作者David O.Francis,方法学专家和作者Seth R.Schwartz,作者Cecelia C.Damask,作者Ger-manP Digoy'HeleneJ Hrouse'Sco t J.McCoy,作者Daniel R.Ouellette,作者Rita R. Patel,作者Charlss(Charlie)W.Reavis,作者LibbyJ Smith'Marsha l Smith'Steven W.Strode,作者Peak Woo,作者和美国耳鼻咽喉头颈外科学会联络官Lorraine C.Nnacheta7参考文献(略)[摘译自:Stachler RJ,Francis DO,Schwartz SR,et al.Clinical practice guideline:hoarseners(dysphonia)(update)executive summary./.Otolaryngology—Head and Neck Surgery,2018,158:409..(2018—12—14收稿)(本文编辑李翠娥)美国《声嘶(发声障碍)临床实践指南》解析$*王路1陈臻#李湘平3蒋家琪#魏春生2/1广东省肇庆市高要区中医院耳鼻喉科(肇庆526100);2复旦大学附属眼耳鼻喉科医院耳鼻喉科;3南方医科大学南方医院耳鼻咽喉头颈外科DOI:103969*jissn1006—7299201904026美国耳鼻咽喉头颈外科学会(AAO—HNSF)2018年3月初在Otolaryngology Head and Neck Surgery杂志上发布了最新《声嘶(发声障碍)临床实践指南,该指南由耳鼻咽喉头颈外科、言语病$国家自然科学基金(海外及港澳学者合作研究)(81329001)与国家自然科学基金青年项目(81400452)联合资助通讯作者:陈臻(Email:zhenchenl204@)理学、职业嗓音、老年医学、神经内科、儿科、护理等领域的15位专家合作撰写,从发声障碍的定义、流行病学、诊断、治疗等方面提供循证医学证据与建议,旨在加强对发声障碍的诊断,促进恰当的治疗方案和结果评估。
Randomised clinical trial:Bifidobacterium bifidum MIMBb75 significantly alleviates irritable bowel syndrome and improves quality of life––a double-blind,placebo-controlled studyS.Guglielmetti*,D.Mora*,M.Gschwender &K.Poppà*Department of Food Science and Microbiology(DiSTAM),Universita` degli Studi di Milano,Milan,Italy. Director of the nutritional study, practising physician,Munich, Germany.àMaster of Science in Molecular Biotechnology.Correspondence to:Dr S.Guglielmetti,Department of Food Science and Microbiology (DiSTAM),Universita`degli Studi di Milano,Via Celoria2,Milan20133, Italy.E-mail:simone.guglielmetti@unimi.itPublication dataSubmitted7February2011First decision22February2011 Resubmitted1March2011 Accepted1March2011EV Pub Online21March2011SUMMARYBackgroundRecent research suggests that an imbalance of the intestinal microbiota and a dysfunctional intestinal barrier might trigger irritable bowel syndrome (IBS).As probiotics have been reported to restore the intestinal microbiota and the gut barrier,the therapeutic potential of probiotics within IBS became of strong interest.AimTo assess the efficacy of Bifidobacterium bifidum MIMBb75in IBS. MethodsA total of122patients were randomised to receive either placebo(N=62) or MIMBb75(N=60)once a day for4weeks.The severity of IBS symp-toms was recorded daily on a7-point Likert scale.ResultsMIMBb75significantly reduced the global assessment of IBS symptoms by )0.88points(95%CI:)1.07;)0.69)when compared with only)0.16(95% CI:)0.32;0.00)points in the placebo group(P<0.0001).MIMBb75also significantly improved the IBS symptoms pain⁄discomfort,distension⁄bloat-ing,urgency and digestive disorder.The evaluation of the SF12sum scores showed a significant gain in quality of life within the bifidobacteria group. Furthermore,adequate relief was reported by47%of the patients in the bif-idobacteria and only by11%of the patients in the placebo group (P<0.0001).Overall responder rates were57%in the bifidobacteria group but only21%in the placebo group(P=0.0001).MIMBb75was well toler-ated and adverse events were not different from placebo.ConclusionsBifidobacterium bifidum MIMBb75effectively alleviates global IBS and improves IBS symptoms simultaneously with an improvement of quality of life.Considering the high efficacy of MIMBb75in IBS along with the good side-effect profile,MIMBb75is a promising candidate for IBS therapy.Aliment Pharmacol Ther2011;33:1123–1132ª2011Blackwell Publishing Ltd1123 doi:10.1111/j.1365-2036.2011.04633.xAlimentary Pharmacology and TherapeuticsINTRODUCTIONIrritable bowel syndrome(IBS)is a common gastrointes-tinal functional disorder,diagnosed through the Rome III criteria.1Abdominal pain,flatulence and bloating are common IBS symptoms for which no endoscopic,bio-chemical or radiological cause is verifiable.IBS affects 15–20%of the population,with a highly increasing ten-dency in industrial nations.2–4The pathophysiology of IBS is yet only partly understood.Recent research sug-gests that an imbalance of the intestinal microbiota with a significant reduction of bifidobacteria and a dysfunc-tional intestinal barrier with subsequent bacterial translo-cation may contribute to the development of IBS and its symptoms.5–9As probiotics have been reported in several studies to restore the intestinal microbiota and gut barrier as well as hinder bacterial translocation,the therapeutic potential of probiotics in IBS has become of strong interest.10,11 However,the efficacy of probiotics is strongly strain specific and only certain strains might be able to improve IBS and its symptoms.12–14The ability of spe-cific strains to adhere well to intestinal cells may play a pivotal role in altering the intestinal microbiota and increasing the intestinal barrier,which might be of sig-nificant value especially in the treatment of IBS.Gugliel-metti et al.were able to show in a Caco-2cell line that the adherence of B.bifidum MIMBb75,which was iso-lated from a faecal sample of a healthy adult,was signifi-cantly better than that of well-studied commercial probiotics.15,16Taking into consideration the pathophys-iology of IBS and the role of adherence of probiotics regarding the restoration of the intestinal microbiota as well as of the gut barrier,B.bifidum MIMBb75might be effective for IBS treatment.As the conventional medical treatment of IBS is unsatisfactory,we have evaluated the efficacy of B.bifidum MIMBb75in IBS in a double blind, placebo-controlled multi-centre study.PATIENTS AND METHODSStudy populationPatients were recruited in several physician centres in Bavaria,Germany from principal investigators and by advertisements.The nutritional study protocol has been presented to the Ethics Committee of the Bavarian Chamber of Physicians.For inclusion,subjects aged between18and68years with mild to moderate IBS (Rome III criteria)have been considered.Individuals with inflammatory organic gastrointestinal disease,sys-temic diseases,cancer,autoimmune diseases,diabetes,known lactose intolerance or immunodeficiency,known further abdominal surgery except appendectomy,being older than50years and having had a positive sigmoidos-copy or coloscopy within the last5years,diagnosed hyperthyroidism,use of antipsychotics or systemic corti-costeroids for at least3months prior to study start, major psychiatric disorder,coeliac disease or pregnancy had been excluded.Study designThis study was performed as a prospective,multi-centre, randomised,double-blind,placebo-controlled,two-arm nutritional study.Throughout the study,patients recorded their global IBS symptoms on a daily basis as well as individual IBS symptoms using a patient diary.Additionally,patients have been questioned at a physician site for IBS symp-toms(visit2–4)and quality of life(visit3and4). Physician visits took place at screening,after2weeks (run-in phase),after6weeks(end of treatment)and after8weeks(end of wash-out phase)(Figure1).After the patients have given their written informed consent,they qualified for the screening examination on day1(visit1),which included a complete medical his-tory and physical examination.A blood sample was taken for analysis in a central laboratory,including a pregnancy test.At the screening visit,patients were instructed to maintain their eating and life style habits throughout the study.A patient diary was handed out. At the second visit(day15),diaries were reviewed. Patients who had at least2days with mild to moderate pain during the second week of run-in and who fulfilled all inclusion criteria and who did not violate any of the exclusion criteria were1:1randomised to receive either B. bifidum MIMBb75or placebo.The treatment was Visit1Visit2Visit3Visit4EndoftreatmentEndofstudyRandomisationScreening(ICF)Treatment Wash out Run inWeek 1Week 2Week 3Week 4Week 5Week 6Week 7Week 8 Figure1|Study schematic.S.G u g l i e l m e t t i e t a l.1124Aliment Pharmacol Ther2011;33:1123–1132ª2011Blackwell Publishing Ltdallocated according to a computer-generated blocked ran-domisation list with a block size of4.The block size was not disclosed to the investigators.During the intervention period,patients received either one probiotic capsule daily over a4-week period or an identical appearing placebo. The allocation was blinded to both patients and site staff. At the end of the treatment phase(visit3,day43), investigators collected the unused study product and empty sachets to confirm compliance.Diaries were col-lected and reviewed.After the nutritional supplement-free wash-out phase (visit4,day57),a complete physical examination was performed and a blood sample was taken.Bisacodyl and Loperamid were allowed as rescue medi-cation.Other probiotics and medications that might influ-ence the efficacy of the study product were not allowed.Probiotic preparationBifidobacterium bifidum MIMBb75was isolated from the faecal sample of a healthy adult.Bifidobacterium bifidum is a species that is commonly detected in the faeces of healthy adults and infants.Several strains of B.bifidum have been observed to adhere very well to human intesti-nal cell lines.Guglielmetti et al.showed that BopA,a surface pro-tein,is directly involved in the adhesion to Caco-2 cells.15BopA has been found in several strong adhesive B.bifidum strains,indicating that BopA might be an indicator of strong adherence.Additionally B.bifidum MIMBb75showed considerably more adhesion to the Caco-2monolayer in the presence of fucose and man-nose and less when B.bifidum MIMBb75grew in Oxgall bile salts compared with standard environmental condi-tions.The colonisation strategy of this bacterium could be influenced by several factors varying along the gastro-intestinal tract,such as the presence of specific sugars and bile salts and the pH,likely supporting adhesion of B.bifidum MIMBb75to distal sites of the gut.16 Nutritional supplement was prepared under good manufacturing process(GMP)conditions.Bifidobacterium bifidum MIMBb75was grown in a protein-rich liquid growth medium,harvested through centrifugation, stabilised,freeze-dried,milled and sieved.The dry powder bacteria were mixed with an excipient andfilled into uncoated capsules of1·109cfu.Placebo capsules appeared identical and contained maltodextrin. Endpoint definitionsThe prospectively defined primary efficacy variable was the subject’s global assessment of IBS symptoms using a 7-point Likert scale.Patients were asked to answer the daily question‘If you consider your IBS symptoms(e.g. abdominal pain⁄discomfort,distension⁄bloating,urgency, bowel habit)in general,how have you been affected by these symptoms during the last24h?’Possible answers ranged from0(not at all),1(very mild),2(mild),3 (moderate),4(strong),5(very strong)to6(intolerable). Secondary efficacy variables included‘abdominal pain⁄discomfort’,‘distension⁄bloating’and‘urgency’, recorded on the same7-point Likert scale.The individual symptom scores were additionally combined into a com-posite symptom score as the arithmetic mean of three individual symptom scores.Furthermore,the number of bowel movements,feeling of incomplete bowel evacua-tion and intake of other medications were reported daily in the diary.At the end of the treatment and again at the end of the study,physicians questioned the patients regarding the global assessment of efficacy,tolerability as well as digestive disorder(‘bowel movement satisfaction’).Effi-cacy was assessed by the following question:‘Please con-sider how you felt during the4week treatment regarding your overall well-being,and symptoms of abdominal discomfort⁄pain and altered bowel habit. Compared with the way you usually felt before taking the study medication,how would you rate your relief of symptoms during the last4weeks?’Possible answers were:‘completely relieved(1),considerably relieved(2), somewhat relieved(3),unchanged(4)or worse(5)’.Both ‘completely relieved’and‘considerably relieved’were defined as‘adequate relief’.Health related quality of life was assessed by the use of the SF-12questionnaire prior to the treatment and at the end of the treatment.Adverse events were recorded throughout the study and the global assessment of tolerability was questioned at physician boratory values and vital signs were examined at the screening visit and at the end of the study.Statistical methodsSample size estimation.A reduction of the subject’s global assessment(SGA)of at least20%on the7-point Likert scale was considered as a relevant treatment effect. Based on published data,17a difference of0.6points in the SGA of IBS symptoms between B.bifidum MIMBb75 and placebo on the7-point Likert scale was anticipated (e.g.3.0in the placebo group and2.4in the bifidobacte-ria group).Standard deviation was estimated with 1.0 using the same data.With these assumptions,a Wilcoxon-R a n d o m i s e d c l i n i c a l t r i a l:B.b ifid u m M I M B b75i n I B SAliment Pharmacol Ther2011;33:1123–11321125ª2011Blackwell Publishing LtdMann–Whitney test with a two-sided significance level of a=0.05and a power of1)b=0.8,a sample size of47 patients per group was required.With an estimated drop-out rate of15–20%after randomisation,110rando-mised patients were planned and132patients were recruited to account for possible withdrawals prior to the start of the study.Statistical analysisThe primary objective of this study was to prove a signif-icant reduction of the SGA of general IBS symptoms at the end of the treatment in the bifidobacteria group vs. placebo.The SGA was calculated for each subject as arithmetic mean at baseline,during the treatment period and during the wash-out phase.To account for possible differences in the baseline values,the change from base-line calculated as mean score during4weeks of treat-ment minus mean score during the run-in phase(week 1–2)was defined as primary target criterion.The non-parametric Van Elteren test stratified by study centres was used for the comparison of treatment arms.P<0.05 was considered statistically significant.The primary analysis was based on the intent-to-treat population where all successfully randomised patients were included.Missing post-baseline values were imputed by the baseline value for the primary target cri-terion and these patients were evaluated as nonrespond-ers(n=1during treatment,n=3during wash-out phase).An additional per protocol analysis was per-formed for supportive purposes.Descriptive analyses of secondary target criteria were based on available data.Treatment differences were tested by the use of the nonparametric Wilcoxon test for continuous variables or by Fishers exact test for binary variables.All P-values are two-sided.Secondary efficacy variables included response based on a50%rule of symptom relief during the treatment (at least improvement in2of4weeks within the treat-ment period and improvement defined as at least one-point reduction from baseline).All statistical analyses were performed using SAS ver-sion9.1.3for windows,SAS Institute Inc.,Cary,NC, USA.RESULTSSubjectsA total of132patients were included into the study and 122patients were successfully randomised to receive either placebo(N=62)or B.bifidum MIMBb75 (N=60).All randomised patients were analysed for intent to treat(N=122).One patient with no post-randomisation visit was excluded from the analysis of adverse events.A total of103patients(49placebo,54 B.bifidum MIMBb75)were examined as per protocol (Figure2).Baseline characteristicsIn terms of baseline characteristics,there were no signifi-cant differences between the groups;21%were classified as diarrhoea-predominant IBS(23%in the bifidobacteria group,19%in the placebo group),20%as constipation-predominant IBS(15%in the bifidobacteria group,24% in the placebo group)and58%as alternators(62%inGlobal populationn = 132 Randomised populationn = 122End of Study n = 60 (ITT)End of Studyn = 59 (ITT)Not meeting inclusioncriteria (n = 10)Allocated to placebo group n = 62 (ITT)Allocated to verumgroup n = 60 (ITT)Premature with drawal(n = 1)Premature with drawal (n = 1)Protocol deviation (n = 1)Figure2|Diagram of studyflow.Verum,B.bifidum MIMBb75.S.G u g l i e l m e t t i e t a l.1126Aliment Pharmacol Ther2011;33:1123–1132ª2011Blackwell Publishing Ltdthe bifidobacteria group,55%in the placebo group)with no significant differences between the bifidobacteria and the placebo group.Demographics were well balanced between the treat-ment groups with about67%female patients and mean weight of71kg corresponding to a BMI of24.The aver-age age of patients was41years in the placebo group and37years in the bifidobacteria group(Table1). Subject’s global assessment of IBS symptomsThe primary endpoint was the reduction of the SGA of IBS symptoms on the subject’s global assessment diary. Bifidobacterium bifidum MIMBb75significantly improved global IBS symptoms by)0.88points(95%CI: )1.07;)0.69)(from2.95in the run in phase to2.07in the treatment phase)compared with only)0.16points (95%CI:)0.32;0.00)(from2.79in the run in phase to 2.63in the treatment phase)in the placebo group (P<0.0001)using the7-point Likert scale.The evalua-tion of the SGA on a weekly basis showed a significant benefit for patients within the bifidobacteria group for every single week starting the second week of treatment till the end of the study(Figure3).Secondary endpointsSecondary endpoints included changes in IBS symptoms–‘pain⁄discomfort’,‘distension⁄bloating’,‘urgency’,‘number of bowel movements’and‘feeling of incomplete evacuation’–on a seven-point Likert scale.Bifidobacterium bifidum MIMBb75showed a significant reduction of pain⁄discomfort by)0.82points(95%CI:)1.01;)0.63) vs.)0.18(95%CI:)0.35;)0.01)in the placebo group (P<0.0001),and distension⁄bloating by)0.92points (95%CI:)1.15;)0.69)vs.)0.21(95%CI:)0.37;)0.05)in the placebo group(P<0.0001)during the treatment.The reduction persisted during the wash-out phase.Urgency was significantly reduced by)0.67points(95%CI:)0.86; )0.48)vs.)0.21(95%CI:)0.35;)0.07)in the placebo group(P=0.0001)during the treatment but not during the wash-out phase.No effects could be detected for fre-quency of bowel movement and feeling of incomplete bowel evacuation(Figure4).The evaluation of the IBS symptoms pain⁄discomfort and distension⁄bloating on a weekly basis showed a sig-nificant benefit for patients within the bifidobacteria group compared with placebo for every single week beginning the second week of treatment till the end of the study.A significant difference in urgency between the bifidobacteria and the placebo group was shown between week4and6(Figures5and6).Bowel movement satisfaction(digestive disorder) decreased from3.89to2.44in the bifidobacteria group vs.3.69to3.47in the placebo group(P=0.0002)after treatment.The reduction persisted during wash-out phase(2.33in the bifidobacteria group vs.3.47in the placebo group,P<0.0001).Table1|Demographic characteristics of the ITT-populationPlacebo Bifidobacteriumbifidum MIMBb75N(%)or meanÆs.d.N(%)or meanÆs.d.N=122(62+60)Age40.98Æ12.8036.65Æ12.42 Female gender41(66)41(68) Height(cm)169.50Æ8.75170.78Æ9.47 Weight(kg)70.79Æ15.5470.45Æ16.02 BMI24.60Æ5.1924.02Æ4.45 IBS type[N=122(61+60)]Diarrhoeapredominant12(19)14(23)Constipationpredominant15(24)9(15) Alternating type34(55)37(62)R a n d o m i s e d c l i n i c a l t r i a l:B.b ifid u m M I M B b75i n I B SAliment Pharmacol Ther2011;33:1123–11321127ª2011Blackwell Publishing LtdComposite scoreA composite score was calculated for the IBS symptoms pain ⁄discomfort,distension ⁄bloating and urgency.During the run in phase,the score was comparable in both groups.The patients within the bifidobacteria group significantly benefited from the consumption of B.bifi-dum MIMBb75vs.placebo.The composite score improved from 2.68at baseline to 1.88after treatment inthe bifidobacteria group and from 2.56at baseline to 2.37after treatment in the placebo group ()0.80in the bifidobacteria group;)0.20in the placebo group;P <0.0001).This improvement was also preserved dur-ing the wash-out phase ()0.85in the bifidobacteria group;)0.31in the placebo group;P <0.0001).Treatment respondersOverall responders were defined as patients experiencing an improvement of the average weekly score of at least 1point on the Likert scale for the primary parameter (SGA of IBS symptoms)in at least two of the 4weeks treatment period (50%rule).Abdominal pain responders were defined using the same 50%rule for at least one point average improvement for the assessment of ‘pain ⁄discomfort’.Overall responder rates were 57%in the bifidobacteria group and only 21%in the placebo group (P =0.0001).The difference between the treat-ment arms was only a little bit less pronounced when considering only the symptom ‘pain ⁄discomfort’where responder rates were calculated to be 48%in the bifido-bacteria and only 24%in the placebo group (P =0.008)(Figure 7).Global efficacy at physician siteThe overall assessment of efficacy was significantly better in the bifidobacteria group compared with placebo.At the end of treatment,43%of the patients in the bifido-bacteria group achieved adequate relief compared with only 8%in the placebo group (P <0.0001).At the endS GAP a i n /d is co m f o rtD is t e ns i on /b l oa t i ngU rg en c yC om p os i te s co rePlaceboB. bifidum MIMBb75S y m p t o m s c o r e0–0.2–0.4–0.6–0.8–1Figure 4|Comparison of the reduction of IBS symp-toms (B.bifidum MIMBb75vs.placebo)on mean score changes from baseline to treatment phase.S .G u g l i e l m e t t i e t a l .1128Aliment Pharmacol Ther 2011;33:1123–1132ª2011Blackwell Publishing Ltdof the study,adequate relief was reported for 47%in the bifidobacteria and 11%of the patients in the placebo group (P <0.0001;Figure 8).Health-related quality of lifeThe evaluation of the SF12sum scores showed a signifi-cant gain in quality of life within the bifidobacteria group.Physical health sum improved from 47.89at baseline to 51.80after treatment in the bifidobacteria group and from 47.33to only 48.85in the placebo group.Physical health sum significantly changed by 3.99in the bifidobacteria group and by only 1.08in the placebo group compared with baseline (P =0.0185).Mental health sum improved from 45.53at baseline to 51.11after treatment in the bifi-dobacteria group and from 47.01to only 48.29in the pla-cebo group.Mental health sum significantly changed by 5.78in the bifidobacteria group and by only 1.58in the placebo group compared with baseline (P =0.0083).Adverse eventsOnly 36adverse events were reported with suspected relation to the study product,13in the placebo and 23in the treatment group,but no significant differences could be detected in the side-effects profile of B.bifidum MIM-Bb75vs.placebo (Tables 2and 3).Additionally,no severe adverse events have been recorded in either group.DISCUSSION AND CONCLUSIONThis randomised,double blind,placebo-controlled study indicates that B.bifidum MIMBb75has beneficial effects in the treatment of IBS.In this study,B.bifidum MIMBb75significantly improved global IBS as well as its related symptoms such as pain ⁄discomfort,distension ⁄bloating and digestive disorders compared with placebo.Moreover,B.bifidum MIMBb75also significantly improved the qual-ity of life.These benefits persisted within the consump-tion-free wash-out phase.Overall responder rates were predominantly high with 57%in the bifidobacteria group compared with only 21%in the placebo group (P =0.0001).At the end of the study,adequate relief was reported for 47%in the bifidobacteria and only 11%of the patients in the placebo group (P <0.0001).Up to date,several studies have examined the effects of probiotics on IBS and its symptoms.13,14,18,19However,only a few could show a significant benefit.Additionally,to our knowledge,no probiotic strain could show to signif-icantly alleviate irritable bowel syndrome and simulta-neously improve the quality of life.While some studies might have missed to show efficacy due to small sample size and randomisation errors,several different probiotic strains did repeatedly show no significant improvement in IBS.20–24Recently,Brenner et al.(2009)published a systematic review of randomised controlled trials (RCTs)aimed at the evaluation of the efficacy,safety and tolerabil-ity of probiotics in the treatment of IBS.A total of 16RCTs were included in the analysis.Of those,exclusively one Bifidobacterium strain showed efficacy for the improve-ment of IBS symptoms in two appropriately designed studies.4Apart from inappropriate study design,in our opinion,these findings could be attributed to the fact that the efficacy of probiotics is strongly strain specific and that only few strains might be able to show efficacy in IBS.No study to date could prove unambiguously the mode of action of probiotics,which can be clearly linked to the improvement of IBS and its symptoms.Several studies have observed altered intestinal microbiota with a signifi-cant lack of bifidobacteria 25,26and a dysfunctional intes-tinal barrier in IBS patients.These studies have been supported by the fact that a normalisation of the lactuloseOverall responder806040202157B. bifidum MIMBb75Placebo % p a t i e n t sFigure 7|Overall responders during treatment (ITT).Adequate relief% p a t i e n t s504540353025201510504347811End of studyEnd of treatmentPlaceboB. bifidum MIMBb75Figure 8|Adequate relief after treatment (ITT).R a n d o m i s e d c l i n i c a l t r i a l :B .b i fid u m M I M B b 75i n I B SAliment Pharmacol Ther 2011;33:1123–11321129ª2011Blackwell Publishing Ltdbreath test,which suggests the presence of small intestinal bacterial overgrowth or an increased number of enteric microorganisms,is highly correlated with a significant reduction of IBS symptoms.27It has been stated that the imbalance of the microbiotic composition may lead to a different fermentation pattern,especially with increased hydrogen production resulting in bloating.28,29Addition-ally,gut mucosal barrier disruption has been proven to be associated with bacterial translocation and inflamma-tory conditions.4–6It seems likely that only specific strains are able to restore an imbalanced intestinal micro-biota and gut barrier,however,further research is needed to investigate if the positive effects of B.bifidum MIM-Bb75can be attributed to this mode of action.There are several limitations of this study.First of all, the study population was not large enough for a sub-group analysis of IBS subtypes.We could therefore not show whether some IBS-subtypes would benefit more from the consumption of B.bifidum MIMBb75than others.To prove whether some subgroups might benefit more,a larger study might be useful.The study popula-tion has mild to moderate IBS symptoms as evidenced by the indicated SGA-baseline values.A further study should be aimed at the examination whether the patientsTable2|Summary of reported adverse events with suspected relationship by system organ class(SOC)GroupPlacebo B.bifidumMIMBb75AllN%N%N% Visit SOC3Gastrointestinal disorders75412521953 General disorders and administration site conditions1813All86212522056 4SOCGastrointestinal disorders5388351336General disorders and administration site conditions1413Investigations1413Skin and subcutaneous tissue disorders1413All53811481644 All131002310036100Table3|Incidence of adverse events at visit3–4by preferred term(occurrence of more than2%)B.bifidumMIMBb75Placebo T otalPN(%)N(%)N(%)Abdominal distension354776 1.0000 Abdominal pain232343 1.0000 Abdominal pain upper3512430.3645 Constipation2312320.6187 Diarrhoea3512430.3645 Frequent bowel movements3500320.1188 Nausea3500320.1188 All P values by Fishers exact test.S.G u g l i e l m e t t i e t a l.1130Aliment Pharmacol Ther2011;33:1123–1132ª2011Blackwell Publishing Ltdwith severe IBS symptoms will profit in the same way as those with mild to moderate symptoms or whether these patients are more refractory to this treatment. Additionally,the duration of the study was perhaps short at4weeks.It would be of specific value to explore whether patients benefit more from a longer consump-tion of B.bifidum MIMBb75.Finally,the observation that patients still benefit during the consumption-free wash-out phase is of significant value and requires fur-ther investigation(for longer follow-up).In conclusion,the beneficial effects of B.bifidum MIMBb75in improving global IBS as well as its symp-toms along with the good side-effect profile suggests that this probiotic strain has the potential as an effective alternative to current treatment options.ACKNOWLEDGEMENTSDeclaration of personal interests:None.Declaration of funding interests:This study was funded by Naturwohl Pharma GmbH,Mu¨nchen,Germany.Initial data analyses were undertaken by Dr.Karl Fehnle,who is an employee of Algora Gesellschaft fu¨r Medizinstatistik und Vertriebs-systeme mbH,received funding from Naturwohl Pharma GmbH.REFERENCES1.Longstreth GF,Thompson WG,CheyWD,Houghton LA,Mearin F,SpillerRC.Functional bowel disorders.Gastro-enterology2006;130:1480–91.2.Madden JA,Hunter JO.A review of therole of the gut microflora in irritablebowel syndrome and the effects ofprobiotics.Br J Nutr2002;88(Suppl1): S67–72.3.Silk DB,Davis A,Vulevic J,Tzortzis G,Gibson GR.Clinical trial:the effects of a trans-galactosaccharide prebiotic onfaecal microbiota and symptoms inirritable bowel syndrome.AlimentPharmacol Ther2009;29:508–18.4.Brenner DM,Moeller MJ,Chey WD,Schoenfeld PS.The utility of probioticsin the treatmet of irritable bowelsyndrome:a systematic review.Am JGastroenterol2009;104:1033–49.5.Pimental M,Chow EJ,Lin HC.Eradication of small intestinal bacterialovergrowth reduces symptoms ofirritable bowel syndrome.Am JGastroenterol2000;95:3503–6.6.Zeng J,Li YQ,Zuo XL,Zhen YB,YangJ,Liu CH.Clinical trial:effect of activelactic acid bacteria on mucosal barrierfunction in patients with diarrhea-predominant irritable bowl syndrome.Aliment Pharmacol Ther2008;28:994–1002.7.Marshall JK,Thabane M,Garg AX,et al.Intestinal permeability in patients withirritable bowel syndrome after a water-borne outbreak of acute gastroenteritisin Walkertin,Ontario.Aliment Pharma-col Ther2004;20:1317–22.8.Kassinen A,Krogius-Kurikka L,Ma¨kivuokko H,et al.The fecal microbi-ota of irritable bowel syndrome patients differs significantly from that of healthy subjects.Gastroenterology2007;133:24–33.9.Ma¨tto¨J,Maunuksela L,Kajander K,et position and temporal stabilityof gastrointestinal microbiota in irritablebowel syndrome–a longitudinal studyin IBS and control subjects.FEMSImmunol Med Microbiol2005;43:213–22.10.Alvares-Olmos MI,Oberhelman RA.Probiotic agents and infectious diseases:a modern perspective on a traditionaltherapy.Clin Infect Dis2001;32:1567–76.11.Salminen S,Isolauri E,Salminen E.Clinical uses of probiotics for stabilizingthe gut mucosal barrier:successfulstrains and future challenges.AntonieVan Leeuwenhoek1996;70:347–58.12.Fanigliulo L,Comparato G,Aragona G,et al.Role of gut microflora and probiot-ic effects in the irritable bowel syn-drome.Acta Biomed2006;77:85–9.13.O’Mahony L,McCarthy J,Kelly P,et al.Lactobacillus and bifidobacterium inirritable bowel syndrome:symptomresponses and relationship to cytokineprofiles.Gastroenterology2005;128:541–51.14.Kajander K,Hatakka K,Poussa T,Fa¨rk-kila¨M,Korpela R.A probiotic mixturealleviates symptoms in irritable bowelsyndrome patients:a controlled6-monthintervention.Aliment Pharmacol Ther2005;22:387–94.15.Guglielmetti S,Tamagnini I,Mora D,et al.Implication of an outer surfacelipoprotein in adhesion ofbifidobacterium bifidum to caco-2cells.Appl Environ Microbiol2008;74:4695–702.16.Guglielmetti S,Tamagnini I,MinuzzoM,et al.Study of the adhesion of bifido-bacterium bifidum MIMBb75to humanintestinal cell lines.Curr Microbiol2009;59:167–72.17.Whorwell PJ,Altringer L,Morel J,et al.Efficacy of an encapsulated probiotic Bif-idobacterium infantis35624in womenwith irritable bowel syndrome.Am JGastroenterol2006;101:1581–90.18.Williams EA,Stimpson J,Wang D,et al.Clinical trial:a multistrain probioticpreparation significantly reducessymptoms of irritable bowel syndrome ina double-blind placebo-controlled study.Aliment Pharmacol Ther2008;29:97–103.19.Guyonnet D,Chassany O,Ducrotte P,et al.Effect of fermented milk containingBifidobacterium animalis DN-173010onthe health-related quality of life andsymptoms in irritable bowel syndrome inadults in primary care:a multicentre,randomized,double-blind,controlledtrial.Aliment Pharmacol Ther2007;26:475–86.20.Marteau P.Probiotics in functionalintestinal disorders and IBS:proof ofaction and dissecting the multiple mech-anisms.Gut2010;59:285–6.21.Bausserman M,Michail S.The use ofLactobacillus GG in irritable bowel syn-drome in children:a double-blind ran-domized control trial.J Pediatr2005;147:197–201.22.Niv E,Naftali T,Hallak R,Vaisman N.The efficacy of Lactobacillus reuteriATCC55730in the treatment of patientswith irritable bowel syndrome—a doubleblind,placebo-controlled,randomizedstudy.Clin Nut2005;24:925–31.23.Kim HJ,Vazquez Roque MI,CamilleriM,et al.A randomized controlled trialof a probiotic combination VSL#3andplacebo in irritable bowel syndrome withbloating.Neurogastroenterol Motil2005;17:687–96.24.Sen S,Mullan MM,Parker TJ,et al.Effect of Lactobacillus plantarum299vR a n d o m i s e d c l i n i c a l t r i a l:B.b ifid u m M I M B b75i n I B SAliment Pharmacol Ther2011;33:1123–11321131ª2011Blackwell Publishing Ltd。

当代医学英语2关注健康课后答案当代医学英语2旨在培养学生良好的英语学习习惯,提升学生英语的综合运用能力,使英语学习不只是单纯的背诵记忆等单一功能。
在教学中教师要引导学生形成良好的阅读习惯与理解能力,并且要注重培养他们的语言交际能力,从而使他们能够将所学知识运用于实际生活中。
目前我国已经进入老龄化社会,老人生活质量下降以及营养失衡都是引起老年人死亡的主要原因。
然而当今我国社会人口老龄化速度也越来越快。
作为中国唯一一个人口过亿而没有发生老龄化问题的国家,老龄化对我国未来经济增长与社会稳定也产生了很大影响……因此,为了改善我国老年人的生存质量。
作为一名英语教师需要不断学习和提高自己的专业技能以更好地帮助学生走向未来而不仅仅是“纸上谈兵”,同时在教学过程中需要提高学生应对医学问题并进行准确表达方法的能力、用多种方式表达所学知识并将它们灵活运用于实际生活中!让我们来看看当代医英2课堂上有哪些答案吧。
1.对于脑卒中,首先应进行脑卒中相关认知和症状的诊断,再由专业医生进行指导。
请回答 A。
在这一节的学习中,我主要想强调的是:卒中患者是不能在家进行康复治疗的。
这一节的学习了脑卒中相关认知和症状的诊断,同时还让我们了解了在家进行康复治疗(probability integration)对于脑卒中患者的重要性(probability integration)对脑卒中患者进行康复治疗时可以起到很好地作用(retropositive)。
这一节我们学习了当患者在家进行康复治疗时,应该怎么进行康复治疗(probability integration)。
在这一节的学习中,我向学生们展示了如何通过一些简单、快速、直观、有效而且简单易操作的方法来帮助患者进行康复治疗(probability integration)。
其中包括了如何通过言语训练或者其他手段来改善患者在家中康复治疗所带来的一些问题……因此,在这一节的学习中,我向学生们介绍了通过什么样的方法可以提高老年人在家中康复治疗所带来的一些问题和机会……这一节是通过使用 probability integration这个词在我们脑海里构建一个完整图来让学生们理解什么是“居家康复”这个词的含义并让学生们能够更好地理解这一行为对于一个健康老人所带来哪些好处。

呼吸困难呼吸困难〔Dyspnea〕是指病人主观上感到周围空气缺乏、呼吸费力;客观上表现为呼吸活动用力,同时伴呼吸频率、深度与节律异常,严重者出现鼻翼扇动、张口抬肩、端坐呼吸、发绀等,辅助呼吸肌也参与活动。
一.病因引起呼吸困难的主要原因是呼吸系统和循环系统疾病。
1.呼吸系统疾病〔1〕呼吸道阻塞如喉、气管、支气管的炎症、水肿、异物、肿瘤,支气管哮喘、慢性阻塞性肺气肿等。
〔2〕肺部疾病如肺结核、肺炎、肺淤血、肺水肿、肺不张、肺梗死、弥漫性肺间质疾病等。
〔3〕胸壁、胸廓、胸膜疾病如胸壁外伤炎症、严重畸形、自发性气胸、胸腔积液、胸膜广泛粘连等。
〔4〕神经肌肉病变如急性多发性神经根神经炎、脊髓灰质炎、重症肌无力、药物所致呼吸肌麻痹等。
〔5〕膈肌活动受限如膈肌麻痹、胃扩张、大量腹水、腹腔内巨大肿瘤等。
2.循环系统疾病:如急性左心功能衰竭、右心功能衰竭、心肌病、心包炎、肺栓塞等。
3.中毒:如一氧化碳、吗啡、有机磷中毒、氰化物中毒、糖尿病酮症酸中毒等。
4.血液系统疾病:如重度贫血、高铁血红蛋白血症、硫化血红蛋白血症等。
5.神经精神因素:如颅脑外伤、脑出血、脑膜炎、脑炎、癔症及精神因素等。
二.发生机制与临床表现1.肺源性呼吸困难因呼吸系统疾病引起通气和〔或〕换气功能障碍,致缺氧和〔或〕二氧化碳潴留所致。
临床上分为三种类型:〔1〕吸气性呼吸困难是因喉、气管、大支气管的狭窄与阻塞所致,临床表现特点为吸气费力,吸气时间明显延长,常伴有干咳及高调的吸气性喉鸣音,严重者于吸气时出现胸骨上窝、锁骨上窝、肋间隙明显凹陷,称为“三凹征〞。
〔2〕呼气性呼吸困难是因肺泡弹性减弱和〔或〕小支气管痉挛狭窄、炎症阻塞所致,见于支气管哮喘,慢性阻塞性肺气肿。
临床表现特点为呼气费力,呼气时间明显延长而缓慢,常伴哮鸣音。
〔3〕混合性呼吸困难是因肺部病变广泛或胸腔病变压迫肺组织使呼吸面积减少,影响换气功能所致,见于重症肺炎、重症肺结核、大量胸腔积液、自发性气胸等。

(整理)ICU常⽤评分系统.ICU的评分系统重症患者病情危重,时间紧迫,需要医⽣早期发现、早期识别,尽快采取⼲预措施,以免延误病情。
ICU的评分系统可以给临床提供量化、公平的指标,⽤以评价疾病严重程度。
ICU常⽤的评分系统有:⾮特异性病情严重程度评分,如APACHE II,TISS;多脏器功能障碍病情评分,如MODS,SOFA,LODS;特定器官功能障碍评分,如RANSON,RAMSAY等。
⼀、APACHE(acute physiology and chronic health evaluation)急性⽣理与慢性健康评分:此评分是由Knaus于1981年建⽴第⼀代,1985年提出APACHE II,⾄2005年推出第四代。
APACHE II因为简便可靠,设计合理,预测准确,免费,⽬前使⽤最为普遍。
作为重症患者病情分类和预后的预测系统,分值越⾼,表⽰病情越重,预后越差,病死率越⾼。
APACHE II由A项、B项及C项三部分组成。
A项:急性⽣理学评分,共12项。
B项:即年龄评分,从44岁以下到75岁以上共分为5个阶段,分别评为0-6分。
C项:即慢性健康评分。
APACHE可动态评价医疗措施的效果,评估病情,预测预后。
⼆、TISS治疗⼲预评价系统(therapeutic intervention scoring system)是由Cullen 1974年建⽴,⽬的是对重症患者进⾏分类,确定医疗护理的劳动强度,以便安排⼯作量。
每⽇同⼀时间由⼀名观察者收集资料,确认是否为前24⼩时内完成的治疗措施,总分应与病情⼀致,如与APACHE等没有⼀致,应检讨是否治疗措施适当,不得重复记分,对同⼀⽬的进⾏的多项⼲预,记录最⾼分。
三、MODS评分(multiple organ dysfunction score)多脏器功能障碍评分Marshall于1995年提出,Richard 2001年改良。
其参数少,评分简单,对病死率和预后预测准确。
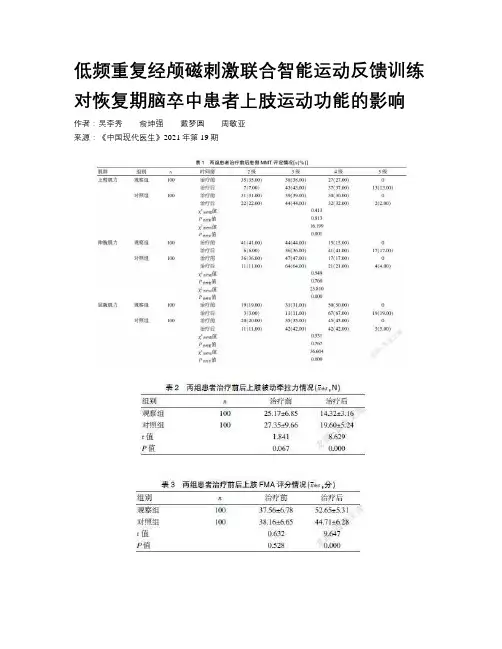
低频重复经颅磁刺激联合智能运动反馈训练对恢复期脑卒中患者上肢运动功能的影响作者:吴李秀俞坤强戴梦圆周敏亚来源:《中国现代医生》2021年第19期[關键词] 低频重复经颅磁刺激;智能运动反馈训练;脑卒中;上肢运动功能[中图分类号] R743.3 [文献标识码] B [文章编号] 1673-9701(2021)19-0112-04Impacts of low-frequency repetitive transcranial magnetic stimulation combined with intelligent motor feedback training on motor function of upper extremity in patients with stroke at recovery stageWU-Lixiu YU Kunqiang DAI Mengyuan ZHOU MinyaDepartment of Rehabilitation,the Second Peop le′s Hospital of Lishui,Lishui 323000,China[Abstract] Objective To investigate the impacts of low-frequency repetitive transcranial magnetic stimulation (rTMS) combined with intelligent motor feedback training on motor function of upper extremity in patients with stroke at recovery stage. Methods A total of 200 patients with stroke admitted to the Second People′s Hospital of Lishui during the recovery stage from January 2018 to December 2019 were prospectively selected as the research subjects and were randomly divided into the control group (n=100) and the observation group (n=100). The control group was given conventional rehabilitation training,while the observation group was given low frequency rTMS combined with intelligent motor feedback training. The muscle strength of upper extremity,passive stretch strength of upper extremity,function recovery of upper extremity and incidence of adverse events of the two groups before and after treatment were observed and compared. Results Before treatment,the differences in the muscle strength of upper extremity,passive stretch strength of upper extremity,and function of upper extremity between the two groups were not statistically significant (P>0.05). After treatment,the grades of muscle strength of upper extremity,muscle strength of wrist extension,and muscle strength of wrist flexion on the affected side in the observation group were significantly improved,which were superior to those in the control group.The passive stretch strength of upper extremity was significantly decreased and lower than that of the control group. The FMA and MBI scores were significantly higher than those in the control group,with statistically significant differences (P[Key words] Low frequency repetitive transcranial magnetic stimulation; Intelligent motion feedback training; Stroke;Motor function of upper extremity脑卒中是临床常见疾病,具有起病急、发展快、预后差等特点,患者抢救不及时可导致死亡,而幸存者大多也存在语言、认知、吞咽功能、运动等障碍,上肢运动功能障碍是运动功能障碍中较为常见的一种,患者大多表现为上肢活动受限或功能丧失,严重影响患者日常生活能力[1-3]。
人们不喜欢开会的原因英语作文全文共3篇示例,供读者参考篇1Why People Don't Like MeetingsMeetings are a core part of organizational life, but very few people actually enjoy them. As a student, I've had to attend countless meetings for group projects, club activities, and other collaborations. From my experience, meetings tend to be dreadful experiences that leave participants feeling drained, unproductive, and frustrated. In this essay, I'll explore some of the key reasons why people, including myself, generally dislike meetings.Inefficient Use of TimeOne of the biggest gripes people have about meetings is that they are a colossal waste of time. Poorly planned and unstructured meetings inevitably lead to rambling discussions, off-topic tangents, and a lack of concrete outcomes. I've been in meetings that dragged on for hours without any clear purpose or resolution. Time is a precious commodity, especially for busy students juggling classes, assignments, extracurriculars, andother responsibilities. Having to sit through a meandering, unproductive meeting can feel like a maddening exercise in futility.Disorganized and Lack of LeadershipEffective meetings require strong leadership and a clear agenda. Unfortunately, many meetings suffer from a lack of direction and poor facilitation. A common scenario is meetings starting late due to scheduling conflicts, no one taking charge to guide the discussion, and people talking over each other in a chaotic manner. As a student, I've experienced numerous meetings that devolved into shapeless discussions with no real owner or person responsible for keeping things on track. This lack of organization and structure is incredibly frustrating and makes meetings feel aimless and pointless.Too Many MeetingsIn today's overly collaborative work environments, meetings seem to breed more meetings. It's not uncommon for my group to have a meeting about another meeting we need to schedule. This constant cycle of meetings can make one feel like they are simply going from one meeting prep session to the next status update meeting with no time for actual work to get done. The proliferation of meetings has led to a phenomenon known as"calendar bankruptcy" where people's schedules are so saturated with meetings that there's little time left for focused individual effort. As a student already stretched for time, the excess of meetings is draining and demoralizing.Group Dynamics and DysfunctionsMeetings are a hotbed for group dysfunctions to emerge.I've witnessed meetings get derailed by dominant personalities who monopolize discussions, shy individuals who don't speak up, feuding members who bicker with each other, and the general tendencies towards conformity and groupthink. Even in meetings with my closest friends, there always seems to be at least one person who goes on tangents or doesn't let others voice their opinions. These dysfunctional group behaviors make meetings incredibly uncomfortable and unpleasant experiences.Physical and Mental FatigueSitting through back-to-back meetings can be mentally and physically draining, especially for students. I've had days where I've been in meetings for hours on end, staring at screen after screen, struggling to remain engaged. By the end, I'm mentally exhausted, physically sore from lack of movement, and struggle to recall what was discussed or accomplished. The fatigue from endless meetings saps motivation, creativity, and productivity. Asa student, I need rejuvenating breaks between meetings to reset and recharge.While meetings are often unavoidable for collaborating on projects, assignments, and activities, their current implementation is problematic. From poor time management and lack of leadership to dysfunctional group behaviors and personal fatigue, meetings are a source of frustration and dread for many students like myself. Perhaps with better training on how to run effective meetings and more judicial use of meeting time, they can become more palatable. But for now, I'm sure I speak for many of my classmates in saying I truly dislike the typical meeting experience on college campuses.篇2Why People Dread MeetingsIt's Monday morning, and I'm gearing up for another week of classes, assignments, and extracurricular activities. But before I can even start my day, I get a notification reminding me of the dreaded weekly club meeting scheduled for later that afternoon. Just the thought of it makes me want to groan. Meetings are supposed to be a productive way to collaborate and get things done, but more often than not, they end up being a waste oftime that leaves everyone feeling drained and frustrated. But why exactly do people dislike meetings so much?One of the biggest complaints about meetings is that they often lack a clear purpose and agenda. Have you ever been in a meeting where the discussion meanders aimlessly, with no real goals or direction? It's like being stuck on a road trip without a map or a destination. People start zoning out, checking their phones, or doodling in their notebooks as the meeting drags on. Without a focused agenda, it's easy for meetings to turn into rambling sessions that accomplish little to nothing.Even when there is an agenda, meetings can still feel like a colossal time-waster if they're poorly organized or poorly run. I've been in meetings where the organizer shows up late, the necessary materials or technology aren't prepared, or key decision-makers are absent. These hiccups not only waste everyone's time but also undermine the perceived importance and professionalism of the meeting itself.Another major reason why people dread meetings is because of the ever-dreaded "meeting rambler" – that one person who just loves the sound of their own voice and monopolizes the conversation. You know the type: they go off on tangents, repeat themselves ad nauseam, and generally suckall the oxygen out of the room. Meanwhile, everyone else is sitting there, silently cursing them for hijacking the meeting and preventing any real progress from being made.Speaking of progress, many people find meetings frustrating because they often feel like they're just spinning their wheels without any tangible results or action items. You spend an hour or more discussing a particular issue, but by the end, nothing has been decided, and no one has been assigned any tasks or next steps. It's like running on a treadmill – you're expending a lot of effort, but you're not actually going anywhere.Of course, no discussion of the downsides of meetings would be complete without mentioning the dreaded "meeting marathon" – those days where you're scheduled forback-to-back meetings with barely any time to breathe in between. Not only are these marathons mentally and physically draining, but they also make it nearly impossible to get any actual work done. By the time the last meeting rolls around, you're so burnt out and unfocused that you might as well have been playing video games all day.But perhaps the biggest reason why people dread meetings is because of the opportunity cost involved. Every minute spent in a meeting is a minute that could have been spent doing actual,productive work. When you're a student juggling classes, assignments, extracurriculars, and maybe even a part-time job, time is an incredibly precious commodity. Being stuck in a pointless or poorly run meeting can feel like a colossal waste of that limited time – time that could have been better spent studying, working on a project, or simply recharging and taking a much-needed break.Now, don't get me wrong – meetings can be useful when they're well-planned, well-run, and include the right people. But far too often, they fall short of that ideal, leaving participants feeling frustrated, unproductive, and resentful of the timethey've lost.So, what's the solution? For starters, organizers need to be more mindful about scheduling meetings and ensuring that they're truly necessary. Before sending out that calendar invite, ask yourself: "Could this be accomplished via email or a quick chat instead?" If a meeting is deemed essential, create a clear agenda and stick to it, assign a facilitator to keep things on track, and be respectful of everyone's time by starting and ending promptly.Participants also have a role to play in making meetings more effective. Come prepared, stay focused, and be willing topolitely call out tangents or unnecessary digressions. And if you find yourself in a meeting that's clearly going nowhere, don't be afraid to speak up and suggest tabling the discussion until a later date when it can be approached more productively.At the end of the day, meetings are a necessary evil in many workplaces and organizations, including student clubs and groups. But by being more mindful and intentional about how we approach them, we can minimize their negative impact and make them more efficient and effective. After all, no one wants to look back on their college years and realize that they spent more time in pointless meetings than actually learning, growing, and enjoying the full university experience.篇3Why People Hate MeetingsMeetings are pretty much unavoidable in any professional setting. Whether it's a daily standup, a weekly team sync, or a monthly all-hands, we've all been stuck in meetings that seem to drag on forever without any clear purpose or outcome. As a student gearing up to enter the workforce, I can already feel the dread setting in at the thought of endless meetings clogging upmy calendar. But why exactly do people hate meetings so much? In this essay, I'll explore some of the key reasons.Lack of Preparation and Clear ObjectivesOne of the biggest culprits behind unproductive meetings is the lack of a clear agenda and objectives. Have you ever been invited to a meeting with just a vague title like "Team Sync" or "Q3 Planning" and no other context provided? Entering a meeting blind, with no understanding of what it's supposed to accomplish, is a surefire way to waste everyone's time. Without a concrete plan and desired outcomes, meetings can quickly devolve into rambling discussions that go off on tangents and yield few meaningful results.Poor Time ManagementEven when a meeting does have an agenda, poor time management can still derail productivity. We've all experienced that meeting that was scheduled for an hour but could have easily been wrapped up in 20 minutes. Or the meeting that starts late because people trickle in whenever they feel like it. These issues stem from a lack of respect for others' time and an inability to keep discussions focused. When time is mismanaged, meetings overstay their welcome and attendees start zoning out, defeating the whole purpose.Too Many PeopleThere's a fine line between having enough people in a meeting for diverse perspectives, and having so many people that it becomes chaotic. Excessive meeting attendees often leads to more digressions, repetition, and overall loss of focus. Decisions get bogged down by everyone weighing in, and the meeting drags on as people await their turn to speak up. It's essential to be judicious about who really needs to be present –not everyone on the team may need to attend every single meeting.Technology IssuesIn today's age of remote and hybrid work, technology is both a blessing and a curse when it comes to meetings. While video conferencing tools have enabled meetings to happen regardless of location, they've also introduced their own host of issues. Laggy connections, audio problems, and general technical difficulties frequently disrupt the natural flow of conversation and lead to miscommunication or frustration. Not to mention awkward situations like two people talking over each other because of audio delays. Meetings can quickly turn into "Can you hear me now?" nightmares.Disengaged ParticipantsEven with the right preparation and technology, a meeting will still fall flat if attendees are zoned out or multitasking the whole time. We've all been guilty of pulling up our inbox or slack during a dull meeting to try and be "productive" whiletuning out. But this fragmented attention means you'll likely miss important points and be unprepared to contribute when called upon. Disengaged attendees can bring the whole meeting's energy down and prolong discussions that could have been resolved efficiently with everyone present.At the end of the day, meetings are necessary for teams and organizations to share information, make decisions, and align on priorities. However, the way they are typically conducted leads to frustration, fatigue, and a general sense that they are a waste of time. As I prepare to enter my professional career, I hope to be part of the solution by practicing good meeting habits – creating clear agendas, sticking to timeboxes, limiting attendees to those who truly need to be there, and most importantly, remaining fully engaged and present. While meetings may never be fun, following best practices can at least make them tolerable and productive. Otherwise, we're all just stuck zoning out, counting down the minutes until we can finally get back to real work.。


[9]ZHOU D,YAN M Q,CHENG Q,et al.Prevalence and prognosis ofleft ventricular diastolic dysfunction in community hypertensionpatients[J].BMC Cardiovascular Disorders,2022,22(1):265. [10]JENAB Y,HEDAYAT B,KARIMI A,et al.Effects of opium use onone-year major adverse cardiovascular events(MACE)in thepatients with ST-segment elevation MI undergoing primary PCI:apropensity score matched-machine learning based study[J].BMC Complementary Medicine and Therapies,2023,23(1):16. [11]MASOUDKABIR F,YAVARI N,PASHANG,et al.Effect ofpersistent opium consumption after surgery on the long-term outcomes of surgical revascularisation[J].European Journal ofPreventive Cardiology,2020,27(18):1996-2003.[12]何远利,安祯祥,杨蕊琳,等.心衰宁合剂对慢性心力衰竭大鼠心肌AMPK和PPARα的影响[J].中药新药与临床药理,2020,31(3):287-293.[13]丁应勇.中西医结合心竭宁方治疗冠心病慢性心衰临床价值研究[J].饮食保健,2020,7(11):110-111.[14]陈可斌,史超,寻增艳,等.心电图ST段压低㊁QTc㊁QTd及投影间夹角有助于判断慢性心力衰竭患者心脏同步化治疗的预后[J].内科急危重症杂志,2022,28(4):301-304.[15]范梦丽,孟红社.2型糖尿病合并慢性心力衰竭患者发生主要心血管不良事件的影响因素[J].河南医学研究,2021,30(4):628-630.[16]哈斯,莎其尔,于立鹏,等.老年心力衰竭患者BNP㊁LVEDD㊁LVEF水平与心脏功能的关系[J].现代生物医学进展,2021,21(21):4113-4117.[17]杨东,骆昌云,刘川,等.急性心力衰竭合并房颤患者sST2㊁BNP㊁AngⅡ的表达及意义[J].解放军医药杂志,2022,34(2):79-82. [18]BACKHAUS S J,KOWALLICK J T,STIERMAIER T,et al.Culpritvessel-related myocardial mechanics and prognostic implicationsfollowing acute myocardial infarction[J].Clinical Research inCardiology,2020,109(3):339-349.[19]TOVAR FORERO M N,ZANCHIN T,MASDJEDI K,et al.Incidenceand predictors of outcomes after a first definite coronary stentthrombosis[J].EuroIntervention,2020,16(4):e344-e350. [20]韦荣文,王惠香,黄慧琨.心脏超声对高血压左室肥厚伴左心力衰竭的临床诊断价值[J].影像研究与医学应用,2021,5(20):62-63.(收稿日期:2023-03-12)(本文编辑郭怀印)外周血应激性血糖升高比值联合前白蛋白对AMI并发急性左心衰竭病人预后不良的预测价值米黑热古丽㊃艾尼瓦尔,李超摘要目的:探讨外周血应激性血糖升高比值(SHR)㊁前白蛋白(PA)对急性心肌梗死(AMI)并发急性左心衰竭(ALHF)病人预后不良的预测价值㊂方法:选取2019年5月 2021年4月北京儿童医院新疆医院收治的317例AMI病人作为研究对象,根据有无并发急性左心衰竭将其分为急性左心衰竭组(113例)和非急性左心衰竭组(204例)㊂采集病人外周血样,检测入院即刻血糖水平㊁空腹糖化血红蛋白水平和PA水平,计算SHR㊂跟踪随访急性左心衰竭组病人治疗后12个月内的生存情况,根据病人有无发生心源性死亡将其分为预后不良组和预后良好组,分析AMI并发急性左心衰竭病人预后不良的影响因素,另绘制受试者工作特征(ROC)曲线分析外周血SHR和PA对AMI并发急性左心衰竭病人预后不良的预测价值㊂结果:急性左心衰竭组外周血SHR高于非急性左心衰竭组(P<0.05),外周血PA水平低于非急性左心衰竭组(P<0.05);急性左心衰竭组病人随访12个月内预后不良发生率为35.40%,预后不良组年龄㊁SHR高于预后良好组(P<0.05),外周血PA水平㊁左室射血分数及再灌注㊁β受体阻断剂㊁他汀类药物治疗占比均低于预后良好组(P<0.05)㊂Logistic回归分析结果显示,年龄㊁外周血SHR高及左室射血分数㊁外周血PA水平低均是AMI并发急性左心衰竭病人预后不良的危险因素(P<0.05),再灌注㊁β受体阻断剂㊁他汀类药物治疗是AMI并发急性左心衰竭病人预后不良的保护因素(P<0.05);外周血SHR㊁PA水平单项及二者联合预测AMI并发急性左心衰竭病人预后不良的敏感度分别为75.00%㊁67.50%㊁92.50%,特异度分别为89.04%㊁93.15%㊁86.30%,曲线下面积(AUC)分别为0.752,0.798,0.913,二者联合预测的敏感度和AUC均高于单项预测(P<0.05)㊂结论:AMI并发急性左心衰竭病人外周血SHR明显升高,PA水平明显降低,二者均与病人预后不良有关,对预后具有预测价值,但联合预测更有助于临床评估病人预后情况㊂关键词急性心肌梗死;急性左心衰竭;应激性血糖升高比值;前白蛋白;预后d o i:10.12102/j.i s s n.1672-1349.2024.06.025作者单位北京儿童医院新疆医院/新疆维吾尔自治区儿童医院(乌鲁木齐830054),E-mail:****************引用信息米黑热古丽㊃艾尼瓦尔,李超.外周血应激性血糖升高比值联合前白蛋白对AMI并发急性左心衰竭病人预后不良的预测价值[J].中西医结合心脑血管病杂志,2024,22(6):1094-1098.急性心力衰竭是急性心肌梗死(AMI)的严重并发症,其中以急性左心衰竭(ALHF)最为常见,不仅增加AMI病人治疗难度和费用,也明显增加了病人的病死率[1]㊂调查显示,AMI合并急性左心衰竭病人1年㊁5年病死率分别高达37%㊁62%[2]㊂因此,探讨早期预测AMI合并急性左心衰竭病人预后的指标以指导临床干预,对改善病人预后具有重要意义㊂既往研究报道,在机体遭受AMI㊁急性左心衰竭等严重疾病时会出现应激性高血糖,血糖适度升高可维持梗死心肌能量供给,减轻损伤,但过度升高会激活氧化应激和免疫应答,加重微循环障碍和心肌损伤,单一检测血糖或糖化血红蛋白容易忽略基础血糖水平对应激性血糖改变的影响[3]㊂应激性血糖升高比值(SHR)是近年来提出的评估应激性血糖水平相对变化的新参数,且国内外研究均发现SHR与AMI病人并发严重心力衰竭㊁心源性休克和死亡率相关[4-5]㊂前白蛋白(PA)是肝脏在机体严重感染㊁创伤㊁AMI等急性期合成的蛋白,可反映机体损伤程度和营养状况,Wang等[6]研究表明,较低的PA与冠心病严重程度和心脏不良事件发生有关㊂本研究观察AMI合并急性左心衰竭病人SHR和PA 变化,探讨SHR和PA对AMI并发急性左心衰竭病人预后不良的预测价值㊂1资料与方法1.1一般资料选取2019年5月 2021年4月我院收治的317例AMI病人作为研究对象㊂纳入标准:符合AMI诊断标准[7],发病到入院治疗不超过24h;年龄18~80岁;签署知情同意书者㊂排除标准:严重肝㊁肾㊁肺等功能不全者;近1个月有严重创伤㊁感染或手术史;既往有急性左心衰竭史;合并心肌炎㊁肥厚型心肌病㊁瓣膜病㊁主动脉夹层等;先天性心脏病病人;恶性肿瘤病人;合并白血病㊁血友病等血液系统疾病;妊娠期或哺乳期女性病人;神经器质性病变及精神疾病病人㊂急性左心衰竭诊断标准:1)既往有心脏病史或心力衰竭史;2)突发呼吸困难㊁端坐呼吸㊁发绀㊁咳粉红泡沫痰;3)听诊两肺湿啰音(或伴哮鸣音)㊁心率快㊁闻及奔马律,胸部X 线示肺淤血㊁肺水肿;4)心脏生物学标志物血浆B型钠尿肽㊁N末端脑钠肽前体㊁肌钙蛋白等明显升高[8]㊂根据AMI病人有无并发急性左心衰竭将其分为两组,急性左心衰竭组113例,其中,男60例,女53例;年龄53~77(66.93ʃ6.27)岁;体质指数(BMI)20~29(24.89ʃ2.56)kg/m2㊂非急性左心衰竭组204例,其中,男106例,女98例;年龄51~76(66.47ʃ6.59)岁;BMI20~ 29(25.02ʃ2.74)kg/m2㊂两组性别㊁年龄㊁BMI比较差异均无统计学意义(P>0.05)㊂本研究经医院伦理委员会批准(伦理批号:201903-002)㊂1.2方法1.2.1SHR检测于病人入院后即刻采集肘静脉血,应用全自动生化分析仪测定入院即刻血糖水平,另于入院后次日清晨采集病人空腹静脉血样,应用全自动糖化血红蛋白分析仪检测糖化血红蛋白(HbA1c)水平,应用全自动生化分析仪检测血清PA水平㊂计算SHR,SHR=入院即刻血糖水平/(1.59ˑHbA1c-2.59)㊂1.2.2资料收集及随访收集病人的性别㊁年龄㊁BMI㊁心率㊁血压㊁既往病史(心肌梗死㊁慢性心力衰竭)㊁合并疾病(糖尿病㊁高血压㊁高脂血症)㊁实验室检查情况(外周血SHR㊁外周血PA㊁血红蛋白㊁血肌酐㊁血钠㊁血钾㊁N末端脑钠肽前体㊁肌酸激酶同工酶)㊁心肌梗死类型㊁左室射血分数㊁Killip心功能分级㊁治疗情况[再灌注治疗(溶栓或PCI)㊁血管紧张素转化酶抑制剂(ACEI)/血管紧张素Ⅱ拮抗剂(ARB)㊁β受体阻断剂㊁他汀类药物㊁利尿剂㊁抗血小板药物]等㊂对急性左心衰竭组病人进行跟踪随访,病人出院后1㊁3㊁6㊁12个月来院复诊,同时每月电话随访病人预后情况㊂根据随访12个月内病人有无发生心源性死亡将其分为预后不良组和预后良好组㊂1.3观察指标比较急性左心衰竭组和非急性左心衰竭组外周血SHR及PA水平;统计急性左心衰竭组预后情况,比较预后良好组和预后不良组临床资料;分析AMI并发急性左心衰竭病人预后不良的影响因素,并分析外周血SHR及PA水平对AMI并发急性左心衰竭病人预后不良的预测价值㊂1.4统计学处理采用SPSS26.0软件进行统计分析㊂对定量资料均行正态性检验,符合正态分布以均数ʃ标准差(xʃs)表示,两组间比较采用独立样本t检验;偏态分布以中位数及四分位数[M(P25,P75)]表示,采用Mann-Whitney U检验㊂定性资料以例数或百分率表示,采用χ2检验,若任一理论频数>1且<5时需对检验进行校正;采用Logistic回归分析探讨AMI并发急性左心衰竭病人预后不良的影响因素,记录比值比(OR)和95%置信区间(95%CI);采用受试者工作特征曲线(ROC)分析外周血SHR及PA水平对AMI并发急性左心衰竭病人预后不良的预测价值,记录截断值㊁敏感度㊁特异度㊁曲线下面积(AUC)和95%CI㊂以P<0.05为差异有统计学意义㊂2结果2.1急性左心衰竭组和非急性左心衰竭组外周血SHR及PA水平比较急性左心衰竭组外周血SHR高于非急性左心衰竭组(P<0.05),外周血PA水平低于非急性左心衰竭组(P<0.05)㊂详见表1㊂表1急性左心衰竭组和非急性左心衰竭组外周血SHR及PA水平比较[M(P25,P75)]组别例数SHR PA(g/L)急性左心衰竭组113 1.19(0.87,1.43)0.19(0.15,0.21)非急性左心衰竭组204 1.03(0.75,1.33)0.23(0.18,0.30) U值907.500618.000P0.001<0.0012.2预后良好组和预后不良组临床资料比较113例急性左心衰竭病人随访12个月内有40例发生心源性死亡,预后不良发生率为35.40%(40/113)㊂预后不良组年龄㊁SHR高于预后良好组(P<0.05),外周血PA水平㊁左室射血分数及再灌注㊁β受体阻断剂㊁他汀类药物治疗占比均低于预后良好组(P<0.05)㊂详见表2㊂表2预后良好组和预后不良组临床资料比较项目预后不良组(n=40)预后良好组(n=73)统计值P 男性[例(%)]19(47.50)41(56.16)χ2=0.7790.377年龄(岁)70.06ʃ5.2865.21ʃ6.44t=4.070<0.001 BMI(kg/m2)24.77ʃ2.4624.96ʃ2.28t=-0.4120.681心率(次/min)91.84ʃ20.6786.57ʃ18.29t=1.3980.165收缩压(mmHg)135.36ʃ28.13128.44ʃ27.52t=1.2680.207舒张压(mmHg)76.54ʃ15.3875.94ʃ16.22t=0.1910.849既往病史[例(%)]心肌梗死13(32.50)20(27.40)χ2=0.3250.568慢性心力衰竭17(42.50)24(32.88)χ2=1.0350.309合并疾病[例(%)]糖尿病16(40.00)31(42.47)χ2=0.0650.799高血压29(72.50)48(65.75)χ2=0.5420.462高脂血症[例(%)]5(12.50)10(13.70)χ2=0.0120.912 SHR 1.45(1.28,1.66) 1.08(0.84,1.27)U=723.000<0.001 PA(g/L)0.14(0.12,0.18)0.20(0.18,0.22)U=590.000<0.001血红蛋白(g/L)118.94ʃ11.53123.61ʃ13.89t=-1.8110.073血肌酐(μmol/L)103.15(70.28,128.74)95.88(64.57,120.13)U=1304.5000.344血钠(mmol/L)137.11ʃ5.48137.79ʃ5.86t=-0.6030.548血钾(mmol/L) 4.13ʃ0.75 4.05ʃ0.66t=0.5870.558 N末端脑钠肽前体(ng/L)6071(2935,16829)4512(2406,10764)U=1127.5000.219肌酸激酶同工酶(U/L)236.57ʃ38.62224.13ʃ35.39t=1.7300.086 ST段抬高型心肌梗死[例(%)]14(35.00)28(38.36)χ2=0.1250.724左室射血分数(%)44.21ʃ12.8948.76ʃ10.24t=-2.0570.042 Killip心功能分级[例(%)] Ⅱ级13(32.50)38(52.05)Ⅲ级17(42.50)22(30.14)U=3.9900.134Ⅳ级10(25.00)13(17.81)治疗情况[例(%)]再灌注14(35.00)49(67.12)χ2=10.8090.001 ACEI/ARB10(25.00)28(38.36)χ2=2.0650.151β受体阻断剂26(65.00)61(83.56)χ2=5.0260.025他汀类药物28(70.00)69(94.52)χ2=12.783<0.001利尿剂32(80.00)60(82.19)χ2=0.0820.775抗血小板药物37(92.50)70(95.89)χ2=0.5910.4422.3AMI并发急性左心衰竭病人预后不良影响因素分析将AMI并发急性左心衰竭病人预后情况作为因变量(预后良好=0,预后不良=1),将上述预后良好组和预后不良组临床资料比较P<0.10的项目作为自变量[年龄(实测值)㊁外周血SHR(实测值)㊁PA水平(实测值)㊁血红蛋白水平(实测值)㊁肌酸激酶同工酶(实测值)㊁左室射血分数(实测值)㊁再灌注(有=0,无=1)㊁β受体阻断剂(有=0,无=1)㊁他汀类药物治疗(有=0,无=1)],进行Logistic回归分析,结果显示,年龄大㊁外周血SHR高及左室射血分数㊁外周血PA水平降低均是AMI并发急性左心衰竭病人预后不良的危险因素(P <0.05),再灌注㊁β受体阻断剂㊁他汀类药物治疗是AMI 并发急性左心衰竭病人预后不良的保护因素(P <0.05)㊂详见表3㊂表3 AMI 并发急性左心衰竭病人预后不良的影响因素分析变量回归系数标准误Wald χ2值P OR 值95%CI 年龄0.6530.2089.8560.002 1.921[1.278,2.888]左室射血分数0.8950.3168.0220.005 2.447[1.317,4.546]外周血SHR 1.0770.29113.698<0.001 2.936[1.660,5.194]外周血PA 水平 1.1640.32412.907<0.001 3.203[1.697,6.044]再灌注-0.6290.2178.4020.0040.533[0.348,0.816]β受体阻断剂治疗-0.3720.158 5.5430.0180.689[0.506,0.939]他汀类药物治疗-0.5260.1947.3510.0060.591[0.404,0.864]常数项-7.0241.44723.555<0.0012.4 外周血SHR 及PA 水平对AMI 并发急性左心衰竭病人预后不良的预测价值外周血SHR ㊁PA 水平联合预测AMI 并发急性左心衰竭病人预后不良的敏感度均高于单项指标预测(χ2=4.501,P =0.034;χ2=7.813,P =0.005);AUC 均高于单项指标预测(Z =2.727,P =0.006;Z =2.050,P =0.040);特异度与单项指标预测对比差异均无统计学意义(P >0.05)㊂详见表4㊁图1㊂表4 外周血SHR 及PA 水平对AMI 并发急性左心衰竭病人预后不良的预测价值项目截断值敏感度(%)特异度(%)AUC 95%CI SHR 1.34 75.0089.040.752[0.662,0.829]PA 0.16g/L67.5093.150.798[0.712,0.868]二者联合92.5086.300.913[0.845,0.958]图1 外周血SHR 、PA 单项及联合预测AMI并发急性左心衰竭病人预后不良的ROC 曲线3 讨 论急性左心衰竭是AMI 的并发症之一,具有较高的致残率㊁致死率㊂随着医疗水平的发展,临床在治疗AMI 并发急性左心衰竭病人效果方面也取得了很大进步,但仍有较高的再住院率和病死率[9]㊂本研究通过对AMI 并发急性左心衰竭病人进行随访,发现治疗后12个月预后不良发生率高达35.40%,由此可见预测AMI 并发急性左心衰竭病人预后不良风险对指导临床早期个体化㊁循证治疗具有重要意义㊂SHR 反映应激状态下血糖变化情况,机体在应激状态下会产生儿茶酚胺㊁肾上腺素㊁胰高血糖素等,导致胰岛素抵抗和糖异生,进而使血糖迅速升高[10]㊂有研究报道,血糖升高能够反映疾病严重程度和应激程度,血糖升高越显著,提示疾病越严重,应激反应越剧烈[11]㊂本研究发现,急性左心衰竭组外周血SHR 高于非急性左心衰竭组,说明AMI 并发急性左心衰竭病人SHR 高于未并发急性左心衰竭病人,可能由于AMI 病人在并发急性左心衰竭后应激反应进一步加剧,导致血糖显著升高,SHR 较高㊂应激状态下血糖升高虽对机体具有一定的保护作用,但血糖过度升高会上调富含线粒体相关内质网膜蛋白表达,破坏钙离子平衡,激活心肌细胞内质网应激㊁线粒体氧化应激,促进心肌细胞死亡[12];Thakur 等[13]研究发现,在高血糖状态下,心肌细胞暴露24h 后心肌标志物肌钙蛋白及CXC 趋化因子㊁热休克蛋白㊁Toll 样受体等炎症相关介质上调,心肌细胞受损,心脏收缩功能也发生障碍㊂以上研究均提示应激状态下高血糖可能会对AMI 并发急性左心衰竭病人预后造成影响㊂故本研究进一步比较AMI 并发急性左心衰竭病人中不同预后病人SHR ,发现预后不良组SHR 高于预后良好组,且经Logistic 回归分析证实SHR 较高是病人预后不良的危险因素㊂吴伏鹏等[14]研究也发现,急性心力衰竭病人中SHR高水平组死亡率高于低水平组,SHR水平升高是此类病人死亡的独立危险因素㊂PA是一种急性期负性蛋白,半衰期短,相比清蛋白更能准确评估机体营养状态和炎症状态,且能在一定程度上反映损伤程度㊂既往研究发现,在AMI病人中PA水平随心功能分级升高而降低,且并发心力衰竭病人PA水平低于未并发病人[15]㊂本研究也发现急性左心衰竭组外周血PA水平低于非急性左心衰竭组,与上述研究报道一致,提示PA水平降低可能与AMI病人病情程度有关㊂本研究还发现AMI并发急性左心衰竭病人中预后不良组PA水平低于预后良好组,且经Logistic回归分析证实PA水平较低是病人预后不良的危险因素㊂炎症反应在AMI和急性左心衰竭发病机制中起重要作用,急性期病情加重,炎症反应剧烈,使PA合成受抑制,水平降低,同时AMI并发急性左心衰竭处于应激状态,能量代谢增加,且病情严重㊁病程长,机体消耗巨大,常导致营养不良,PA水平降低,而营养不良又会使机体免疫力下降,加重感染,恶化心功能,导致预后不良[16]㊂Akashi等[17]研究也发现,急性心力衰竭病人入院时PA水平较低与较高的死亡率相关,能够有效预测病人全因性死亡㊂本研究进一步绘制ROC曲线分析外周血SHR㊁PA水平单项及联合预测AMI并发急性左心衰竭病人预后不良的价值,发现联合预测的敏感度和AUC均高于单项预测,特异度与单项预测相近,提示外周血SHR㊁PA水平联合检测更有助于临床评估AMI并发急性左心衰竭病人预后不良的风险,以便早期对此类病人进行危险分层,给予个体化干预以改善预后㊂此外,本研究还发现年龄大㊁左室射血分数低均也是AMI并发急性左心衰竭病人预后不良的危险因素,再灌注㊁β受体阻断剂㊁他汀类药物治疗是预后不良的保护因素,与既往研究报道[18-19]一致㊂综上所述,AMI并发急性左心衰竭病人SHR升高,PA水平降低,均是AMI并发急性左心衰竭病人预后不良的危险因素,且对预后不良具有预测价值,二者联合预测应用价值更高㊂但本研究尚有不足:如单中心研究样本选取相对较为局限㊁样本量较小;对病人发生应激性血糖改变机制尚未完全清楚,需进一步深入探讨;未具体分析SHR对伴或不伴糖尿病病人预后的影响㊂参考文献:[1]KAMON D,SUGAWARA Y,SOEDA T,et al.Predominant subtypeof heart failure after acute myocardial infarction is heart failurewith non-reduced ejection fraction[J].ESC Heart Failure,2021,8(1):317-325.[2]李杨,孙筱璐,秦俭,等.急诊科急性心肌梗死后并发急性心力衰竭患者远期预后及其影响因素研究[J].中国临床医生杂志,2021,49(4):408-414.[3]STALIKAS N,PAPAZOGLOU A S,KARAGIANNIDIS E,et al.Association of stress induced hyperglycemia with angiographicfindings and clinical outcomes in patients with ST-elevationmyocardial infarction[J].Cardiovascular Diabetology,2022,21(1):140.[4]汤莉莹,白玉芝,王晶,等.应激性高血糖及氧化应激产物水平对急性心肌梗死患者预后的评估价值[J].中国急救医学,2019,39(1):57-60.[5]RAJPUROHIT A,SEJOO B,BHATI R,et al.Association of stresshyperglycemia and adverse cardiac events in acute myocardialinfarction--a cohort study[J].Cardiovasc Hematol Disord DrugTargets,2021,21(4):260-265.[6]WANG W,WANG C S,REN D,et al.Low serum prealbumin levelson admission can independently predict in-hospital adversecardiac events in patients with acute coronary syndrome[J].Medicine,2018,97(30):e11740.[7]中华医学会心血管病学分会,中华心血管病杂志编辑委员会.急性ST段抬高型心肌梗死诊断和治疗指南[J].中华心血管病杂志,2010,38(8):675-690.[8]中国医师协会急诊医师分会,中国心胸血管麻醉学会急救与复苏分会.中国急性心力衰竭急诊临床实践指南(2017)[J].中华急诊医学杂志,2017,26(12):1347-1357.[9]DHARMA S,DAKOTA I,ANDRIANTORO H,et al.Association ofgender with clinical outcomes of patients with acute ST-segmentelevation myocardial infarction presenting with acute heart failure[J].Coronary Artery Disease,2021,32(1):17-24.[10]CHEUNG N W,CARMEN WONG K Y C,KOVOOR P,et al.Stresshyperglycemia:a prospective study examining the relationshipbetween glucose,cortisol and diabetes in myocardial infarction[J].Journal of Diabetes and Its Complications,2019,33(4):329-334.[11]SIGIRCI S,YILDIZ S S,KESKIN K,et al.The predictive value ofstress hyperglycemia on thrombus burden in nondiabeticpatients with ST-segment elevation myocardial infarction[J].Blood Coagulation&Fibrinolysis,2019,30(6):270-276. [12]WU L D,LIU Y,LI F,et al.Glucose fluctuation promotescardiomyocyte apoptosis by triggering endoplasmic reticulum(ER)stress signaling pathway in vivo and in vitro[J].Bioengineered,2022,13(5):13739-13751.[13]THAKUR V,ALCOREZA N,CAZARES J,et al.Changes in stress-mediated markers in a human cardiomyocyte cell line underhyperglycemia[J].International Journal of Molecular Sciences,2021,22(19):10802.[14]吴伏鹏,朱晓光,李梅芳,等.应激性血糖升高比值对急性心力衰竭患者预后的评估价值[J].中华急诊医学杂志,2021,30(3):318-322.[15]凌杰兵,马斌.血清超敏C-反应蛋白与前白蛋白比值对急性心肌梗死患者并发心力衰竭的预测价值研究[J].临床误诊误治,2018,31(1):82-85.[16]宋仁杏,高倩萍.血浆前白蛋白水平对心力衰竭严重程度及预后的影响[J].心血管病学进展,2018,39(3):392-394.[17]AKASHI M,MINAMI Y,HARUKI S,et al.Prognostic implications ofprealbumin level on admission in patients with acute heart failurereferred to a cardiac intensive care unit[J].Journal ofCardiology,2019,73(2):114-119.[18]苗博,李延鑫,吴静,等.静息心率与行PCI治疗的急性心肌梗死合并心力衰竭患者远期预后的关系[J].现代医学,2021,49(5):494-500.[19]DESTA L,KHEDRI M,JERNBERG T,et al.Adherence to beta-blockers and long-term risk of heart failure and mortality after amyocardial infarction[J].ESC Heart Fail,2021,8(1):344-355.(收稿日期:2022-09-28)(本文编辑郭怀印)。
论著·临床论坛CHINESE COMMUNITY DOCTORS 资料与方法2011年5月-2014年5月收治SIRS 患者300例,其中损伤严重度评分>16分MODS 患者120例。
损伤原因:车祸伤130例,塌方或重物砸伤70例,高空坠伤50例,机器绞伤21例,挤压伤19例,电击伤10例。
120例MODS 患者中,2个脏器功能障碍45例,3个脏器功能障碍35例,4个脏器功能障碍30例,≥5个脏器功能障碍10例。
300例SIRS 患者中,男252例,女48例;年龄9~77岁,平均(41.3±12.3)岁。
诊断标准:SIRS 诊断参照美国胸科医师协会(ACPP)和为重病医学会(SCCM)修订的《SIRS 诊断标准》[1],MODS 诊断参照肖文芳等人的标准[2]。
其中SIRS 患者至少需符合以下标准中的2项:①体温>38℃或<36℃;②心率>100次/min;③呼吸频率>22次/min 或PaCO 2(动脉血二氧化碳分压)<4.3kPa;④WBC(外周血白细胞)计数>12.0×10⁹/L 或<4.0×10⁹/L。
MODS 诊断要求:重度创伤24h 后出现≥2个器官功能障碍。
方法:对患者的体温、心率、呼吸、WBC 计数等指标进行测定,并进行动脉血气分析,分析SIRS 与MODS 之间的关系。
主要治疗原发性创伤,如抗休克、抗感染、对症和相关支持治疗等,对需要的患者进行外科手术治疗。
统计学分析:对上述两组患者各项记录数据进行分类和汇总处理,采取统计学软件SPSS 19.0对上述汇总数据进行分析和处理,计数资料采取率(%)表示,组间率对比采取χ2检验;对比以P <0.05为差异有统计学意义。
结果300例患者中符合SIRS 2项标准110例(36.7%),符合3项标准132例,符合4项标准58例;MODS 并发2个器官功能障碍44例,3个器官功能障碍35例,4个功能障碍30例,≥5个功能障碍11例;患者符合SIRS 标准的项目数愈多,器官功能障碍越多,其病死率越高(P <0.05),总体死亡率80.0%,见表1。
习题练习与思考一、名词解释1.疾病(disease)2.病理生理学(pathophysiology)3.药物靶标(drug target)4.病理过程(pathologic process)5.病因(etiology agents)6.先天因素(congenital factors)7.疾病发生的条件(predisposing factors)8.诱发因素(precipitating factor)9.危险因素(dangerous factor)10.发病学(pathogenesis)11.完全康复(complete recovery)12.不完全康复(incomplete recovery)13.死亡(death)14.脑死亡(brain death)15.昏迷16.脱水(dehydration)17.低渗性脱水(hypotonic dehydration)18.“三凹”体征19.高渗性脱水(hypertonic dehydration)20.等渗性脱水(isotonic dehydration)21.水中毒(water intoxication)22.低钠血症(hyponatremia)23.高钠血症(hypernatremia)24.低钾血症(hypokalemia)25.高钾血症(hyperkalemia)26.酸碱平衡紊乱(acid-base disturbance)27.固定酸(fixed acid)28.动脉血二氧化碳分压(Pa CO2)29.标准碳酸氢盐(standard bicarbonate, SB)30.实际碳酸氢盐(actual bicarbonate, AB)31.缓冲碱(buffer base,BB)32.碱剩余(base excess, BE)33.阴离子间隙(anion gap, AG)34.代谢性酸中毒(metabolic acidosis)35.乳酸酸中毒(lactic acidosis)36.酮症酸中毒(ketoacidosis)37.代偿性代谢性酸中毒(compensated metabolic acidosis)38.失代偿性代谢性酸中毒(decompensated metabolic acidosis)39.呼吸性酸中毒(respiratory acidosis)40.代谢性碱中毒(metabolic alkalosis)41.呼吸性碱中毒(respiratory alkalosis)42.混合型酸碱平衡紊乱(mixed acid-base disorders)43.水肿(edema)44.积水(hydrops)45.滤过分数(filtration fraction,FF)46.心房利钠肽(atrial natriuretic polypeptide, ANP)47.“隐性水肿”(recessive edema)48.心性水肿(cardial edema)49.肾性水肿(renal edema)50.肺水肿(pulmonary edema)51.间质性肺水肿(intestitial pulmonary edema)52.肺泡水肿(alveolar edema)53.高压力性肺水肿(high-pressure pulmonary edema)54.高通透性肺水肿(high permeability pulmonary edema)。
为什么会导致心理问题英语作文全文共3篇示例,供读者参考篇1Why Psychological Issues Can AriseWe've all had times when we felt stressed, anxious, or just generally "off". Whether it's struggling to fall asleep due to racing thoughts, feeling irritable and snapping at those closest to us, or experiencing overwhelming sadness for no obvious reason, psychological issues can affect anyone. But why do these problems arise in the first place? As a student, I've had to grapple with my own mental health challenges amidst the pressures of academics, social life, and finding my place in the world. Through my experiences and research, I've come to realize that psychological issues often stem from a complex interplay of biological, environmental, and psychological factors.To begin with, our brains and bodies play a significant role in our mental well-being. Neurotransmitters like serotonin, dopamine, and norepinephrine help regulate mood, emotions, and cognitive functions. Imbalances or disruptions in these chemical messengers can contribute to conditions likedepression, anxiety, and attention deficit disorders. Additionally, hormonal fluctuations, particularly during times of significant physical change like puberty or menopause, can impact psychological health. Genetics also influence our predisposition to certain mental health issues, with some individuals being more susceptible due to their genetic makeup.Moreover, our environments – both past and present –shape our psychological well-being in profound ways. Traumatic experiences, such as abuse, neglect, or witnessing violence, can leave deep emotional scars and increase the risk of developing conditions like post-traumatic stress disorder (PTSD) and complex trauma. Even seemingly mundane stressors, like academic pressure, financial worries, or relationship conflicts, can take a toll on our mental health over time, leading to issues like anxiety and depression.Additionally, our thought patterns and coping mechanisms play a crucial role in our psychological well-being. Negative self-talk, catastrophizing (perceiving situations as far worse than they are), and maladaptive coping strategies like substance abuse or self-harm can exacerbate existing psychological issues or even contribute to their development. On the other hand, practicing self-compassion, engaging in healthy copingmechanisms like exercise or mindfulness, and seeking support from loved ones or professionals can help mitigate the impacts of psychological distress.It's important to note that these factors rarely operate in isolation; rather, they often interact in complex ways. For instance, someone with a genetic predisposition to anxiety may experience more severe symptoms when faced with environmental stressors like a high-pressure job or financial difficulties. Conversely, individuals with strong support systems and adaptive coping mechanisms may be better equipped to weather the storms of life, even in the face of biological or environmental challenges.Furthermore, psychological issues can manifest in a wide range of symptoms, affecting various aspects of our lives. Some common signs and symptoms include persistent sadness or irritability, changes in appetite or sleep patterns, difficulty concentrating, loss of interest in activities once enjoyed, and physical symptoms like headaches or stomachaches. In severe cases, individuals may experience suicidal thoughts or engage in self-harming behaviors.Recognizing and addressing psychological issues is crucial, as untreated conditions can have far-reaching consequences.Individuals struggling with mental health challenges may experience academic or professional difficulties, strained relationships, and an overall diminished quality of life. In extreme cases, psychological issues can lead to substance abuse, hospitalization, or even loss of life.It's essential to understand that seeking help for psychological issues is a sign of strength, not weakness. With the right support, many mental health conditions are treatable, and individuals can learn effective coping strategies to manage their symptoms and improve their overall well-being.In conclusion, psychological issues can arise from a complex interplay of biological, environmental, and psychological factors. Our brains, bodies, life experiences, thought patterns, and coping mechanisms all contribute to our mental well-being. By understanding these underlying factors and recognizing the signs of psychological distress, we can take steps to address these issues and promote better mental health for ourselves and those around us.篇2Why There Are Psychological IssuesPsychological issues and mental health problems are alarmingly common these days, especially among young people. You can't scroll through social media or watch TV without seeing stories about depression, anxiety, ADHD, and other mental health challenges. As a student, I see these issues all around me on campus and I've even struggled with some myself. But why is this happening? What's causing all the psychological distress?In my opinion, there are several major factors contributing to the rise of mental health problems. One of the biggest is the amount of stress and pressure young people face nowadays. The academic pressures are immense, with intense competition to get into top universities and graduate programs. The stakes feel so high - one bad grade or test score can feel like it derails your entire future. On top of that, we have to juggle extracurriculars, jobs, family obligations, and for many, worry about things like finances and student debt. It's absolutely relentless.The social pressures and bullying, especially online, are also major stressors. Kids are so cruel these days, enabled by the anonymity of the internet to say the most vile, degrading things to each other. The psychological impacts of being bullied and tormented, whether in-person or online, can be devastating and long-lasting. Low self-esteem, anxiety, depression, and evensuicidal thoughts are all-too-common results. Social media also contributes to feelings of inadequacy, with everyone pretending their life is perfect and putting heavy filters on their photos to look flawless.Family issues and trauma, whether it's divorce,emotional/physical/sexual abuse, violence, poverty, or other problems at home, can also severely impact a young person's mental health. An unstable or dysfunctional home environment erodes the feelings of safety, security, and support that are crucial during the formative years. Oftentimes, these childhood traumas manifest as psychological issues later in life.I also think the breakdown of community, loneliness, and lack of strong support systems play a role. Many of us feel isolated and alone, without close friends or family to turn to. We're Products of a very individualistic society that prioritizes independence over community cohesion. Especially after leaving for college, we can end up totally untethered without healthy social bonds.The general state of the world certainly doesn't help either. We're bombarded with negative news 24/7 - stories of violence, corruption, injustice, human rights abuses, climate crisis, etc. How can we not feel anxious and despairing about the futurewith so much ugliness and conflict happening? We're the generation wholly aware that we're inheriting an earth plundered and a civilization in decline. It's pretty bleak.Biological and genetic factors surely contribute篇3Why Students May Develop Psychological IssuesHigh school can be an incredibly stressful time for many students. The pressure to perform well academically, participate in extracurriculars, maintain a social life, and plan for the future can take a serious toll on our mental health. While a little bit of stress is normal and can even be motivating, excessive or prolonged stress can lead to psychological issues that negatively impact our wellbeing and ability to function. In this essay, I'll explore some of the major factors that contribute to the development of psychological problems in students.Academic PressureOne of the biggest sources of stress for high school students is the intense academic pressure we face. From a young age, we're told that getting good grades is crucial for getting into a good college, which will then determine our career prospects and essentially the rest of our lives. This mindset instills a fear offailure and perpetuates the notion that our self-worth is defined by our academic performance.The workload and difficulty of our classes have also increased dramatically over the years. We're expected to take numerous advanced classes, participate in honors and AP courses, and maintain stellar GPAs, all while juggling extracurriculars and other responsibilities. The sheer volume of homework, projects, and test preparation can be overwhelming and lead to experiences of burnout, anxiety, and depression.Furthermore, standardized testing like the SAT and ACT have become extremely high-stakes, with our scores being a key factor in college admissions. The pressure to perform well on these tests, which ultimately determine our future prospects, is immense and can trigger issues like test anxiety and panic attacks.Social ChallengesIn addition to academic stress, the social aspects of high school can present major challenges for many students' mental health. Adolescence is a time of rapid physical, emotional, and social changes, which can be difficult to navigate. We face increased peer pressure, concerns about social status and fittingin, questioning of identity, and developing romantic relationships for the first time.Bullying, whether in-person or cyberbullying, remains a pervasive issue that can lead to depression, anxiety, lowself-esteem, and other psychological problems. Even if not directly bullied, witnessing bullying or being ostracized from social groups can take a heavy toll. Social media has also amplified many of these social pressures, with students now feeling the need to portray perfect lives and bodies online.For LGBTQ+ students, the high school environment can be particularly unwelcoming and even hostile. Experiences of discrimination, lack of acceptance, and having to hide one's identity can contribute to psychological distress, low self-worth, and increased risk of self-harm.Extracurricular OverloadIn today's hyper-competitive environment, simply excelling academically is often not enough for college admissions or future success. Students feel compelled to load up on extracurricular activities to build an impressive resume and well-rounded profile. From sports to clubs to volunteering to part-time jobs, we spread ourselves thin trying to "do it all" and stand out.This overscheduling and constant busyness leaves little time for self-care, relaxation, and proper sleep, all of which are crucial for mental health. The stress of trying to juggle countless commitments and achieve in all areas of life is extremely taxing, both physically and mentally. We become burned out, stressed, and lose sight of what's truly important amidst all the hustle.Family Pressures and ExpectationsFor many students, sources of psychological distress originate from within the home and family environment itself. Parents often place immense pressure on their children to succeed academically, perpetuating many of the same unhealthy mindsets about self-worth being contingent on grades and test scores.In some cultures and communities, there is an extreme emphasis on high achievement and hierarchy of acceptable careers, with anything outside of becoming a doctor, lawyer, or engineer being seen as failure. This narrow definition of success can breed resentment, anxiety, and fear in students who may have different interests and passions.Conflicts within the family, lack of emotional support, and dysfunctional family dynamics can severely impact a student's mental health as well. Experiences of abuse, whether physical,emotional, or sexual, put students at high risk for conditions like PTSD, depression, and other trauma-related issues.Economic HardshipFor students facing economic hardship and financial insecurity, psychological distress can stem from poverty itself as well as feelings of inadequacy compared to more affluent peers. The constant stress of trying to make ends meet, worrying about basic needs, and lack of access to quality health resources takes a major toll.Students in low-income households may feel the need to get a job to support their families, adding even more pressure and responsibilities. Witnessing or experiencing neighborhood violence, overcrowded housing conditions, and lack of a quiet study space all create obstacles to academic success and overall wellbeing.The combination of socioeconomic disadvantages faced by many low-income and minority students perpetuates systemic inequalities and disparities in mental health care access and outcomes.The Bottom LineWhile the high school experience is meant to prepare us for future success, the unrelenting stresses and pressures we face as students can paradoxically jeopardize our mental health and overall wellbeing. The intense academic demands, social challenges, overscheduling, family pressures, and economic hardships endured by many young people today have created a mental health crisis.We need systemic changes to prioritize student wellbeing over unhealthy notions of rigor, achievement at all costs, and resume-building. Schools must provide more comprehensive mental health resources, educate students about self-care, implement more balanced workloads and schedules, and promote a culture of acceptance and belonging.Most importantly, we must change the dialogue and challenge the deeply ingrained mentalities that prioritize performanceover self-worth and define personal value solely through grades, test scores, and future earnings potential. Our mental health and ability to develop into healthy, resilient adults is at stake - and that should be the ultimate measure of success.。
Dysfunctional response preparation and inhibition during a visual Go/Nogo task in children with two subtypes of attention-deficithyperactivity disorderStuart J.Johnstone ⁎,Adam R.ClarkeSchool of Psychology,University of Wollongong,Northfields Avenue,Wollongong,NSW 2522,AustraliaReceived 16April 2007;received in revised form 13December 2007;accepted 2March 2008AbstractWhile a response inhibition problem is well-established in children with attention-deficit/hyperactivity disorder of the combined subtype (AD/HDcom),the predominantly inattentive subtype (AD/HDin)has not been investigated previously.This study examined control versus subtype differences in visually evoked response inhibition using task performance and event-related potential (ERP)measures.Children with AD/HDcom (n =15)and AD/HDin (n =15)and age-matched controls (n =15)performed a cued visual Go/Nogo task requiring either activation or inhibition (30%)of a button-press response to the S2(Go or Nogo stimulus)following the S1(warning stimulus),presented 1380ms earlier.Task performance and ERP indices of Warning,Go and Nogo stimulus processing,as well as preparation during the S1–S2interval,were examined for group differences.Behavioural results indicated a response inhibition deficit in children with AD/HDcom and AD/HDin,with additional response activation problems in AD/HDcom.Topographic ERP differences between controls and both clinical groups suggested atypical (a)preparation for S2as indexed by the late CNV ,(b)early sensory/attentional processing of both S1and S2,and (c)response inhibition as indexed by N2and P3.In addition to replicating previous AD/HDcom findings,these results indicate that children with AD/HDin differ from controls in response preparation and inhibition during a cued visual Go/Nogo task.©2008Elsevier Ireland Ltd.All rights reserved.Keywords:Event-related potentials;Contingent negative variation;Child psychiatry;Attention;Impulsivity1.IntroductionThe DSM-IV (American Psychiatric Association,1994)outlines three subtypes of attention-deficit/hyperactivity disorder (AD/HD);the combined type (AD/HDcom),the predominantly inattentive type (AD/HDin),and the predominantly hyperactive/impulsive type (AD/HDhyp).These subtypes are based on dif-ferent clusters of symptoms from within the two core symptom domains of Inattention and Hyperactivity/Impulsivity.Specifically,the diagnostic criteria for AD/HDcom require evidence of significant impairment across both domains,while AD/HDin and AD/HDhyp require evidence of significant impairment in only one domain,i.e.Inattention or Hyperactivity/Impulsivity,respectively.Diagnoses of AD/HDhyp are rare,with a prevalence rate of only 0.2%in Australia (Gomez et al.,Available online at Psychiatry Research 166(2009)223–237/locate/psychresCorresponding author.Tel.:+61242214495;fax:+61242214163.E-mail address:sjohnsto@.au (S.J.Johnstone).0165-1781/$-see front matter ©2008Elsevier Ireland Ltd.All rights reserved.doi:10.1016/j.psychres.2008.03.0051999).This was confirmed in our setting,with no children fulfilling the diagnostic criteria for this subtype. Further,as questions have been raised about the validity of this subtype(Barkley,1997a;Power and DuPaul, 1996),it is not further addressed in this article.The DSM-IV criteria indicate that hyperactive and impulsive symptoms differentiate AD/HDcom from AD/HDin.This distinction has apparent validity in the day-to-day life of the child,with a high prevalence of academic and behavioural problems in those with AD/ HDcom(73%and92%,respectively)and a high incidence of academic,but reduced behavioural,prob-lems associated with AD/HDin(75%and40%,respec-tively;Wolraich et al.,1996).Some of the hyperactive/ impulsive symptoms(e.g.fidgeting,excessive talking, interrupting others)can be viewed as related to response inhibition problems.While deficient inhibition has been put forward as being at the core of AD/HD(Barkley, 1997b;Quay,1988b,1997;Sergeant,2000),the rele-vance of these theoretical positions to subtypes is un-clear,as Sergeant and Quay do not make reference to subtypes of AD/HD,and Barkley specifically refers only to the AD/HDcom and AD/HDhyp types,with AD/ HDin considered a disorder of inattention.Diamond (2005)has proposed that AD/HDin is not a subtype of AD/HD,but rather a different disorder,with core prob-lems in motivation and working memory functioning but not response inhibition.Note also that the influence of intra-individual response variability,within the con-text of inhibition and other executive function tasks,is receiving increased research interest(e.g.Castellanos et al.,2006;Klein et al.,2006).Previous behavioural research comparing the AD/ HD subtypes on inhibition tasks is limited and has produced mixed results.Some studies report problems of disinhibition in AD/HDcom but not AD/HDin(Nigg et al.,2002;Wang et al.,2003),while others show similar levels of poor inhibition performance in both subtypes(Lane,2004;Yonghui et al.,2005).This study will examine response inhibition during the Go/Nogo task in these subtypes,examining task performance and additionally using event-related potentials(ERPs)to investigate underlying neural activation related to res-ponse inhibition.It has been consistently reported that children with AD/HDcom have problems with response inhibition, typically displaying higher levels of commission errors to Nogo/Stop stimuli(i.e.,those stimuli requiring the covert inhibition of a response)than control children (Iaboni et al.,1995;Nigg,1999;Rubia et al.,1999; Schachar et al.,1993).These behavioural findings are supported by brain imaging reports of atypical frontal activity during inhibitory processing in children with AD/HD(Rubia et al.,2000),and reports of atypical activation of inhibition-related ERP components such as the fronto-central N2(Broyd et al.,2005;Dimoska et al., 2003;Pliszka et al.,2000;Smith et al.,2004;Yong-Liang et al.,2000)and P3(Brandeis et al.,1998;Liotti et al.,2005;Overtoom et al.,2002).Group differences are not restricted to these endogenous components, however,with topographic differences and differential Nogo effects(i.e.,a larger component to Nogo than Go stimuli)reported in earlier exogenous(i.e.,obligatory/ sensory)components,such as the N1and P2(Broyd et al.,2005;Smith et al.,2004).While their functional significance is currently con-troversial(Nieuwenhuis et al.,2003;Smith et al.,2006), the N2and P3ERP components have shown reasonably consistent relationships with inhibition-related beha-viours(Falkenstein et al.,1999;Jodo and Kayama, 1992),and are generally considered to be electrophysio-logical markers of aspects of the inhibition processing sequence.The N2is maximal over frontal scalp regions (Kiefer et al.,1998)and is typically larger to Nogo than Go stimuli(Eimer,1993),an augmentation resulting from the inhibitory process and described as a“red flag”that the response to the stimulus is to be inhibited(Kok, 1986).The latency of N2is reduced in good compared with poor inhibitors(Falkenstein et al.,1999),providing further support for N2as related to the inhibition me-chanism.Nogo effects have been reported for N2in children(Broyd et al.,2005;Dimoska et al.,2003; Smith et al.,2004)and adults(Kiefer et al.,1998).The P3component typically exhibits a centro-parietal maxi-mum to Go stimuli,but is more anterior to Nogo stimuli (Bruin and Wijers,2002).Nogo P3latency is typically prolonged relative to Go stimuli(Eimer,1993),and in older compared to younger adults(Falkenstein et al., 2002).We have previously investigated these subtypes using a task that primarily engages attention control (i.e.,a two-tone oddball),a process from the symptom domain common to both AD/HD subtype groups (Johnstone et al.,2001).There we reported that children with AD/HDin did not differ significantly from controls or AD/HDcom in task performance,but did show ERP differences from controls,several that were common to both subtypes and represent shared processing problems (e.g.increased P2amplitude),as well as unique dif-ferences(e.g.target N1,P2and P3topography).Further, each subtype showed differing patterns of abnormal age-based development for several ERP components, indicating qualitative differences in information proces-sing stage deficits in each of these AD/HD subtypes.224S.J.Johnstone,A.R.Clarke/Psychiatry Research166(2009)223–237The task used in the present study was a cued visual Go/Nogo,with a constant interval between Stimulus1, or S1(i.e.the Warning stimulus)and Stimulus2,or S2 (i.e.the imperative stimulus),allowing examination of responses to S1and S2and also the contingent negative variation(CNV),an electrophysiological index of response preparation,during the S1–S2interval.We have previously reported that children with AD/HDcom process cue stimuli differently than controls during a cued auditory Go/Nogo task,with increased commis-sion errors and concurrent differences in P1,N1and P2 components to these stimuli(Smith et al.,2004).Cue processing problems in AD/HD have also been reported in the visuospatial attention context(Huang-Pollock and Nigg,2003).While early research reported reduced CNV in child-ren with concentration problems(Grunewald-Zuberbier et al.,1978),more recent investigations have yielded variable results.The early CNV,which is a frontally maximal component linked to orienting/expectancy (Loveless,1979),has been reported to be attenuated in AD/HDcom(Hennighausen et al.,2000;van Leeuwen et al.,1998).The fronto-central late CNV,an index of preparation for the target(Walter et al.,1964),has been reported to be reduced(Aydin et al.,1987;Banaschewski et al.,2003;Dumais-Huber and Rothenberger,1992; Perchet et al.,2001;van Leeuwen et al.,1998),increased (Hennighausen et al.,2000)and not different(Strand-burg et al.,1996;Yordanova et al.,1996)in children with AD/HD compared to controls.Given these varied re-sults,further investigation in this area is warranted,with this study extending previous research to include the AD/HDin subtype.This study aimed to investigate response prepara-tion and response inhibition in children with AD/ HDcom and AD/HDin using the visual Go/Nogo task with the inclusion of electrophysiological information to provide an insight into the neural bases for task performance,especially in relation to the inhibition process.The CNV as well as N2and P3components(to S2)will be examined as indices of response preparation and inhibition,respectively.Other earlier components will also be evaluated,given the potential cascading nature of early processing issues as related to later endogenous aspects of processing.2.Methods2.1.SubjectsParticipants comprised45children between8and14 years of age(M=11.7years,S.D.=1.9years)participated in the years),with15in each of the control(4female), AD/HDin(3female)and AD/HDcom(2female)groups. For inclusion in the study,each child had to obtain an estimated IQ of80or greater(M=110.7,S.D.=14.4), based on the Raven's Progressive Matrices(Raven,1989) and report no hearing or vision problems.Subjects were excluded if they had been known to suffer an epileptic seizure,serious head-injuries,periods of unconscious-ness,or serious psychiatric rmed written consent was obtained from the parent(s)after provision of an outline of the procedure,and verbal assent was ob-tained from the child after the testing procedure had been explained.The experimental protocol was approved by the University of Wollongong and Illawarra Area Health Service Human Research Ethics Committee.Clinical subjects were diagnosed by a psychologist/ psychiatrist according to DSM-IV criteria,with con-firmation by an independent experienced psychologist. Subjects with a clinically significant comorbid disorder, based on consideration of questions related to autism, Asperger's syndrome,depression and anxiety during diagnostic interview,as well as behavior rating scales, were excluded from the sample.Those AD/HD subjects taking stimulant medication(73%of the AD/HDin group;87%of the AD/HDcom group)were required to refrain from taking it in the24h(5half-lives)prior to testing.Control subjects were recruited from the local com-munity via newspaper advertising,and had no known health,mental or developmental problems,as reported by each child's parent(s).Control children were required to score in the non-clinical range on all scales of the Conners'Parent Rating Scale-Revised(CPRS-R;T b60) and Child Behaviour Checklist(CBCL;T b65).2.2.ProceduresParents completed the CPRS-R and CBCL to char-acterise their child’s typical behaviour,and an in-formation sheet used to screen for stimulant use, handedness and a brief history of health and physical concerns.Each child completed the South Australian Spelling Test(SAST)and Raven's Standard Progres-sive Matrices(Raven,1989),a test of general cognitive ability.After familiarisation with the testing equipment and procedure and subsequent equipment fitting,the child was taken to a sound-attenuated air-conditioned testing room where he/she completed three experimental tasks. After electrophysiological testing was completed,sub-jects were given a short break before moving to another quiet room where they completed the SAST and Raven's225S.J.Johnstone,A.R.Clarke/Psychiatry Research166(2009)223–237tasks.The entire session lasted for approximately2h. Independent of task performance,children received a certificate and a chocolate bar for their participation in the study,while their parent(s)received A$10to compensate for traveling expenses incurred,and a report on their child’s spelling and general cognitive ability test performance.2.3.TasksAll subjects completed a visual cued Go/Nogo task,as well as auditory and visual stop-signal tasks, with task presentation order rotated between subjects. Data from the stop-signal tasks are not presented here.Stimuli in the visual Go/Nogo task consisted of the letters“W”(Warning),“G”(Go)and“S”(Stop,i.e., Nogo)presented centrally on a15-inch computer monitor1meter from the child at eye-level.The stimuli measured3×3cm on the screen.The sequence for each trial consisted of the presentation of the warning letter (S1)followed by a second letter(S2)which required either a button press response(Go)or the inhibition of a response(Nogo),depending on the letter presented.S2 required response execution on70%of trials,and the inhibition of a response on the remaining30%.The S1–S2interval was fixed at1380ms,while the S2–S1 interval varied randomly between1500and2500ms (mean2000ms).A central fixation cross was on screen at all times,except during discrete stimulus presenta-tions.A10-trial practice block was followed by two recording blocks,each consisting of100trials.If re-quired,children were given a2–3min break between blocks.Subjects responded with the index finger of their dominant hand(all but one subject in the con-trol group were right-handed)with a keyboard button press.Only presses to the Go tone with reaction time RT b1000ms were regarded as correct,although all button presses were recorded to allow omission and commission errors to be monitored.It was explained to the children that the letter“W”represented a warning,instructing them to“get ready to press the button”,and that this would be followed by either the letter“G”which meant“Go,that is,press the button”,or the letter“S”which meant“Stop,that is,do not press the button”.Both speed and accuracy were encouraged.Subjects were asked to remain as still as possible,to watch the central fixation cross on the computer monitor,to respond as quickly and as ac-curately as possible to the presentation of Go stimuli, and to attempt to withhold that response if a Nogo stimulus occurred.2.4.Electrophysiological recordingThe continuous scalp electroencephalogram(EEG) was recorded using an electrode cap with electrodes placed at19sites(Fp1,Fp2,F3,F4,F7,F8,Fz,C3,C4, Cz,P3,P4,Pz,T3,T4,T5,T6,O1,O2)of the Inter-national10–20system.The electro-oculogram(EOG) was measured vertically with two tin cup electrodes, 1cm above and below the left eye.All electrodes were referenced to linked ears.Impedance was kept below 5kΩfor EOG and reference electrodes,and3kΩfor cap electrodes.The subject was grounded by a cap electrode located between Fpz and Fz.EEG and EOG signals were amplified5000times,with a bandpass down3dB at0.01and100Hz(the high and low band-pass settings,respectively),via24channels of Grass amplifiers(Grass-Telefactor,USA),and sampled through a12-bit A/D card at512Hz.Prior to processing,the EEG data were digitally filtered using a low-pass filter3dB down at30Hz.2.5.Data quantificationThe ERP epoch was defined as100ms pre-stimulus to(a)1380ms post-stimulus for Warning trials,and (b)900ms post-stimulus for Go and Nogo trials. Epochs were excluded from analysis if they contained amplitudes outside the range of±100µV at any non-frontal site.EOG activity was subtracted from EEG epochs using a regression method in the time domain (Semlitsch et al.,1986).ERPs were calculated using correct responses only.To ensure comparability within subjects,the number of epochs available for averaging was determined for Nogo stimuli initially,with Go and Warning epochs restricted to the same number,being selected randomly from the total available.The mean number of epochs in each ERP for the control,AD/ HDin and AD/HDcom groups was50.4(S.D.2.8),47.9 (S.D.2.9)and47.6(S.D.9.1),respectively,with no dif-ferences between groups.Grand average ERP waveforms for each trial type and task were displayed for the purpose of defining each component's latency range.Peak picking was carried out by an automatic peak-picking program,measured relative to the pre-stimulus baseline,with manual con-firmation by an experienced ERP researcher who was blind to any subject information.Peak latency at all sites was locked to the peak latency of the site of maximum amplitude.The peak search parameters for both Warn-ing and Go/Nogo stimuli were:N1(100–190ms;locked to Fz),P2(190–260ms;Cz),N2(260–360ms;Fz),P3 (360–750ms;Pz).CNV-E and CNV-L were quantified226S.J.Johnstone,A.R.Clarke/Psychiatry Research166(2009)223–237by determining the mean amplitude in the ranges 500–950ms and 950–1380ms after the Warning stimulus,respectively.2.6.Statistical analysesOne-way Analyses of Variance (ANOVAs)were used to compare the groups on age,as well as psychometric,task performance and ERP latency variables.For Go and Nogo stimuli,four-way repeated mea-sures ANOVAs were used to analyse ERP compo-nent amplitudes at 9sites with Lateral (Left [F3,C3,P3],Midline [Fz,Cz,Pz],Right [F4,C4,P4]),Sa-gittal (Frontal [F3,Fz,F4],Central [C3,Cz,C4],Parietal [P3,Pz,P4])and Stimulus (Go vs.Nogo)as within-subject factors,and Group (control,AD/HDin,AD/HDcom)as a between-subjects factor.Additional three-way repeated measures ANOV As examined com-ponents to Warning stimuli,including the CNV (Lateral ×Sagittal ×Group ).Planned contrasts,which allow confirmation of ex-pected and characteristic variation in ERP components dependent on scalp location,were performed on the within-subjects factors Lateral (Left vs.Right electro-des,and Midline vs.the mean of the Left and Right electrodes)and Sagittal (Frontal vs.Parietal electrodes,and Central vs.the mean of the Frontal and Parietal electrodes).Within Group,two planned non-orthogonal contrasts compared each clinical group with the control group separately.As these contrasts were planned and there were no more of them than the degrees of freedom for effect,no Bonferroni-type adjustment to alpha was necessary (Tabachnick and Fidell,1989).Also,singledegree of freedom contrasts are not affected by violations of symmetry assumptions common in repeated measures analyses,and thus do not require Greenhouse –Geisser type corrections (Howell,1997).Data showing a Stimulus or Group main effect and an interaction with topography (teral or Sagittal factors)were normalised using the vector scaling procedure (McCarthy and Wood,1985).1This method removes the main effect amplitude difference between Stimuli/Groups —if the interaction remains significant after the procedure has been applied,it allows conclu-sions to be made about differing component generators between Stimuli/Groups.Accordingly,only interactions with topography that remained significant after this procedure are reported.3.Results3.1.Demographic and psychometricAs can be seen in Table 1,the groups did not differ in mean age or IQ,but the AD/HDin group showed significantly reduced spelling performance,compared to controls.The AD/HDcom group showed average scores in the clinical range (i.e.,65+)for all CPRS subscales and the Attention Problem and Aggressive Behaviour subscales of the CBCL (clinical range =70+),withTable 1Mean scores of psychometric testing,Conners Parent Rating Scale (CPRS)and the Child Behaviour Checklist (CBCL)for each group.ControlAD/HDin AD/HDcom Age 11.5(1.4)11.8(2.2)11.9(2.1)IQ108.8(15.3)113.4(13.6)110.0(14.8)Spelling Age 13.4(2.1)10.8*(2.7)11.8(3.0)CPRSADHD Index47.1(8.0)65.5***(6.2)77.5***(9.4)Cognitive Prob./Inattent.48.7(9.5)64.5***(6.9)74.7***(9.8)Hyperactivity 50.8(10.2)61.5*(13.2)81.6***(10.2)Oppositional48.6(7.9)56.7(13.5)74.5***(17.3)CBCLAnxious/Depressed 53.8(5.3)59.7*(9.4)60.6*(6.1)Withdrawn55.4(6.6)59.0(8.4)59.3(6.5)Somatic Complaints 52.2(4.5)56.9*(5.3)58.9**(6.5)Social Problems 54.6(6.1)57.9(6.3)65.7***(8.7)Thought Problems 54.7(6.4)64.9**(8.8)69.3***(8.0)Attention Problems 53.0(5.8)64.9***(9.1)74.5***(10.1)Rule-breaking51.6(3.7)59.5**(7.7)68.3***(9.8)Aggressive Behaviour53.9(6.0)57.4(9.0)74.7***(12.7)Significant differences from controls for each AD/HD subtype are indicated by the asterisk (*P b 0.05,**P b 0.01,***P b 0.001).1Recent critical appraisals of the vector scaling method have resulted in an alternative method,which shows advantages especially when a linked-ear reference is used (Jing et al.,2006).When applied to the data from the current study,outcomes of the new method did not differ from those of the vector scaling method.227S.J.Johnstone,A.R.Clarke /Psychiatry Research 166(2009)223–237Thought Problems and Rule-breaking subscales of the CBCL in the borderline range (i.e.,67–70).The AD/HDin group averaged a clinical level ADHD Index,as well as borderline clinical scores (i.e.,60–64)for the Cognitive Problems/Inattention and Hyperactivity sub-scales of the CPRS,with no borderline or clinical level scores for the CBCL.In regard to group comparisons,the AD/HDcom group had higher scores than controls on all but one (i.e.,Withdrawn)subscale of the CPRS and CBCL.The AD/HDin group had higher scores than controls on all but the Oppositional subscale of the CPRS,and on the Thought Problems,Attention Problems and Rule Break-ing subscales of the CBCL.These results are consistent with previously reported subtype-specific symptom pro-files for children with AD/HD in Australia (Graetz et al.,2001).3.2.Task performanceIn relation to response activation,as shown in Table 2,both subtype groups had more errors of commission to warning stimuli than controls,with the AD/HDcom group showing reduced Go response accuracy compared with controls.This latter effect was not present in childrenTable 2Means (S.D.)for task performance measures for each group.ControlAD/HDinAD/HDcomWarning Error %0.5(0.8) 1.2*(0.9) 1.5***(1.2)Go Accuracy %96.2(4.6)94.8(4.0)92.6*(5.3)Go RT (ms)492.5(106.2)496.1(75.6)520.5(79.4)Inhibition probability %95.2(3.9)89.3**(5.5)90.1**(4.4)Significant differences from controls for each AD/HD subtype are indicated by the asterisk (*P b .05,**P b .01,***P b.001).Fig.1.Grand mean ERP to Warning stimuli across the S1–S2interval at Cz (bottom panel)for the Control (solid line),AD/HDin (dotted line)and AD/HDcom (dashed line)groups.Note:Ticks on the x -axis=100ms;Stimulus onset is indicated by the y -axis (scale in μV).The top panels show topographic maps for each component labeled on the ERP plot,for each group.Darker shades equal larger positive amplitudes for each component.228S.J.Johnstone,A.R.Clarke /Psychiatry Research 166(2009)223–237with AD/HDin.The RT to Go stimuli did not differ fromcontrols for either subtype.In relation to response inhi-bition,the percentage of successfully inhibited responsesto Nogo stimuli was reduced in the AD/HDin and AD/HDcom groups compared with controls.3.3.ERPs3.3.1.Warning stimuliFig.1shows the grand mean ERP to Warning stimulifor each group at Cz and topographic maps of the quan-tified components.N1peaked at141.9ms(with no Groupdifferences in latency)and was fronto-centrally maximalin the sagittal dimension(Linear contrast F(1,42)=18.9,P b0.001;Quadratic contrast F(1,42)=4.3,P b0.05)andmidline maximal in the lateral dimension(Quadraticcontrast F(1,42)=4.1,P b0.05).A near-significantGroup main effect and planned contrasts revealed thatN1tended to be larger in the AD/HDcom than controlgroup(−2.9vs.−1.3μV;P=0.07).A Frontal N Parietaleffect was larger in AD/HDin than the control group(F(1,42)=6.3,P b0.05),highlighting a reduced parietal N1in the AD/HDin group(see Figs.1and2A).P2peaked at195.4ms(with no Group differences inlatency)and was maximal in the parietal region(LinearF(1,42)=52.7,P b0.001),with no variation across theLateral regions.There was a group difference in theLateral distribution of P2,as the control group hada Left N Right effect(4.3vs.3.5μV)while the AD/HDin group showed an opposite effect(3.0vs.4.5μV;F(1,42)=5.8,P b0.05).N2peaked at328.9ms and was fronto-centrallymaximal(Linear F(1,42)=39.0,P N0.001;QuadraticF(1,42)=25.0,P b0.001),with no lateral variation.As shown in Figs.1and2B,although a Left N Right effect(−1.3vs.0.4μV)was observed for the AD/HDin group,the opposite effect occurred for the controls(−0.4vs.−0.9μV;F(1,42)=4.3P b0.05).P3peaked at527.7ms and was midline(Quadratic F(1,42)=6.0,P b0.05)andparietally(Linear F(1,42)=41.9,P b0.001)maximal.There were no differences between the groups in eitheramplitude or latency.CNV-E(600–950ms)was smaller in the midlinethan hemispheres(Quadratic F(1,42)=29.7,P b0.001).There were no group differences for this component.CNV-L(950–1380ms)was maximal in the centralregion(Quadratic F(1,42)=8.8,P b0.01).This non-fronto-central distribution is typical of children of thisage(Klein and Feige,2005).A tendency towards a group difference in the midline b hemispheres effect, which was very small in controls(0.1μV)and large in AD/HDin(0.9),highlighted the reduced midline CNV-L in the AD/HDin group(F(1,42)=3.6,P=0.07).Figs.1 and2C display the central N frontal/parietal effect,which was reduced in the AD/HDcom group compared with controls(central vs.frontal/parietal difference:AD/HDcom Fig.2.Group differences in ERPs to Warning stimuli for(A)N1, (B)N2and(C)CNV-L component amplitude.229S.J.Johnstone,A.R.Clarke/Psychiatry Research166(2009)223–237230S.J.Johnstone,A.R.Clarke/Psychiatry Research166(2009)223–2370.1μV ,control 1.2μV;F (1,42)=4.4,P b 0.05),high-lighting reduced central CNV-L in AD/HDcom.3.3.2.Go/Nogo stimuliFig.3shows the grand mean ERP to Go and Nogo stimuli for each group at Cz and topographic maps of the quantified components.N1peaked at 149.0ms (with no differences in latency between Groups or Stimulus type)and was maximal in the midline (Linear F (1,42)=23.9,P b 0.001)and fronto-central (Linear F (1,42)=30.5,P b 0.001;Quadratic F (1,42)=16.3,P b 0.001)regions.As can be seen in Figs.3and 4,the N1of the control group showed a fronto-central distribution for the Go stimulus but was frontally maximal with a linear reduction to the parietal region for Nogo stimuli (Central vs.Frontal/Parietal difference:Go 1.4μV ,Nogo 0.1μV)—each clinical group differed significantly from this,with both stimuli found to be fronto-centrally maximal for the AD/HDin group (Go 1.6μV ,Nogo 2.4μV;F (1,42)=7.7,P b 0.01),while the ADHDcom group showed frontal and fronto-central distributions for the Go and Nogo stimuli,respectively (Go 1.1μV ,Nogo 0.6μV;F (1,42)=5.7,P b 0.05).P2(mean latency 230.9ms)occurred later to Go than Nogo stimuli (242.6vs.219.2ms,F (1,42)=18.29,P b 0.001),with P2amplitude maximal in the midline (Quadratic F (1,42)=8.4,P b 0.01)and parietal (Linear F (1,42)=58.2,P b 0.001)regions.There were no Stimulus by topography interactions.Relative to controls (3.2μV),both the AD/HDin (5.3μV ,F (1,42)=5.0,P b 0.05)and AD/HDcom (5.4μV ,F (1,42)=4.4,P b 0.05)groups had globally increased P2amplitude.P2was larger in the right than left hemisphere for the AD/HDin group (5.7vs.4.3μV),differing significantly from controls (2.8vs.3.0μV;F (1,42)=6.1,P b 0.05)who had an opposite pat-tern (i.e.Left N Right)of reduced size (see Fig.5).The control group showed parieto-central and parietal dis-tributions for P2for Go and Nogo stimuli,respectively (Central vs.Frontal/Parietal difference:Go 1.7μV ,Nogo 0.1μV),with a significantly different distribution for the AD/HDin group where both stimuli were parietally dis-tributed (Go 0.7μV ,Nogo 0.7μV;F (1,42)=5.0,P b 0.05).N2(mean latency 310.7ms)occurred later in the AD/HDcom than control group (322.5vs.299.1ms;F (1,42)=5.0,P b 0.05).As shown in Figs.3and 5,N2latency was slightly longer to Go than Nogo stimuli for controls (300.8vs.297.4ms),but was substan-tially shorter to Go than Nogo in the AD/HDin group (289.6vs.331.6ms;F (1,42)=8.4,P b 0.01).N2was maximal in the left hemisphere (Linear F (1,42)=7.2,P b 0.05)and fronto-central region (Linear F (1,42)=40.8,P b 0.001;Quadratic F (1,42)=3.9,P =0.056),and was larger to Nogo than Go stimuli (1.1vs.3.4μV ,F (1,42)=10.0,P b 0.01),a difference that was largest in the central-posterior region (Linear F (1,42)=3.7,P =0.06;Quadratic F (1,42)=5.4,P b 0.05).Across the scalp,N2was larger in controls (0.5μV)than both the AD/HDcom (2.9μV ,F (1,42)=4.1,P =0.05)and AD/HDin (3.3μV ,F (1,42)=5.6,P b 0.05)groups.P3latency averaged 534.1ms overall,being increased for Nogo compared to Go stimuli (562.3vs.505.9ms;F (1,42)=8.23,P b 0.01)and tended to be increased in AD/HDcom compared with controls (578.5vs.511.1ms;F (1,42)=3.79,P =0.058).P3was maximal in the midline-right (Linear F (1,42)=5.5,P b 0.05;Quadratic F (1,42)=53.1,P b 0.001)and central-parietal (Linear F (1,42)=109.1,P b 0.001;Quadratic F (1,42)=9.2,P b 0.01)regions,with no significant difference between Go and Nogo stimuli.A parietal N frontal effect was reduced in Nogo compared with Go stimuli (parietal vs.frontal difference:Nogo 6.8μV ,Go 11.8μV;F (1,42)=10.2,P b 0.01),reflecting the anteriorisation of P3to Nogo relative to Go stimuli.As shown in Figs.3and 4,this effect differed between groups,with a parietal maximum (linear reduction to frontal sites)for both stimuli for controls,along with a reduction in the parietal area for Nogo stimuli (central vs.fronto-parietal difference:Nogo 0.9μV ,Go 0.3μV),with a significantly different distribution for the clinical groups where both the AD/HDin (Nogo 1.3μV ,Go 3.5μV;F (1,42)=3.9,P =0.05)and AD/HDcom (Nogo 0.3,Go 2.9μV;F (1,42)=4.9,P b 0.05)groups showed increased central activity to Go stimuli.4.DiscussionThe three groups did not differ in mean age or IQ.As expected,the clinical groups showed a reduced spelling age relative to controls,although it should be noted that while the AD/HDcom group lagged 1.6years behind controls,this difference was not significant.The CPRS-R and CBCL results indicate that unique groups with subtype-specific behavioural profiles were defined,confirming the initial diagnoses at the group level.Those diagnoses were based strictly on DSM-IV criteria,withFig.3.The middle panel shows the grand mean ERPs to Go (solid line)and Nogo (dashed line)stimuli at Cz for the Control (left side),AD/HDin (middle)and AD/HDcom (right side)groups.Note:Ticks on the x -axis=100ms;Stimulus onset is indicated by the y -axis on the middle plot;y -axis scale in μV .The top and bottom panels show topographic maps for each component labeled on the ERP plot,for Go (top panel)and Nogo (bottom panel)stimuli separately.Darker shades equal larger positive amplitudes for each component.231S.J.Johnstone,A.R.Clarke /Psychiatry Research 166(2009)223–237。