Running title Protein Function Prediction by Domain Composition
- 格式:pdf
- 大小:64.14 KB
- 文档页数:27
Computational Approaches for Protein Function Prediction: A Survey蛋白质功能预测的计算机方法:概述camelbbs@ 译蛋白质是生命中最必需和最通用的大分子,对它们的功能的认识与新药的发展、农作物的收成以及生化合成如生物燃料的发展有着重要的联系。
实验手段来预测蛋白质功能本身就是低通量的,已经不能用来注释在高速发展的基因组测序技术中所获得的大量蛋白质。
这促使人们通过计算机技术,利用各种高通量的实验数据来进行蛋白质预测,如蛋白质和基因组序列、基因表达数据、蛋白质相互作用网络以及系统发生谱等等。
事实上,在过去的短短的十年里,关于这个课题已经发表了几百篇文章。
本概述的目的在于,根据这些预测方法所用到的数据类型将它们分类并加以讨论,以便对这一重要领域的发展趋势作出预测。
希望本文能帮助计算生物学家和生物信息学工作者获得一个关于蛋白质功能的计算机预测这一领域的总览,并找出那些值得进一步研究的地方。
关键词和短语:蛋白质功能预测生物信息学基因分类多重生物数据类型高通量实验数据数据挖掘基于非同源性方法1 前言 (5)2 什么是蛋白功能 (7)2.1功能分类计划(Schemes)2.2 GO是途径 (10)2.3讨论 (12)3蛋白质序列 (13)3.1介绍 (13)3.2基于同源性的注释转换:用于功能预测的优点 (15)3.3简单同源注释转换之外的方法 (15)3.3.1基于同源性的方法(homology-based)3.2.2基于亚序列的方法(subsequence-based)3.3.3基于特征的方法(feature-based)3.4讨论 (24)4。
蛋白质结构 (25)4。
1 简介 (25)4.2 结构与功能有联系吗? (28)4。
3 已存在的方法 (29)4.3.1 基于结构相似性的方法(structural similarity-based)4.3.2基于三维基序的方法(three-dimensional motif-based)4.3.3基于表面的方法(surface-based)4.3.4 基于学习的方法(learning-based)4.4讨论 (35)5 基因组序列 (35)5.1 简介 (35)5.2 现有方法 (35)5.2.1基于基因组范围的同源性的注释转换(genome-wide homology-based) 5.2.2利用基因邻居的方法(neighborhood)5.2.3 利用基因融合的方法(fusion)5.3 方法的比较和互补(comparison and assimilation)6 系统发生数据(phylogenetic data)6.1 简介 (42)6.2已有方法 (43)6.2.1 使用系统发生谱的方法(phylogenetic profiles)6.2.2 系统发生树方法(phylogenetic trees)6.2.3 杂合方法(hybrid)6.3讨论 (49)7 基因表达数据 (49)7.1 简介 (49)7.2 已有方法 (51)7.2.1 基于聚类的方法(clustering-based)7.2.2基于分类的方法(classification-based)7.2.3基于动态性的分析方法(temporal analysis-based)7.3讨论 (59)8 蛋白相互作用网络 (61)8.1 简介 (61)8.2 蛋白相互作用网络的功用 (62)8.3已有方法 (63)8.3.1基于邻接的方法(neighborhood-based)8.3.2基于全局最优化的方法(global optimization)8.3.3基于聚类的方法(clustering-based)8.3.4基于相关分析的方法(association analysis-based)8.4讨论 (71)9文献和文本 (72)9.1简介 (72)9.2已有方法 (72)9.2.1 基于IR的方法 (74)9.2.2基于文本挖掘的方法 (74)9.2.3基于NLP的方法 (76)9.2.4关键字搜索 (77)9.3 标准化举措(standardization initiatives)9.3.1 BioCreAtIvE. 799.3.2 TREC 2003 Genomics Track. 819.4讨论 (81)10 多样数据类型 (82)10.1简介 (82)10.2已有方法 (82)10.2.1使用一个普通数据格式的方法 (83)10.2.2 使用独立的数据格式的方法 (86)10.3讨论 (91)11 结论 (91)1 前言蛋白质是构成一个细胞的组成和功能成分的大分子,是继水之后细胞重要的第二大组成。
蛋白质组学技术流程Protein proteomics is a powerful technology used to study the complete set of proteins within an organism or a specific cell type. It involves the identification and quantification of proteins present in a sample, as well as the analysis of their functions, interactions, and modifications. This technology has revolutionized our understanding of cellular processes and disease mechanisms, making it an essential tool in biological research.蛋白质组学是一种强大的技术,用于研究生物体或特定细胞类型中的完整蛋白质组。
它涉及在样本中识别和定量存在的蛋白质,以及分析它们的功能、相互作用和修饰。
这项技术已经彻底改变了我们对细胞过程和疾病机制的理解,使其成为生物研究中必不可少的工具。
The workflow of a typical protein proteomics experiment involves several key steps, starting with sample preparation. This includes cell lysis to release the proteins, followed by protein extraction and purification to remove contaminants and concentrate the sample. The next step is protein digestion, where proteins are broken down into peptides using enzymes such as trypsin. These peptides are thenseparated using a technique such as liquid chromatography before being analyzed by mass spectrometry.典型蛋白质组学实验的工作流程包括几个关键步骤,从样本制备开始。
生物信息学英文介绍Introduction to Bioinformatics.Bioinformatics is an interdisciplinary field that combines biology, computer science, mathematics, statistics, and other disciplines to analyze and interpret biological data. At its core, bioinformatics leverages computational tools and algorithms to process, manage, and minebiological information, enabling a deeper understanding of the molecular basis of life and its diverse phenomena.The field of bioinformatics has exploded in recent years, driven by the exponential growth of biological data generated by high-throughput sequencing technologies, proteomics, genomics, and other omics approaches. This data deluge has presented both challenges and opportunities for researchers. On one hand, the sheer volume and complexityof the data require sophisticated computational methods for analysis. On the other hand, the wealth of information contained within these data holds the promise oftransformative insights into the functions, interactions, and evolution of biological systems.The core tasks of bioinformatics encompass genome annotation, sequence alignment and comparison, gene expression analysis, protein structure prediction and function annotation, and the integration of multi-omic data. These tasks require a range of computational tools and algorithms, often developed by bioinformatics experts in collaboration with biologists and other researchers.Genome annotation, for example, involves the identification of genes and other genetic elements within a genome and the prediction of their functions. This process involves the use of bioinformatics algorithms to identify protein-coding genes, non-coding RNAs, and regulatory elements based on sequence patterns and other features. The resulting annotations provide a foundation forunderstanding the genetic basis of traits and diseases.Sequence alignment and comparison are crucial for understanding the evolutionary relationships betweenspecies and for identifying conserved regions within genomes. Bioinformatics algorithms, such as BLAST and multiple sequence alignment tools, are widely used for these purposes. These algorithms enable researchers to compare sequences quickly and accurately, revealing patterns of conservation and divergence that inform our understanding of biological diversity and function.Gene expression analysis is another key area of bioinformatics. It involves the quantification of thelevels of mRNAs, proteins, and other molecules within cells and tissues, and the interpretation of these data to understand the regulation of gene expression and its impact on cellular phenotypes. Bioinformatics tools and algorithms are essential for processing and analyzing the vast amounts of data generated by high-throughput sequencing and other experimental techniques.Protein structure prediction and function annotation are also important areas of bioinformatics. The structure of a protein determines its function, and bioinformatics methods can help predict the three-dimensional structure ofa protein based on its amino acid sequence. These predictions can then be used to infer the protein'sfunction and to understand how it interacts with other molecules within the cell.The integration of multi-omic data is a rapidly emerging area of bioinformatics. It involves theintegration and analysis of data from different omics platforms, such as genomics, transcriptomics, proteomics, and metabolomics. This approach enables researchers to understand the interconnectedness of different biological processes and to identify complex relationships between genes, proteins, and metabolites.In addition to these core tasks, bioinformatics also plays a crucial role in translational research and personalized medicine. It enables the identification of disease-associated genes and the development of targeted therapeutics. By analyzing genetic and other biological data from patients, bioinformatics can help predict disease outcomes and guide treatment decisions.The future of bioinformatics is bright. With the continued development of high-throughput sequencing technologies and other omics approaches, the amount of biological data available for analysis will continue to grow. This will drive the need for more sophisticated computational methods and algorithms to process and interpret these data. At the same time, the integration of bioinformatics with other disciplines, such as artificial intelligence and machine learning, will open up new possibilities for understanding the complex systems that underlie life.In conclusion, bioinformatics is an essential field for understanding the molecular basis of life and its diverse phenomena. It leverages computational tools and algorithms to process, manage, and mine biological information, enabling a deeper understanding of the functions, interactions, and evolution of biological systems. As the amount of biological data continues to grow, the role of bioinformatics in research and medicine will become increasingly important.。

蛋白质互作的英语Protein interaction is the key to many biological processes. In cells, protein interaction helps to regulate signaling pathways, metabolic pathways, DNA replication, transcription, translation, cell cycle, and many other cellular functions. Protein interaction can occur through multiple mechanisms, including binding of proteins to other proteins, binding of proteins to DNA, binding of proteins to RNA, and binding of proteins to small molecules.Protein interaction networks are complex and dynamic, and can change in response to environmental cues, developmental cues, and disease states. Many tools have been developed to study protein interaction networks, including high-throughput assays, computational algorithms, and structural biology techniques. These tools can help to identify interacting partners, elucidate the mechanism of interaction, and predict the effect of perturbations on the network.Protein interactions can also play a role in disease. Mutations in genes encoding proteins involved in protein-protein interactions can lead to aberrant interactions, which can disrupt normal cellular processes and lead to disease. Drugs targeting protein-protein interactions are currently being developed as therapeutics for various diseases, including cancer, viral infections, and autoimmune disorders.In summary, protein interaction is a fundamental aspect of cellular function, and plays a critical role in many biological processes. Understanding protein interactions at amolecular level can provide important insights into cellular physiology, disease mechanisms, and drug discovery.。
预测蛋白聚集位点(Protein Aggregation)教程介绍抗体等具有治疗功能的蛋白,如果处于比较高的浓度下,会有发生聚集的趋势。
这会导致抗体的活性下降,并引起免疫反应。
抗体的聚集趋势计算是一种衡量蛋白表面氨基酸聚集倾向性的指标。
具有比较高的聚集趋势得分的位点表明了该区域的氨基酸倾向于发生聚集。
因此这些位点的预测,使得我们可以通过氨基酸定点突变的方法来改造蛋白,增强其稳定性。
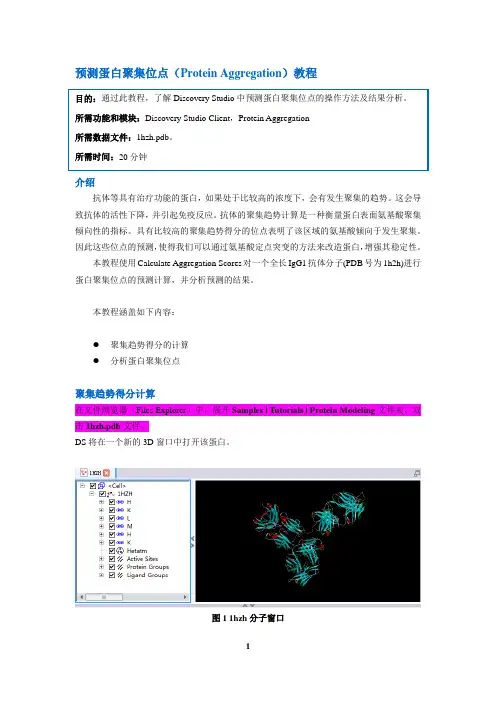
本教程使用Calculate Aggregation Scores对一个全长IgG1抗体分子(PDB号为1h2h)进行蛋白聚集位点的预测计算,并分析预测的结果。
本教程涵盖如下内容:●聚集趋势得分的计算●分析蛋白聚集位点聚集趋势得分计算在文件浏览器(Files Explorer)中,展开Samples | Tutorials | Protein Modeling文件夹,双击1hzh.pdb文件。
DS将在一个新的3D窗口中打开该蛋白。
图1 1hzh分子窗口Ctrl+H打开Hierarchy窗口,然后选中Water,点击Delete删除蛋白结构中的结晶水分子。
在工具浏览器(Tools Explorer)中,展开Simulation | Change Forcefield,将Forcefield设为CHARMm Polar H,然后点击Apply Forcefield,这将为蛋白赋上CHARMm Polar H力场。
图2 Apply Forcefield设置界面在工具浏览器(Tools Explorer)中,展开Macromolecules | Predict Protein Aggregation工具面板,点击Calculate Aggregation Scores。
在弹出的参数设置界面中,将Input Typed Protein设为1hzh:1HZH,将Cutoff Radius设为5,7,10。
点击Run运行该任务。
该任务在奔腾4,2Gb内存和2.8GHz的计算机平台上运行大约需要3分钟。
生物信息学方法英语Bioinformatics is a fascinating field that utilizes computational techniques to analyze and interpretbiological data. It's a blend of biology, computer science, statistics, and mathematics, and it's revolutionizing our understanding of the natural world.When it comes to analyzing genetic sequences, bioinformatics methods are invaluable. They can help us identify genes, predict protein function, and even understand the evolutionary relationships between species. The algorithms and software used in this field are incredibly powerful, and they're constantly evolving to meet the demands of modern research.One cool aspect of bioinformatics is how it's being used to fight diseases. Researchers are now able to analyze the genomes of patients and identify genetic mutations that may be linked to specific diseases. This information can then be used to develop targeted treatments andpersonalized medicine. It's truly amazing how far we've come in understanding the genetic basis of health and disease.Another fascinating aspect of bioinformatics is its application to metagenomics, which studies the genomes of entire microbial communities. By analyzing the genetic material extracted from environmental samples, researchers can gain insights into the diversity and function of microbial ecosystems. This information is crucial for understanding the role of microorganisms in ecosystems, as well as their potential impact on human health and the environment.But bioinformatics isn't just about analyzing data.It's also about visualization and communication. Researchers use various tools and software to create beautiful and informative visual representations of their data. These visualizations can help convey complex ideas and patterns in an accessible way, making the results.。

bioinformatics analysis is atechniqueBioinformatics Analysis: A Technique Shaping Modern Biomedical ResearchBioinformatics analysis is an intricate technique that revolutionizes the field of biomedical research. It involves the application of computational methods to biological data, enabling scientists to extract meaningful information from vast amounts of genetic, proteomic, and other biological datasets. This technique has become crucial in the post-genomic era, where the amount of biological data generated is exploding at an unprecedented rate.The core of bioinformatics analysis lies in the integration of multiple disciplines, including computer science, statistics, mathematics, and biology. This interdisciplinary approach allows researchers to tackle complex biological problems using advanced computational tools and algorithms. For instance, bioinformatics techniques are used to annotate and interpret genome sequences, predict protein function and interactions, analyze gene expression patterns, and identify biomarkers for various diseases.One of the most significant applications of bioinformatics analysis is in personalized medicine. By analyzing individual genetic variations, bioinformatics can help predict a person's risk for certain diseases and their response to different medications. This information can then be used to develop personalized treatment plans tailored to the unique genetic profile of each patient.Moreover, bioinformatics analysis plays a crucial role in drug discovery and development. By analyzing the interactions between drugs and their targets at the molecular level, bioinformatics can help identify potential drug candidates and predict their efficacy and safety profiles. This information can significantly shorten the drug discovery process and reduce the costs associated with clinical trials.In addition to its applications in personalized medicine and drug discovery, bioinformatics analysis also has numerous other uses. It can be used to study the evolution of species, the mechanisms of gene regulation, and the interactions between different biological systems. Bioinformatics analysis is also essential in the field of epidemiology, where it helps track the spread of diseases and identify potential outbreaks.In conclusion, bioinformatics analysis is a technique that has revolutionized biomedical research. Its interdisciplinary nature and the use of advanced computational methods have enabled researchers to extract meaningful information from vast amounts of biological data. This information has led to breakthroughs in personalized medicine, drug discovery, and other areas of biomedical research, promising better health outcomes and improved quality of life for millions of people.。
blastp1. IntroductionThe blastp program is a commonly used tool in bioinformatics for sequence analysis. It is a local alignment algorithm that compares a protein query sequence to a protein database to identify similar sequences and infer their functions. blastp is a part of the Basic Local Alignment Search Tool (BLAST) suite and is widely used in various biological research fields.2. How blastp Works2.1. Local AlignmentThe blastp algorithm performs local alignment, which means it seeks to identify regions of similarity between the query sequence and the database sequences rather than aligning the entire sequences. This allows for more efficient and accurate analysis by focusing on the most relevant regions.2.2. Scoring SystemBy default, blastp uses the BLOSUM62 scoring matrix to calculate the similarity scores between amino acid residues. The scoring matrix assigns a positive score to similar residues and a negative score to dissimilar residues. These scores are used to identify regions of similarity between the query and database sequences.2.3. The blastp AlgorithmThe blastp algorithm consists of the following steps:1.Database Preparation: The protein database is indexed and formatted for efficient searching.2.Query Sequence Input: The user provides the query sequence in FASTA format.3.Scoring: The query sequence is compared to the database sequences using the BLOSUM62 scoring matrix. The algorithm identifies matches and calculates similarity scores.4.Filtering: The algorithm applies a statistical filter to eliminate low-scoring matches.5.Alignment Extension: The algorithm extends the matching regions to maximize the alignment score.6.Construction of the Alignment: The algorithm constructs the final alignment using the highest-scoring regions.7.Database Statistics: blastp provides statistical information about the query’s similarity to the database sequences, including the E-value, which estimates the number of false positive matches.3. Uses of blastpThe blastp program has various applications in bioinformatics research:1.Protein Function Prediction: blastp can compare a protein ofunknown function to a database of annotated proteins to predict its function based on similarity to known proteins.2.Homology Identification: blastp can identify homologous proteinsthat share a common evolutionary origin. This information is useful forstudying protein evolution and inferring functional relationships.3.Protein Structure Analysis: By identifying similar proteins in thedatabase, blastp can assist in predicting the structure of the query proteinbased on the known structure of a homologous protein.4.Sequence Annotation: blastp can be used to annotate proteinsequences by identifying conserved domains and motifs that indicate theirfunction.4. Comparison with Other Sequence Alignment Toolsblastp is one of several sequence alignment tools available for protein analysis. Here are some key differences between blastp and other popular tools:•BLASTp vs. BLASTx: While blastp compares protein sequences to a protein database, blastx compares nucleotide sequences to a protein database.blastx can help identify potential protein-coding genes in DNA sequences.•BLASTp vs. PSI-BLAST: PSI-BLAST is an iterative version of blastp that can help detect remote homologs by building a position-specific scoring matrix (PSSM). blastp is more suitable for identifying close homologs, while PSI-BLAST is better at finding more distant relatives.5. ConclusionThe blastp program is a valuable tool for protein sequence analysis, allowing researchers to identify similar sequences, predict protein function, and study protein evolution. With its efficient local alignment algorithm and robust scoring system, blastp has become a standard tool in bioinformatics research. By providing statistical information and alignment details, blastp helps researchers make informed decisions about their protein analysis.。
Bioinformatics Advance Access published January 22, 2004FatiGO: a web tool for finding significant associations of Gene Ontology terms with groups of genes.Fátima Al-Shahrour, Ramón Díaz-Uriarte and Joaquín Dopazo*.Bioinformatics Unit, Centro Nacional de Investigaciones Oncológicas (CNIO), Melchor Fernández Almagro 3, 28029, Madrid, Spain.Running title: Significant distribution of GO terms* To whom correspondence should be addressedCopyright (c) 2004 Oxford University PressAbstractSummary: We present a simple but powerful procedure to extract Gene Ontology terms that are significantly over or under-represented in sets of genes within the context of a genome-scale experiment (DNA microarray, proteomics, etc.). Said procedure has been implemented as a web application, FatiGO, allowing for easy and interactive querying. FatiGO, which takes the multiple-testing nature of statistical contrast into account, currently includes GO associations for diverse organisms (human, mouse, fly, worm and yeast) and the TrEMBL/Swissprot GOAnnotations@EBI correspondences from the European Bioinformatics Institute.Availability: io.esContact: jdopazo@cnio.esMost resources available that collect information regarding gene or protein function, biological properties, etc., are based on the pre-genomic design in which the information is acceded and displayed in a one-gene-at-a-time format. Nevertheless, many problems related to functional genomics involve the detection of biological properties, functions, etc., shared by a set of genes, that sets them aside from the remaining ones. The practical application of methods of pre-genomic design to these problems is drastically limited when thousands of genes are involved in the comparative study. The use of techniques of automatic management of biological information, such as text mining, in studying the coherence of gene groups obtained from different methodologies has only recently been addressed (Oliveros et al., 2000; Raychaudhuri et al., 2002; Pavlidis et al., 2002), although its practical application still has many drawbacks (Blaschke et al., 2002). Furthermore, real implementation s are often scarce and beyond the reach of many users.An alternative to extracting information from scientific text sources is by using ontologies. In its most simple representation, ontologies provide a structured description of biological information that is extremely useful for computational management. One of the most widely accepted ontologies is Gene Ontology (GO; Ashburner et al., 2000), which organises information for molecular function, biological processes and cellular components for a number of different organisms. The potential of GO terms as a structured source of information however, has yet to be fully exploited.Here we present FatiGO, a web-based application (io.es). Since the publication of FatiGO in the GO consortium web page () less than a year ago, a number of tools have been implemented based on the same idea of mapping biological knowledge on sets of genes. Thus, Onto-Express (Khatri et al., 2002), which generates tables that correlate groups of genes to biochemical and molecular functions or MAPPFinder (Doniger et al., 2003), which, using a searchable web interface, identifies GO terms over-represented in the data. A similar tool, FunSpec (Robinson et al., 2002), evaluates groups of y east genes in terms of their annotations in diverse databases. Many of these tools are stand-alone applications with user-friendly interfaces but obviously suppose limitations in processing large amounts of data. Moreover, important issues such as the multiple-testing nature of the statistical contrasts are not well addressed.FatiGO is used to extract relevant GO terms for a group of genes with respect to a set of genes of reference (typically the rest of genes). The terms are considered to be relevantby the application of a Fisher’s exact test that considers the multiple-testing nature of the statistical contrast performed. Multiple testing is an important issue that is, nevertheless, scarcely addressed (Slonim, 2002). If the multiple-testing nature of t he statistical contrast is not taken into account an increase in the rate of false positives (i.e., terms identified as over or under-represented whose proportions, in reality, are not significantly different), occurs. FatiGO can deal with thousands of gen es from different organisms (currently human, mouse, drosophila, worm, yeast, as well as genes whose proteins are included in Swissprot database), and can be queried using different gene identifiers (GenBank ID, Unigene, ENSEMBL, systematic name, Swissprot/TrEMBL). FatiGO uses tables of correspondence between genes and their corresponding GO terms. The program can be used to list the proportions of GO terms in a set of genes. The output links the genes to the corresponding databases and the GO terms to AmiGO, a GO browser (/).When possible, curated associations of gene Ids to GO terms have been used. Associations for different organisms have been included in FatiGO (at present human, mouse, Drosophila, yeast, C. elegans and, in general, genes whose proteins have been included in Swissprot). In the Gene Ontology Consortium web page () tables relating GO terms with gene IDs can be found.A common problem when dealing with thousands of genes annotated in origin in different places is the lack of standardisation in the annotations. Several manufacturers of microarrays use unigene codes, but often genbank IDs and even gene names are also found embedded in the annotation. Xref EBI codes are used to relate Genbank, ENSEMBL and unigene to SwissProt/TREMBL, which is associated to GO by means of the GO annotations @EBI tables. For the other databases specific gene ID to GO associations have been used. Locuslink contains information on official nomenclature genes, aliases and unigene clusters and provides a link between different gene identifiers. Unigene IDs present an additional problem: sequences can change unigene cluster from release to release, being necessary to maintain a historical record to keep track of the last version’s ID for a gene that was annotated several releases ago. An additional table of correspondence between old and new unigene versions (downloaded from the unigene web site) has been used. Using this table we can obtain the updated version of the unigene ID for any ID belonging to an old version, if any. It is possible that a) there is a different ID because it has been merged to another cluster and has taken its ID and that, b) there is more than one ID because the cluster has split intoseveral clusters, and that c) the unigene cluster has been withdrawn from the database. On the other hand, unigene IDs are easy to parse (they are “Hs.” or “Mm.” followed by a number) which is convenient for processing files of DNA microarray results in which the manufacturers tend to include the unigene code among other additional information. Gene associations include all evidence codes. Part of them, the I nferred from E lectronic A nnotation, have been automatically assigned without the intervention of human curators, so they are less reliable (see the GO evidence code documentation at /doc/GO.evidence.html).The FatiGO tool can be used to find GO terms that are over and under-represented in a set of genes with respect to a reference group. Once both sets of genes have been uploaded (as lists of gene Ids) the GO level at which the statistical contrast is going to be performed must be chosen. Deeper terms in the GO hierarchy are more precise. Obviously, the number of genes with annotations decreases at deeper GO levels. GO level 3 constitutes a good compromise between information quality and number of genes annotated at this level (Mateos et al., 2002). For genes annotated at deeper levels than the selected level, FatiGO climbs up the GO hierarchy until the terms for said level are reached. The use of the parent terms increases the sizes of the classes (genes annotated with a given GO term), making it easier to find relevant differences in distributions of GO terms among clusters of genes. The information is not lost and can be recovered later. In the instance of repeated genes (something common in microarray data) only one is used. Once the collections of GO terms corresponding to the two data sets of genes are prepared, a Fisher’s exact test f or 2x2 contingency tables is applied. FatiGO returns adjusted p-values based on three different ways of accounting for multiple testing. One of them is the step-down minP method of Westfall & Young (1993). This method provides control of the family wise error rate (i.e., the probability of making a Type I error rate over the family of tests). Adjusted p-values were also calculated using the False Discovery Rate (FDR), that is, the expected number of false rejections among the rejected hypothesis can be controlled. The FDR method of Benjamini & Hochberg (1995), which offers control of the FDR only under independence and some specific types of positive dependence of the tests statistics, and the FDR method of Benjamini & Yekutieli, (2001) which offers strong c ontrol under arbitrary dependency of test statistics were also implemented in FatiGO (see also Dudoit et al. 2002 and Reiner et al. 2003).A permutation test that preserves the pattern of among-GO co-variation in the calculation of the adjusted p-values was used. For each random permutation and for each GO term the exact p-value from Fisher's exact test for each contingency table is calculated. The FatiGO program returns four columns: the unadjusted p-value, which is the p-value from Fisher's exact test without adjusting for multiple comparisons, and the adjusted p-values based on the three methods described above. The results are ordered by decreasing value of the adjusted p-value, thus facilitating the selection of GO terms with the most significant differences.As previously mentioned, the growing interest by functional genomics makes more evident than ever the necessity of methods for studying properties shared by groups of genes that have a common behaviour. Direct use of biological information extracted from biomedical literature (Oliveros et al., 2000; Jenssen et al., 2001; Raychaudri et al., 2002) for studying such properties still supposes serious drawbacks (Blashke et al., 2002). One of them is that unless preprocessing is carried out, the volume of information to deal with is excessive for common on-line, interactive applications. The advantage of using GO terms is that interactivity is feasible, as our implementation, FatiGO, demonstrates. In addition, GO terms have a clear biological meaning, something that is not guaranteed with the approaches based on processing of free text. Besides, the number of terms is not as large as to expect a high number of artifactual associations of terms to clusters of genes just by chance. Despite a number of genes still lacking GO annotations the results found in the examples analyzed (see GEPAS examples page io.es/data) are informative enough to characterize the biological processes. In addition, as the number of genes with GO annotations increases in the next few years, functional genomics will benefit from the use of applications, such as FatiGO, based on GO terms.FatiGO addresses another common problem: the multiple ways in which genes are annotated. Different manufacturers of genomic platforms use distinct gene IDs. The most common gene IDs can be used as input for the application.Ontologies can be used as a quick and efficient information mining tool for the identification and validation of clusters of co-expressing genes studied (Pavlidi s et al., 2002; Mateos et al., 2002). To facilitate this use, FatiGO is coupled with the clustering programs of the GEPAS (io.es), a suite of programs for microarray gene expression data analysis (Herrero et al., 2003).We are currently implementing different types of biological information which include Interpro functional motifs, OMIM terms for diseases, protein interactions, pathways, etc. Finally, more organisms will be included as soon as their corresponding genomic projects produce high quality annotation results.AcknowledgementsFA is supported by a grant BIO2001-0068 from MCYT, RDU is supported by a Ramón y Cajal research contract from the MCYT. We are indebted to Amanda Wren for correcting the English of this manuscript.ReferencesAshburner, M.; Ball, C.A.; Blake, J.A.; Botstein, D.; Butler, H.; Cherry, J.M.; Davis, A.P.; Dolinski, K.; Dwight, S.S.; Eppig, J.T.; Harris, M.A.; Hill, D.P.; Issel-Traver, L.; Kasarskis, A.; Lewis, S.; Matese, J.C.; Richardson, J.E.; Ringwald, M.; Rubin, G.M.; Sherlock G.; (2000) Gene Ontology: tool for the unification of biology. Nat. Genet. 25:25-29.Benjamini, Y, and Hochberg, Y. (1995). Controlling the false discovery rate: a practical and powerful approach to multiple testing. Journal Royal Statistical Society B 57: 289-300.Benjamini, Y, and Yekutieli, D. (2001) The control of the false discovery rate in multiple testing under dependency. Annals of Statistics, 29:1165-1188Blaschke, C., Hirschman, L., Valencia, A. (2002) Information extraction in molecular biology. Briefings in Bioinformatics. 3: 154-165.Doniger S.W., Salomonis N., Dahlquist K.D., Vranizan K., Lawlor S.C., Conklin B.R. (2003) MAPPFinder: using Gene Ontology and GenMAPP to create a global gene-expression profile from microarray data. Genome Biol.4:R7Dudoit S., Shaffer J. P., and Boldrick J. C. (2002). Múltiple hypothesis testing in microarray experiments. Technical Report #110, Division of Biostatistics, UC Berkeley.Herrero, J., Al-Shahrour, F., Díaz-Uriarte, R., Mateos, Á., Vaquerizas, J.M., Santoyo, J. and Dopazo, J. (2003) GEPAS, a web-based resource for microarray gene expression data analysis. Nucleic Acids Research31:3461-3467Jenssen, T.-K.; Laegreid, A.; Komorowski, J.; Hovig, E. (2000) A literature network of human genes for high-throughput analysis of gene expression. Nature Genetics28:21-28.Khatri, P., Draghici, S., Ostermeier, G.C., Krawetz, S.A. (2002). Profiling gene expression using onto-express. Genomics79:1-5.Mateos, A.; Herrero, J.; Tamames,J.; Dopazo, J. (2002) Supervised neural networks for clustering conditions in DNA array data after reducing noise by clustering gene expression profiles. In Methods of Microarray Data Analysis II; Lin, S.; Johnson K.; Eds.; Kluwer. Pp. 91-103Oliveros, J.C.; Blaschke, C.; Herrero, J.; Dopazo, J.; Valencia, A. (2000) Expression profiles and biological function. Genome Informatics10:106-117.Pavlidis P., Lewis D.P., and Noble, W.S. (2002) Exploring Gene Expression Data with Class Scores. Pacific Symposium on Biocomputing7:474-485.Raychaudhuri S, Schutze H, Altman RB. (2002) Using text analysis to identify functionally coherent gene groups. Genome Res. 12:1582-90.Reiner, A., Yekutieli, D., Benjamini, Y. 2003. Identifying differentially expressed genes using false discovery rate controlling procedures. Bioinformatics, 19: 368-375.Robinson, M.D., Grigull, J., Mohammad, N., Hughes, T.R. (2002). FunSpect: a web-based cluster interpreter for yeast. BMC bioinformatics. 3:1-5Slonim, D. K. (2002) From patterns to pathways: gene expression data analysis comes of age. Nature Genetics Supplement (The Chipping Forecast), 32:502-508.Westfall, P. H. & Young, S. S. (1993) Resampling-based multiple testing. John Wiley & Sons. New York.。
蛋白组学数据分析流程1.首先收集蛋白组学数据,包括蛋白质表达水平、修饰和互作信息。
First, collect proteomic data, including protein expression levels, modifications, and interaction information.2.对数据进行质量控制,包括缺失值处理和异常值检测。
Perform quality control on the data, including handling missing values and detecting outliers.3.进行数据预处理,如归一化和标准化,以确保数据质量一致性。
Preprocess the data, such as normalization and standardization, to ensure data quality consistency.4.进行差异分析,筛选出在不同条件下显著改变的蛋白质。
Conduct differential analysis to identify proteins significantly altered under different conditions.5.进行蛋白质的特征筛选和重要性评估。
Perform feature selection and importance assessment for proteins.6.进行分类或聚类分析,识别不同样本之间的蛋白质表达模式。
Conduct classification or clustering analysis to identify protein expression patterns among different samples.7.进行通路富集分析,挖掘蛋白质在生物学通路中的功能和相互作用。
Perform pathway enrichment analysis to explore the functions and interactions of proteins in biological pathways.8.进行蛋白质网络分析,揭示蛋白质之间的复杂关系。
A robust method to detect structural andfunctional remote homologuesOri Shachar1 and Michal Linial2,31School of Computer Science and Engineering, 2Department of Biological Chemistry, Institute of Life Sciences, The Hebrew University, Jerusalem 91904, Israel3Corresponding authorMichal LinialFax: +972-2-6586448Phone: +972-2-6585425E. mail: michall@cc.huji.ac.ilAbstract: 181 wordsTables: 3Figures: 1Pages: 20Supplementary: http://www.protonet.cs.huji.ac.il/homologues/Total words: ~5640Running titleRemote homologues in protein familiesAbstractWith currently available sequence data, it is feasible to conduct extensive comparisons among large sets of protein sequences. It is still a much more challenging task to partition the protein space into structurally and functionally related families solely based on sequence comparisons. The ProtoNet system automatically generates a tree-like classification of the whole protein space. It stands to reason that this classification reflects evolutionary relationships, both close and remote. In this paper we examine this hypothesis. We present a semi-automatic procedure that singles out certain inner nodes in the ProtoNet tree that should ideally correspond to structurally and functionally defined protein families. We compare the performance of this method against several expert systems. Some of the competing methods incorporate additional extraneous information on protein structure or on enzymatic activities. The ProtoNet-based method performs at least as well as any of the methods with which it was compared. This paper illustrates the ProtoNet-based method on several evolutionarily diverse families. Using this new method, an evolutionary divergence scheme can be proposed for a large number of structural and functional related superfamilies.Keywords: Protein Family, Hierarchical classification, protein space, databaseIntroductionThe gap between the amount of sequences available and the number of homologous families known is still growing (Park et al., 1998; Russell et al., 1997). This paper addresses the problem of finding remote homologues in the sequence space and suggesting for any given protein sequence its relationship with other proteins, which basically form a structural or a functional homologous family.To fully appreciate the complexity of the problem one needs to imagine the whole sequence space of biologically functional sequences, where the pairwise distance between every pair of sequences is exactly the pairwise score given by some chosen method for sequence similarity (i.e. FASTA or BLAST, with any chosen substitution matrix, Stark et al., 2003). Our task of defining functional families would sum up to drawing an outline around all proteins that belong to the same functional family and thus separating them from all sequences of other families. For single domain proteins that have evolved by divergent evolution, such a description is valid, as in the case of the globin and histone families. However, for multi-domain proteins that may have resulted from the fusion of domains and for those that have evolved by convergent evolution (Saier, 1996), such a simplified partition of the protein sequence space is incompatible. Such groups of proteins that are related by convergence in evolution or that are linked through shared domains are abundant in the protein space. They are especially abundant in complex proteomes. In reality, methods for classifications of such cases into functional or structural families are not reliable.Most proteins, especially those derived from newly sequenced genomes, are not yet annotated and their evolutionary relations to other proteins are not evident. As a result, the task of expanding and generalizing the presently available classification schemes for new sequences is difficult and may result in a reduction of the quality of functional inference.The basic principle for classifying a new sequence is to test its identity and similarity to all other sequences in the database. Should it have a sequence identityof at least 30% with another sequence (throughout most of its length), a structural or a functional inference becomes valid. More accurately, functional annotation such as catalytic function of an enzyme requires at least 40% identity in amino acids (Rost, 2002), while reliable structural inference can be based on 25-30% sequence identity over at least 100 amino acids (Rost, 1999). Below these levels of pairwise sequence similarity, no unsupervised search method can suggest, with a reasonable confidence, the structural or functional relatedness to the closest homologue. While methods based on BLAST-based iterative profiles, Hidden Markov Models and methods for finding connections through intermediate sequences are superior in their sensitivity, they suffer from a higher level of false positives (Park et al., 1998). Specifically, PSI-BLAST, which is among the best search methods (Jones and Swindells, 2002), misses ~50% of all homologies when fixing the rate of false positives to 1/1000 (Karwath and King, 2002). In the case that the sequence similarity is below the level of secure inference (often referred to as the “twilight zone”), finding the protein family borders and the evolutionary remote homologues of a given protein is desirable. One should bear in mind that naïve sequence-based search methods that are based on similarity scoring are often inappropriate for multi-domain proteins and for proteins that are a result of convergent evolution.The inherent limitation of detecting remote homologues was estimated based on a structural benchmark (Miller et al., 1999). Several methodologies for navigating in the protein space for a better detection of remote homologues were proposed. These include sequence hopping (Holm and Sander, 1997), transitivity of homology (Brenner et al., 1998), intermediate sequences (Park et al., 1998), tuned iterative-profile (Schaffer et al., 2001), profile-profile (Yona and Levitt, 2002), jumping alignments (Spang et al., 2002), string-based kernels (Leslie et al., 2002), and some hybrid methods (Jaroszewski et al., 2000).Herein we suggest that a construction of the protein sequence space into a connected graph that captures the trace of evolutionary relatedness is useful in finding remote homologues. This method achieves satisfactory results that are comparable with results that rely on additional structural and functional knowledge. We suggest that the scaffold of the protein space as presented by ProtoNet (Sassonet al., 2003) can be used to infer structural and functional information for remote homologues with high reliability. The success in inferring structural and functional relatedness for selected families by the ProtoNet navigation method is discussed.MethodologyMethods for detecting remote homologuesA comparative study that tested the success in detecting remote homologues by various published strategies had been published (Holm, 1998). The list of protein homologues was manually selected to represent both structurally and functionally (i.e. similar enzymatic activities) related families of remote homology. The proteins in the test set were characterized by their very low pairwise sequence similarity.For each homologous family, multiple strategies were applied and combined with the goal of unifying the proteins that belong to the same evolutionary-related group. The strategies that were used included advanced sequence-based search methods, including FASTA walk (Pearson, 1994), PSI-BLAST (Altschul et al., 1997), HMMer (Karplus et al., 1998), MAST (Bailey and Gribskov, 1998), and PROBE (Giles, 1992). Each of the methods initiated a search from a query protein from the group of proteins, and the number of proteins from the group that were identified by the search as remote homologues was noted (Table 1). We used this set as a benchmark for testing the ability of the ProtoNet cluster-map of the protein space to perform such a unification of protein families. We evaluated and quantified the degree of specificity and sensitivity in detecting those families.ProtoNet graphWe base our study on the database of ProtoNet 2.4 (http://www.protonet.cs.huji.ac.il, Sasson et al., 2003). ProtoNet is an automatically generated hierarchical classification of all protein sequences from Swissprot (release 40.28 with 114,033 sequences). Each sequence is a vertex in a graph, and each pair of sequences defines an edge whose weight is the average pairwise BLAST E-score between those two sequences. A pairwise merging process is conducted aspart of an agglomerative clustering, where the initial sequences are used as singleton clusters. The clustering process follows an order of similarity, where each merge is the most significant in terms of the lowest average E-score between two groups of sequences. The main principle applied in ProtoNet is the extensive use of restricted transitivity based on hidden intermediate sequences, coupled with a statistical and biological validation of the hierarchy of the resulting graph. The resulting structure of the graph allows one to navigate through it and to evaluate the capacity of the ProtoNet algorithm to detect remote homologues (see examples in Sasson et al., 2002).Results and DiscussionUnifying protein families in ProtoNetProtoNet is a bottom-up tree construction in which biologically relevant connections between proteins are evident (Sasson et al., 2002). In the initial steps of the clustering process connections between closely related sequences are made, but at more advanced stages of the clustering process more questionable connections are included; at the root of the tree, all proteins are interconnected (except for a few hundred singletons). The hierarchical structure of the graph that is built by ProtoNet enables one to follow the connections between different groups of sequences when considering the progress of the clustering process. Intuitively, one can view it as a reflection of the evolutionary diverging process. As the clustering process advances, similar sequences aggregate to form groups that then unite to form sub-families. As the clustering algorithm progresses, the families are enlarged, thus forming superfamilies and making remote homologues prevalent. As the number of pairwise connections becomes sparse during the progress of the clustering algorithm (and the statistical significance of the pairwise connections are extremely low. i.e. BLAST E-score as low as 100), the representation of ProtoNet resembles a graph in which the edges connect groups of sequences (clusters) rather than individual sequences.The properties of the graph in view of its biological content was evaluated by comparing each cluster to other classification methods such as InterPro (Mulder et al., 2002), SCOP (Lo Conte et al., 2000), ENZYMES (Bairoch, 2000), and other external annotation sources. To evaluate the quality of ProtoNet clusters for structural and functional properties, we scored all best clusters. We define such a score as a correspondence score (CS). The CS for a certain cluster and a given keyword (i.e. Enolase N-terminal domain-like family, in SCOP) measures the correlation between the cluster and that keyword, using the intersect-union ratio.CS (cluster C for keyword K) = |c I k|/|c U k|=TP/(TP+FP+FN), where: c is the set of annotated proteins in cluster C, k is the set of proteins annotated with K, TP, FP, FN stand for true positives, false positives, and false negatives, respectively. TP = the number of proteins in cluster C that have keyword annotation K; FP = the number of annotated proteins in cluster C that do not have keyword annotation K; FN = the number of proteins not in cluster C that have keyword annotation K. The cluster receiving the maximal CS for keyword K is considered the cluster that best represents K within the ProtoNet tree, and is called the best cluster. The score for a given cluster on keyword K ranges from 0 (no correspondence) to 1 (maximal correspondence to the keyword, the cluster contains exactly all of the proteins with keyword K).For annotation keywords related to structural properties, we used all keywords based on SCOP (fold, superfamily, family and domain levels) and for a functional view, we used the ENZYME (4 levels of EC hierarchy) and GO (in 3 categories - molecular function, cellular process and cellular localization) annotations. A complete list of all annotations with the associated ProtoNet best clusters is available (www.protonet.cs.huji.ac.il/best_cluster/).The results from such analysis confirm that clusters that perfectly match functional and structural annotations as defined by the above listed sources are abundant within the ProtoNet graph. Representative results are shown in Table 1. The results for the SCOP family level (contains 1313 keywords) is CS=0.84 (with a higher score for proteins of a single domain, see discussion). By limiting the analysis for clusters size ranges from 20 to 1000 proteins, the CS is somewhat higher (0.86). Theaverage CS for best clusters for the E.C. ENZYME 4th level in hierarchy (contains 2157 keywords) is quite high, but drops significantly for the 3rd digit of the EC classification.Properties #keywords # best clusters CS a Specificity b Sensitivity CSCOP FamilyAll20-1000 131312839680.840.860.960.980.880.88SCOP SuperfamilyAll20-1000 8728546070.770.780.950.970.790.80Enzyme EC. 4th digitAll20-1000 2157215715810.750.760.880.880.840.85Enzyme EC. 3rd digitAll20-1000 2062061500.500.500.870.890.550.55Table 1. A global analysis for the correspondence of ProtoNet clusters with structural and functional properties. a Correspondence score. b Specificity = TP/ (TP+FP). c Sensitivity = TP / (TP+FN). See text for definitions.Results from the best cluster view point to a relatively narrow interval along the clustering process where the connection between protein families starts to dominate. Thus, two protein families that share the same cluster in the cluster-map described at that interval may be viewed as remote homologues. This last principle guided us when we tested for the ability of ProtoNet system to suggest remote homologues.To compare the ability of ProtoNet to detect remote homologues to that of other available search methods, we choose to test a manually selected set of remote homologues as presented in a comparative survey (Holm, 1998). In Table 2, examples of proteins that share structural and functional relatedness are listed. We duplicated the comparative analysis to include ProtoNet method as an additional, testable methodology in view of the previously described five state of the art methods for remote homologues detection.The remote family representatives are marked by the characteristics of the relevant protein functional family (i.e., Winged HTH DNA-binding domains, Table 2). We began each search with the query protein listed in Table 2, and ‘climbed’ thecluster hierarchy until reaching the largest cluster in which the target proteins that are included in the defined functional family are encountered. The process is aborted and no success is recorded when the cluster that includes the query and the target proteins annotate less than 85% of the proteins in the cluster (denoted as TP - true positives; un-annotated proteins are not considered for such procedure). The number of protein families and representatives that were united under that search was reported. In the case that the selected largest cluster is already contaminated by unrelated identifiers or keywords we marked it (by minus sign, Table 2) to indicate a failure in the purity specificity (purity) of the cluster.Functional family QuerysequenceA B C D E PN Cluster (# of proteins) Remarks 1. ompr_ecoli(1opc)2 1 1 1 2 2- 226420 (1088) low TP, Detected: 1b9w 2. argr_ecoli1 1 1 1 1 1 Winged HTH DNA-binding domains (1opc, 1aoy, 1dprB, 1hst, 1ecl, 1bgw, 1smtA, 1lea, 1fokA) 3. 1lea / / / / / 3 226170(348)TP = 1 for SF Detected: 1smtA, 1dprB 1. 1ah9 1 1 1 1 1 12. cspa_ecoli 1 1 1 1 0 1Nucleic-acid binding proteins with OB-fold 1. S1 domains, translation initiation factor IF1 (1ah9) 2. Cold shock protein (1mjc) (1asyA, 1lylA, 1cuk, 3ullA, 1cmkA, 1pfsA) 3. 1asy / / / / / 2 210265(143)Detected: 1lyl 1. tox3_borpe 1 1 0 1 0 11. Pertusis toxin2. Aerolysin (domain)3. LINK domains4. CTL domain2. Iems_human Ex 1 0 1 1 1 mod3_human 1 1 1 1 1 1 1. Chromo domain2. DNA-binding proteins (1sap)1sap 1 1 1 1 1 1 1. Mite allergen2. Immunoglobulin-likedef2_derfa 1 1 1 1 1 1 Urease **ure1_kleae 4 [+6] 7 10 1 3 10 225659 (253)TP = ~86% 1. mt16_yeast 1 3 2 2 3 2.nade_bacsu 1 3 3 1 11. PAPS reductase2. ATP sulphurylase3. N-type ATP Ppases (1nsyA, 1gpmA) 3. cysd_ecoli 33 3 3 3 3-226597(841) low TP for all three; high TP for 1 and 2in cluster 212193. 1. fhit_human 2[+1]3 3 3 1 1. HIT (4rhn) 2. Ap 4A hydrolase 3. GalT (1hxpA) 2. gal7_ecoli 11 3 1 12 221320 (48) Could not find Ap 4A proteins through search. High TP 1. 1ahu 12 2 0 1 1. Covalent NAD-binding oxidases (1ahu) 2. UDP-N-acetylenolpyruvoylglucosamine(2mbr)2. murb_ecoli 1[+1] 1 1 2 0 2 225895 (79) High TP 1. X81440 2 2 2 2 2 / Coenzyme A transferase1. Glutaconate2. Succinyl, acetate,3-oxoadipate,butyrate, etc2. atoa_ecoli 2 2 1 1 1 2 (*) 225850 (51) X81440 not present in Swissprot. The 2nd query unified this family 1. bphc_burce 1 2 2 1 2 1. Dioxygenase (1han)2. Glyoxylase (1froA) 2. igul_human 1 2 2 2 1 2 222839 (70)TP=1 for SF Including also 1bylfrom this SFTable paring the success in detecting remote homologues by alternative methods. Functional families that unify two or more sequence families were combined as in (Holm, 1998). The success in detection is marked by the number of successes in view of the predetermined representatives for remote homology. Alternative methods for remote homologue detection were applied over single query proteins and an enumeration of the sequence families that were recognized by each of the methods was recorded (a result of 1 means the query is recovered; zero indicates failure to identify it). A search in ProtoNet tree was performed in the same way by climbing the cluster hierarchy starting from a query protein and determining the cluster in which the protein identifier of the target proteins reached > 85% TP. The methods applied are abbreviated as follows: A. FASTA walk; B. PSI-BLAST; C. PROBE; D. GRIBSKOV and E. HMMer (according to Holm, 1998), PN. ProtoNet. The mark (-) indicates contamination by unrelated structural families. The mark (/) indicates a query examined solely by ProtoNet. Ex – the number of protein exploded. (*) The entry X81440 could not be matched in ProtoNet’s proteins, so we indicated the smallest cluster that unites both families of that query. (**) Discussed in detail in the text.Evaluating the success in detecting remote homologuesInspection of the results from Table 2 indicates that our simple procedure using the scaffold of ProtoNet clusters performs as well as the best method out of the five that were tested for almost every query. Note that the benchmark was completely independent of our work and was selected to evaluate the performance of the available five independent methods for detecting remote homologues. The different methods are based on exhaustive dynamic programming (FASTA), Iterative profile search (PSI-BLAST, PROBE) and traditional profile-based searches (GRIBSKOV, HMMer). For details on the listed methods, see (Holm, 1998).A strong characteristic of our method is its symmetry in the results between query and target protein. This is simply due to the symmetry of the search up a cluster tree – the cluster that unites a query A with a targetB is the same cluster that unites B with A when B is the query and A is the target. This symmetry property implies consistency of the search by the ProtoNet method. It can be appreciated from Table 1 in that the other methods do not perform symmetrically.Other main characteristics of our method are the simplicity and speed of the search, which requires only basic ProtoNet navigation skills of the user, and its robustness, as the cluster map platform already contains all sequences from Swissprot (ver. 40.28). Every sequence can be referred to as a query or target sequence for such a search.While performing our searches we were able to find in some functional families more examples of remote homologues that were not queried in the original benchmark (marked in bold, Table 2). These examples were found as a byproduct of the search in ProtoNet, and were added as additional representatives to enrich the list in Table 2.The protein family of the urease-related hydrolases serves to illustrate the traces of diversifying proteins throughout evolution. Several methods were applied to unify the members of the urease family (Heger and Holm, 2003). All methods used structural alignment, sequence alignment and profile-based search (Holm and Sander, 1997). The entire group, as defined in the original study (Holm and Sander, 1997), contains 12 protein families that share structurally similar active-site architecture. Of those proteins, 9 are members of the metallo-dependent hydrolases SCOP superfamily, 2 are members of a related superfamily named composite domain of metallo-dependent hydrolases, an additional one belongs to a different superfamily (arylphosphatase). Of the 12 hydrolases that are in the DB, ProtoNet defined 10 of them in a relatively pure cluster (A225659, 253 proteins). This cluster best represents the metallo-dependent hydrolases superfamily hierarchy.Inspecting this cluster obtained in ProtoNet shows that it includes all previously described urease-related superfamily proteins, as well as additional yet undefined related members as shown in Table 2. The different representatives in this large family all share an enzymatic activity marked by EC 3.5.-.-, with the exception of proteins having a different catalytic activity (EC 3.8.-.-.). Interestingly, the evolutionary and functional relatedness between those two apparently different activities was confirmed (Sadowsky et al., 1998). Additionally, not only is the high coverage of the urease-related superfamily (in cluster A225659) validated, butmonitoring the descendant clusters in the cluster-map provides a good description of the partition of this functional family into more refined subfamilies. Relationships between the subfamilies can be proposed and the divergence process of the family is traceable.Enzyme name # of proteins inE.C.the cluster / # inDB(1) Adenosine deaminase 28 / 28 3.5.4.4(2) Adenine deaminase, 6 / 6 3.5.4.2(3) Allantoinase 6 / 6 3.5.2.5(4) AMP deaminase 11 / 11 3.5.4.6(5) N-isopropylammelide isopropylamidohydrolase 1 / 1 3.5.99.4(6) Atrazine chlorohydrolase 1 / 1 3.8.1.8(7) Hydroxydechloroatrazine ethylamonohydrolase 1 / 1 3.5.99.3(8) Cytosine deaminase 1 / 3 3.5.4.1(9) Dihydropyrimidinase 2 10 / 10 3.5.2.2(10) Guanine deaminase 7 / 8 3.5.4.3(11) Imidazolonepropionase 23 / 23 3.5.2.7(12) N-acetylglucosamine-6-phosphate deacetylase 6 / 6 3.5.1.25(13) N-acyl-D-aspartate deacylase 1 / 1 3.5.1.83(14) D-aminoacylase 1 / 1 3.5.1.81(15) N-acyl-D-glutamate deacylase 1 / 1 3.5.1.82(16) Dihydroorotase (DHOase) 49 / 49 3.5.2.3(17) Urease (Urea amidohydrolase) 78 / 78 3.5.1.5Table 3.The enzymatic groups that are associated with ProtoNet cluster A225659. The annotations for 17 different groups are extracted from the ENZYME database. Note that for almost all groups the coverage is complete, with no additional proteins carrying the same enzymatic activity reported in the database used.Fig. 1 shows the pairwise similarity within proteins of the cluster A225659 (253 proteins) as a matrix reflecting all-against–all pairwise similarity BLAST E-scores. Darkest color indicates a maximal BLAST E-score (E-score = 0). The gradient in color intensity indicates a decrease in the similarity score. White indicates an E-score that is worse than 100. The domination of the white color reflects the very low pairwise similarity among proteins in the cluster. Among all possible pairwise connections, ~70% are worse than E-score 100, indicating the sequence remoteness resulting from the BLAST search. The order of the proteins in the matrix reflects the construction of the ProtoNet tree for this sub-graph (starting at the bottom right towards top left). An interactive illustration (color-coded) of the weak connections between all 253 proteins in this cluster is provided at www.protonet.cs.huji.ac.il/homologues/.Dihydropyrimidinase3.5.2.2Urease beta subunit3.5.1.5Urease alpha subunit3.5.1.5Figure 1. All-against-all BLAST E-score in a sub-tree of ProtoNet for urease related proteins. Representative enzymatic activity of some of the proteins is shown in the callouts. The matrix shows all 253 proteins in cluster A225659. Black indicates maximal BLAST E-score (E-score=0). Dark grey indicates very significant pairwise similarity. A gradient of black to white parallels a decrease in the similarity score.In addition to the examples described in Table 3 and in Fig. 1, additional remote homologues are easily detected. For example, the proteins that share the histone core proteins H2A, H2B, H3 and H4 are linked together in a sub-tree of ProtoNet with a variety of transcription factors, such as the transcriptional initiator TFIIB, TFIID, TATA box, CAAC box binding protein and more. Despite extremely low sequence similarity (cluster A224843, 284 proteins), all these proteins share an identical structural fold (Baxevanis and Landsman, 1998).In another very interesting case, similarity between alcohol dehydrogenases and crystalline of the eye and some proteins in synaptic vesicles in the nerve system has been proposed (Linial and Levius, 1993). Such homology is apparent at the sequence similarity level only through some weak connecting intermediate sequences. Proteins of the alcohol-dehydrogenases (also polyol-, threonine-, archaeon glucose-dehydrogenases), eye lens zeta-crystallins, E. coli quinone oxidoreductase, synaptic vesicle VAT-1 proteins, enoyl reductases of mammalian fatty acid and yeast erythronolide synthases share the same structural fold with only very few conserved amino acids throughout this diverged superfamily (Persson et al., 1994). This superfamily was termed medium-chain dehydrogenases/reductases (MDR). A cluster in ProtoNet with 226 proteins (cluster A220748) combines all the MDR proteins that carry very different functional role but nevertheless, share a high degree of structural and biophysical properties. By using the interactive visualization tools within ProtoNet (http://www.protonet.cs.huji.ac.il/), the connectivity among the proteins of the MDR superfamily is shown. Note that the intermediate sequences that connect specific families are traceable by inspecting the pairwise matrix (as in Fig. 1 and see www.protonet.cs.huji.ac.il/homologues/).The ProtoNet tree allows for the testing of the connectivity among proteins, thus detecting remote homologues (Fig. 2). However, our examples are based on analyzing proteins from the Swissprot database (~114.000 proteins). As the number of protein sequences currently available is at least 10 times higher, the relevance and the robustness of our method towards larger database should be re-evaluated. We developed an extended version of ProtoNet that includes over one million proteins (ProtoNet 3.0), based on Swissprot 41.12 combined with TrEMBL 24.8.。
Bioinformatics Advance Access published February 19, 2004Yeast Function Prediction Cai & Doig1 Prediction of Saccharomyces Cerevisiae Protein Functional Class fromFunctional Domain CompositionYudong Cai & Andrew J. Doig*Department of Biomolecular Sciences, UMIST, P.O. Box 88, Manchester M60 1QD, UK.* To whom correspondence should be addressed: Phone: +44-161-2004224, Fax: +44-161-2360409, e-mail: Andrew.Doig@Running title: Protein Function Prediction by Domain CompositionKey Words: yeast, functional genomics, Support Vector Machines, InterPro, nearest neighbour; InterProAbbreviations:NNA, Nearest Neighbour Algorithm; SVM, Support Vector Machine; ORF, Open Reading FrameCopyright (c) 2004 Oxford University PressABSTRACTMotivation: A key goal of genomics is to assign function to genes, especially for orphan sequences.Results:We compared the clustered functional domains in the SBASE database to each protein sequence using BLASTP. This representation for a protein is a vector, where each of the non-zero entries in the vector indicates a significant match between the sequence of interest and the SBASE domain. The machine learning methods Nearest Neighbour Algorithm and Support Vector Machines are used for predicting protein functional classes from this information. We find that the best results are found using the SBASE-A database and the Nearest Neighbour Algorithm, namely 72% accuracy for 79% coverage. We tested assigning function based on searching for InterPro sequence motifs and by taking the most significant BLAST match within the dataset. We applied the functional domain composition method to predict the functional class of 2018 currently unclassified yeast ORFs. Availability: A program for the prediction method, called FCPFD (Functional Class Prediction based on Functional Domains), is available by contacting Y.D. Cai aty.cai@.INTRODUCTIONThe most widely used methods for predicting the function of a new protein sequence involve sequence alignment, either global (over the entire sequence) or local (as in BLAST or FASTA) (Altschul, et al., 1997, Pearson, 1996). Advanced sequence comparison methods (e.g. PSI-Blast (Altschul, et al., 1997)) have pushed the level of sequence identity required to infer homology down to below 20%. The identification of sequence motifs or pattern matching tools is another powerful method to predict function. For example, the PRINTS (Attwood, et al., 2000), BLOCKS (Henikoff, et al., 1999), Pfam (Bateman, et al., 2000), ProDom (Corpet, et al., 1999), SMART (Ponting, et al., 1999), Domo (Gracy and Argos, 1998), Identify (Nevill-Manning, et al., 1998), PROF-PAT (Bachinsky, et al., 2000) and PROSITE (Hofmann, et al., 1999) databases can be used to search an unknown sequence for hundreds of known motifs. InterPro integrates numerous resources for protein families, domains and functional sites (Apweiler, et al., 2000). Correlations between short signals and functional annotations in a protein database can be used (Perez, et al., 2002). Alternatively, structure can first be predicted and then used to infer function (Skolnick and Fetrow, 2000), such as by searching for three-dimensional structural templates of sequence motifs (Kasuya and Thornton, 1999). Even a low level of structure prediction, such as an assignment into a broad fold class, is useful in function prediction, since fold classes show trends for particular functions (Hegyi and Gerstein, 1999).More recent methods go beyond sequence matching (Eisenberg, et al., 2000, Marcotte, 2000, Pellegrini, 2001). A phylogenetic profile shows the pattern of presence or absence of a protein between genomes. Proteins that have the same phylogenetic profiles can be inferred to be functionally related (Pellegrini, et al., 1999). Protein-protein interactions can be predicted by searching for interacting pairs of proteins that are fused to a single protein chain in another organism (Marcotte, et al., 1999), as such pairs are often functionally related (the Rosetta Stone method). The gene neighbour method uses the observation that if the genes that encode two proteins are close on a chromosome, the proteins tend to befunctionally related (Dandekar, et al., 1999, Overbeek, et al., 1999). While such methods can be powerful (Marcotte, et al., 1999), they are limited to cases where their presence varies between genomes, gene fusion has occurred or a set of gene neighbours are observed, and so are not applicable to all cases. More general methods are therefore often needed. Predictions of human protein functional classes and enzyme categories were made with neural networks using sequence properties such as phosphorylation sequences, number of charged residues, predicted secondary structure and average hydrophobicity (Jensen, et al., 2002). Functional class can also be predicted using amino acid and amino acid pair composition (Morrison, et al., 2003). Data mining prediction methods devise rules in the form of IF… THEN statements that make predictions of function using sequence based attributes, predicted secondary structure and sequence similarity. These have been shown to give accurate predictions for a limited number of sequences in the E. coli and M. tuberculosis genomes, sometimes in the absence of homology (King, et al., 2000, King, et al., 2001).The major difficulty in this field is finding any information for the large number of genes that are so distant from any known sequence that alignment methods cannot offer any prediction. Traditional sequence alignment and pattern matching approaches are generally not capable of detecting functional and structural homologues when sequence identity falls below about 20%. There is therefore a great need for methodologies capable of predicting protein function within this twilight zone and beyond. This situation is not uncommon: for example, there are no apparent orthologues for 1/3 of the yeast genome (≈2000 proteins)(http://mips.gsf.de/proj/yeast/catalogues/) and ≈15,000 proteins of totally unknown function within the human genome (http://www.genome.ad.jp/dbget-bin/get_htext?H.sapiens.kegg). Here we use functional domain composition to predict protein function. These approaches are not intended to replace existing profile or homology-based search protocols, rather to use alternative data/patterns in the sequence data to go beyond traditional approaches.The yeast Saccharomyces cerevisiae was the first eukaryotic organism to have its entire genome sequenced (Goffeau, et al., 1996, Mewes, et al., 1997, Zagulski, et al., 1998).The challenge now is identification of the Open Reading Frames (ORFs) and complete functional assignment of these coding regions. Experimental assignment of these ORFs, such as the EUROFAN project (Dujon, 1998), usually takes the form of deletion studies. The ORF of interest is deleted or its expression suppressed. Its function is then inferred from the resulting phenotype under different environmental conditions, for example by withdrawing certain nutrients from the growth media. Alternatively, analysis of cellular mRNA levels can reveal co-expression of certain ORFs under certain environmental conditions. Co-expression of two or more ORFs implies that they function as part of the same cellular pathway. These methods are both time-consuming and expensive.Here, we present a method for predicting the functions of yeast ORF functions from functional domain composition. We believe this will be a key tool for increasing the throughput of experimental studies. The results of the method will act as a guide to the possible functions an ORF can adopt, whilst virtually eliminating some functions altogether. Experimentalists may therefore approach functional assignment experiments already knowing the most likely and the least likely functions of all ORFs in the yeast genome.METHODSDatasetThe MIPS database contains 6294 ORFs of Saccharomyces cerevisiae. The aim of this project is to assign a protein into one of 13 functional classes (Metabolism; Energy; Cell Growth; Transcription; Protein Syntheses; Protein Destination; Transport Facilitation; Intracellular Transport; Cellular Biosynthesis; Signal Transduction; Cell Rescue; Cellular Homeostasis and Cellular Organisation), as defined using the MIPS classification system (Mewes, et al., 1999). MIPS assignments were taken from the May 2001 release. A non-homologous data set was generated using CLUSTAL-W (Thompson, et al., 1994) to leave no two proteins having greater than 20% sequence identity. 3484 sequences of known functionwere reduced to 3010 sequences in the training set (listed in Supplementary Information, Table 1).Functional Domain CompositionWe use SBASE, a collection of around 300,000 annotated structural, functional, ligand-binding and topogenic segments of proteins collected from the literature, protein sequence databases and genomic databases (Vlahovicek, et al., 2002). The protein domains are defined by their sequence boundaries given by the publishing authors or in one of the primary sequence databases (Swiss-Prot, PIR, TREMBL etc.). Domain groups are included if they have well defined sequence boundaries, and if they can be distinguished from other sequences using a similarity search technique. The SBASE database uses a set theoretical approach for representing similarities. Sequences are considered similar if they are members of a similarity group in which all or most sequences are similar to each other and less similar to other members of the database. SBASE-A and SBASE-B Release 9.0 were used(ftp://ftp.icgeb.trieste.it/pub/SBASE (Vlahovicek, et al., 2002)). There are 2425 domain types in SBASE-A (The consolidated domain collection. Release 9.0) and 739 domain types in SBASE-B (Miscellaneous experimental domain groups. Release 9.0).We use a set of discrete numbers as a vector to define the native functional domains within a protein sequence. With each of the 2425 or 739 domains as a vector-base, a protein can be defined as a 2425-D or 739-D (dimensional) vector according to the following procedure:(1)Use BLASTP to compare a protein sequence with each of the 300000 sequences groupedin 2425 domain sequences in SBASE-A or 739 domain sequences in SBASE-B to find the high-scoring segment pairs (HSPs) and the smallest sum probability (P).(2)If the HSP score >> 70 and P < 0.8 for SBASE-A, or the HSP score >> 30 and P < 1.0 forSBASE-B in comparing the protein sequence with the i-th domain sequence, then the i-thcomponent of the protein in the 2425-D or 739-D space is assigned the HSP score;otherwise, it is assigned a value of zero.(3) The vector for each protein sequence can thus be explicitly formulated asX = (X1, X2… X2425)whereX1 =HSP score, when HSP score >> 75 (30) and P < 0.8 (1.0)0, otherwiseNearest Neighbour Algorithm (NNA)The Nearest Neighbour Algorithm (NNA) (Cover and Hart, 1967, Friedman , et al.,1975) can be used particularly in the situations when the distributions of the patterns and the categories of the patterns are unknown. NNA classifies the new patterns into their classmembership by comparing the features of the unknown new patterns with the features of the patterns that have already been classified. The approach will weight heavily the evidence derived from the nearby patterns. It is attractive because it is simple to implement and has a low probability of error.Consider a set of patterns x 1, x 2… x n which have been classified into categories 1,2… n , from which an unknown sample x can be classified into those categories using the NNA. Firstly, the nearest neighbour of x can be defined asnn(x) = x iwhere d(x, x i ) = min k =1nd (x , x k )The nearest neighbour algorithm chooses to classify x to the category χj ∈ {1, 2…m } if its nearest neighbour also belongs to the category χj ∈ {1, 2… m }. It can beexpressed as:If nn(x) = xi and xi∈χj∈ {1, 2… m}Then x ∈χjThe score is defined as:d(x, xi ) = 1 – (x xi)/(x xi).We rank the prediction categories of each protein into {1,2…m} if and only ifmin(d(x,xi )(xi∈1))≤min(d(x,xi)(xi∈2))≤ … ≤min(d(x,xi)(xi∈m))Here we use “≤” because some proteins belong to more than one category (they are multifunctional) or some proteins whose functions are different share the same domains.For each protein I, in the dataset of the N function-known proteins, we create a vector X(I, J) (I=1…N, J=1…M) by searching the domain database (M domain types). For a function-unknown protein N+1, we determine its vector X(N+1, J) (J=1…M) by the domain database search. We then calculate the similarity score between protein I and each function-known protein:Score(N+1,I)=1−(X(I,J).X(N+1,J))/(X(I,J)X(N+1,J))I=1…N, J=1…MWe rank the prediction classes of protein I into {Class(1), Class(2)… Class(m)} (m is the number of functional classes) if and only ifmin(Score(N+1,Ii )Ii∈Class(1)≤min(Score(N+1,Ii)Ii∈Class(2)≤...≤Score(N+1,Ii )Ii∈Class(m)))Two examples of the results are found in Tables 1 and 2.Support Vector Machines (SVMs)Support Vector Machines (SVMs) are a class of learning machines based on statistical learning theory. The basic idea of applying SVM to pattern classification can be stated as follows: First, map the input vectors into one feature space (possible with a higher dimension), either linearly or non-linearly, which is relevant to the selection of the kernel function. Then, within the feature space from the first step, seek an optimized linear division.i.e. construct a hyperplane which separates two classes. (This can be extended to more than two classes). SVM training always seeks a global optimized solution and avoids over-fitting,so it has the ability to deal with a large number of features. A complete description of thetheory of SVMs for pattern recognition is in Vapnik's book (Vapnik, 1998). SVMs have been used in a range of problems including drug design (Burbridge , et al., 2000), imagerecognition and text classification (Joachims, 1998).In this paper, we apply Vapnik's Support Vector Machine (Vapnik, 1995) forpredicting the protein functional class. We downloaded the SVMlight program which is an implementation (in C Language) of SVM for the problem of pattern recognition. Theoptimization algorithm used in SVMlight has been described (Joachims, 1999, Joachims,1999). The code has been used in text classification and image recognition (Joachims, 1998).Suppose we are given a set of samples, i.e., a series of input vectorsX i ∈R d (i =1,...,N )with corresponding labels y i ∈{+1,−1}(i =1,...,N ).where –1 and +1 are used to stand respectively for the two classes. The goal here is to construct one binary classifier or derive one decision function which has a small probability of misclassifying a future sample (from the available samples). Both the basic linearseparable case and the most useful linear non-separable case for most real life problems are considered here:The linearly separable caseIn this case, there exists a separating hyper plane whose function is 0=+〈b X W v r ,which implies:y i (r W •r x i +b )≥1,i =1,...,N By minimizing 12r W 2 subject to this constraint, the SVM approach tries to find a unique separating hyperplane. Here 2r w is the Euclidean norm of w r , which maximizes thedistance between the hyper plane (Optimal Separating Hyperplane or OSH (Cortes and Vapnik, 1995) and the nearest data points of each class. The classifier is called the largest margin classifier. By introducing Lagrange multipliers i , using the Karush-Kuhn-Tucker conditions and the Wolfe dual theorem of optimization theory, the SVM training procedure amounts to solving the following convex QP problem:Max :i −12i =1n ∑i j j =1n ∑i =1n ∑⋅y i y j ⋅r X i •r X j subject to the following two conditions:i ≥0i i y =0,i =1,...,Ni =1N ∑The solution is a unique globally optimized result having the following expansion: r W =i y i i =1N ∑i⋅r x Only if the corresponding i >0, are these x i rcalled Support Vectors. When a SVMis trained, the decision function can be written as:f (r x )=sgn(y i i i ⋅r x •v x i =1N ∑+b )where ()sgn in the above formula is the given sign function.The linearly non-separable caseTwo important techniques needed for this case are given respectively as below:(i) “soft margin” technique.In order to allow for training errors, Cortes and Vapnik (Cortes and Vapnik, 1995)introduced slack variables:N i i ,...,1,0=>The relaxed separation constraint is given as:i y (w •i r x +b )≥1−i ,),...,1(N i =The OSH can be found by minimizing 122w +C i i =1N ∑instead of 122w for the above two constraints.Where C is a regularization parameter used to decide a trade- off between the training error and the margin.(ii) “kernel substitution” techniqueSVM performs a nonlinear mapping of the input vector x from the input space dR into a higher dimensional Hilbert space, where the mapping is determined by the kernel function. Then as in the linearly separable case, it finds the OSH in the space Hcorresponding to a non-linear boundary in the input space.Two typical kernel functions are listed below:K (i r x ,j r x )=d(i r x •j r x +1)K (i r x ,j r x )=exp(−r 2i r x −j r x )Where the first one is called the polynomial kernel function of degree d which willeventually revert to the linear function when d =1, the latter one is called the RBF (Radial Basic Function) kernel. Finally, for the selected kernel function, the learning task amounts to solving the following QP problem,Max :i −12i =1N ∑i j j =1N ∑i =1N ∑⋅y i y j ⋅K (r X i •r X j )subject to:0≤i a ≤Ci i y =0,i =1,...,Ni =1N ∑The form of the decision function isf (r x )=sgn(y i i ⋅K r x ,r x i ()i =1N ∑+b )For a given data set, only the kernel function and the regularity parameter C must beselected to specify one SVM. In this work we used the radial basis function and set C to 1000.InterProAn alternative to SBASE would be to use InterPro (Apweiler , et al., 2000) to searchthe entire training set for hits to motifs in PROSITE, PRINTS, ProDom, Pfam, SMART,TIGRFAMs, SWISS-PROT and TrEMBL. We therefore submitted the entire set of yeast ORFs to InterPro. We found that 1662 ORFs in the unknown protein MIPS class had hits from InterPro, while there were 2018 hits in this class for SBASE-A. Hence SBASE was more useful in this case.We used InterPro to predict functional class as follows: We used InterPro release 5.2(Mulder , et al., 2003), built from Pfam 7.3, PRINTS 33.0, PROSITE 17.5, ProDom 2001.3,SMART 3.1, TIGRFAMs 1.2 and the current SWISS-PROT and TrEMBL data. This release of InterPro contains 5875 entries, representing 1272 domains, 4491 families, 97 repeats and 15 post-translational modification sites. Each ORF is coded as a 5875 dimensional vectorwith an entry of 1 if there is a hit with a domain, otherwise, 0. This is the input vector for the NNA, implemented as above.BLASTWe used BLAST to predict functional class as follows: A BLAST search for the 3010ORFs in the training set was performed by searching each sequence against the remaining3009 ORFs. The functional class of the best match was taken as the prediction, regardless of any HSP score cut-off.RESULTSJackknife test using Nearest Neighbour AlgorithmWe examined the prediction quality by the jackknife test, a leave-one-out cross validation. During the process of the jackknife test, the training and testing datasets are open, and a protein will in turn move from each to the other. The function domain composition of each protein is input to the NNA. Examples of the results are shown in Tables 1 and 2. From Table 2, we can see this method can give some false positives (i.e. YAL020C scores equally highly for classes 3, 4, 8 and 13, though only 13 is correct). This is because some different functional classes share the domains.Insert Tables 1 and 2For the total number of 3010 ORFs, the results are shown in Tables 3, 4, 5 and 6. The complete set of results for SBASE-A are in Supplementary Information, Table 2. For a significant proportion of the ORFs (21% for SBASE-A and 8% for SBASE-B) no prediction can be made. These are 435 sequences that have no hits to any motif in SBASE-A and 194 orphan proteins that have no common domains with any other sequence, leaving 2381 sequences for which predictions can be made. If a prediction can be made it is usually correct. Table 4 subdivides the results by functional class, showing considerable variation, depending on the frequency of SBASE motifs in each class. Transport facilitation is most accurately predicted at 90% accuracy using SBASE-A, while Cellular Biogenesis much worse than any other functional class at 15% using SBASE-A. Our overall success rate of 72% accuracy for 79% coverage compares very well to a random guess (19%, given that the mean number of class assignments is 2.4), especially given that homologous sequences have been removed from the training set. According to the yeast genome database(http://mips.gsf.de/proj/yeast/CYGD/db/index.html) of December 2002, 3289/6317 (52%) ofproteins are of known function, while 1046/6317 (17%) can be assigned a function based on a FASTA similarity to a known protein. This leaves 1982/6317 (32%) of unknown function. Our success rates therefore compare favourably to existing methods.Insert Tables 3, 4, 5 and 6Jackknife test using Support Vector MachinesFor the SVMs, we chose a Gaussian Radial Basis Function as the kernel function. The width of the Gaussian RBFs (in this paper, we use the default value in SVMlight ) is selected as that which minimized an estimate of the VC-dimension. The parameter C that controls the error-margin tradeoff is set at 1000. The function domain composition of each protein is input to the SVMs. After being trained, the hyperplane output by the SVMs was obtained. This indicates that the trained model, i.e. hyperplane output which includes the important information, is able to identify the protein functional classes. The SVM method applies to two-class problems. In this paper, for the 13-class problems, we use a simple and effective method: “all-versus-all” method (Ding and Dubchak, 2001) to transfer it into a two-class problem. We used leave-one-out cross-validation (jackknife test). 435 sequences have no matches to any SBASE-A sequences so 435/3010 = 14.5% of sequences have no prediction. For the remaining 2575 the success rates are given in Table 7, namely 36% for 86% coverage.Insert Table 7The results in Tables 3, 5 and 7 show that the nearest neighbour algorithm is better than the SVMs, despite being computationally much simpler. This may be because the nature of the large and complicated training set is a particular problem for an SVM. The SBASE-A search is better than SBASE-B search. This is probably because the 2425 domains in SBASE-A are long enough to avoid false positive hits when using a BLAST search. As the 739 domains in SBASE-B are quite short, false positive hits from a BLAST search are likely. The false positives are noise for the prediction. Our previous work used amino acid composition and amino acid pair composition to assign MIPS functional class using theSIMCA algorithm (Morrison, et al., 2003). The accuracy of that work was considerably lower (32%), though the coverage was higher (98%).Functional Class Assignment using InterProWe ran the 3010 protein sequences in the training set through InterPro, searching for sequence motifs. 2423 sequences had InterPro hits, leaving 587 that could not be assigned with this method. Table 8 shows the accuracy of the InterPro assignments. The overall success rate of 71% and the coverage (81%) are comparable to the SBASE-A NNA method (72% accuracy and 79% coverage). The pattern of success rate by class is similar with the two methods as class 9, cellular biogenesis, remained particularly problematic.Functional Class Assignment using BLASTWe compared all of the 3010 protein sequences in the training set against each other, using no cut-off and taking the class of highest scoring sequence as the prediction, no matter how poor the alignment, giving the results shown in Table 9. Despite the training set containing only non-homologous sequences, the resulting poor alignments were still useful, giving an overall accuracy of 70%. This is still a little poorer than the SBASE-A NNA or the InterPro methods. However, the coverage is now 100%. The success rate by class is again similar to the previous methods.Application to Unclassified GenesThe January 2002 release of the MIPS functional classification scheme lists 115 ORFs as Classification Not Yet Clear Cut and 2399 as Unclassified Proteins. We applied our functional domain composition method using the SBASE-A database and the NNA algorithm to predict the functions of these proteins. From these 2845, 827 cannot be predicted with this method as they have no matches to any functional domain. Predictions for the remaining 2018 ORFs are in the Table 3 in the Supplementary Information. While these sequences have no significant sequence identity to any ORFs of known function in the remainder of thegenome, this is also true for our training set. We therefore expect that these predictions will also have an accuracy of approximately 70%.DISCUSSIONOur results show that the functional class of a protein in the s. cerevisiae genome is predictable with high accuracy and coverage. The development in statistical prediction of protein attributes generally consists of two aspects: one is to construct a training dataset and the other is to formulate a prediction algorithm. The latter can be further separated into two sub-sections: one is how to give a mathematical expression to effectively represent a protein sequence and the other is how to find an algorithm to accurately perform the prediction. Here, our training dataset contains 3010 non-homology ORFs which are refined from the whole yeast genome. The functional domain composition incorporates both the sequence-order information and the functional type information and should complement other methods for protein functional class prediction. Success rates and coverage for different methods are summarised in Table 10. The Nearest Neighbour algorithm gave a much better performance than Support Vector Machines and is much faster to run. The results using the SBASE-A domain database were slightly more accurate to InterPro and BLAST.Insert Table 10Our predictions for the previously unclassified proteins should be of great value to programs determining experimentally the function of yeast genes, notably the EUROFAN project (Dujon, 1998). The methodology we present should also be generally applicable to all genomes with functional classification schemes that can be used for training.The program of the prediction method which use NNA, called FCPFD (Functional Class Prediction based on Functional Domains), is available by contacting Y.D. Cai aty.cai@.AcknowledgementsThis work was funded by the BBSRC (grant number 36/BIO14432).REFERENCESAltschul, S. F., Madden, T. L., Schäffer, A. A., Zhang, J., Zhang, Z., Miller, W. and Lipman,D. J. (1997) Gapped BLAST and PSI-BLAST: a new generation of protein databasesearch programs. Nuc. Acids Res., 25, 3389-402.Apweiler, R., Attwood, T. K., Bairoch, A., Bateman, A., Birney, E., Biswas, M., Bucher, P., Cerutti, L., Corpet, F., Croning, M. D. R., Durbin, R., Falquet, L., Fleischmann, W., Gouzy, J., Hermjakob, H., Hulo, N., Jonassen, I., Kahn, D., Kanapin, A.,Karavidopoulou, Y., Lopez, R., Marx, B., Mulder, N. J., Oinn, T. M., Pagni, M.,Servant, F., Sigrist, C. J. A. and Zdobnov, E. M. (2000) InterPro—an integrateddocumentation resource for protein families, domains and functional sites.Bioinformatics, 16, 1145-1150.Attwood, T. K., Croning, M. D. R., Flower, D. R., Lewis, A. P., Mabey, J. E., Scordis, P., Selley, J. and Wright, W. (2000) PRINT-S: the database formerly known as PRINTS.Nuc. Acids Res., 28, 225-227.Bachinsky, A. G., Frolov, A. S., Naumochkin, A. N., Nizolenko, L. P. and Yarigin, A. A.(2000) PROF-PAT 1.3: updated database of patterns used to detect local similarities.Bioinformatics, 16, 358-366.Bateman, A., Birney, E., Durbin, R., Eddy, S. R., Howe, K. L. and Sonnhammer, E. L. L.(2000) The Pfam protein families database. Nuc. Acids Res., 28, 263-266. Burbridge, R., Trotter, M., Holden, S. and Buxton, B. (2000) Drug Design by Machine Learning: Support Vector Machine for Pharmaceutical Data Analysis. Proceedings of the AISB’00 Symposium on Artificial Intelligence in Bioinformatics, 1-4.Corpet, F., Gouzy, J. and Kahn, D. (1999) Recent improvements of the ProDom database of protein domain families. Nuc. Acids Res., 27, 263-7.Cortes, C. and Vapnik, V. (1995) Support vector networks. Machine Learning, 20, 273-293.。