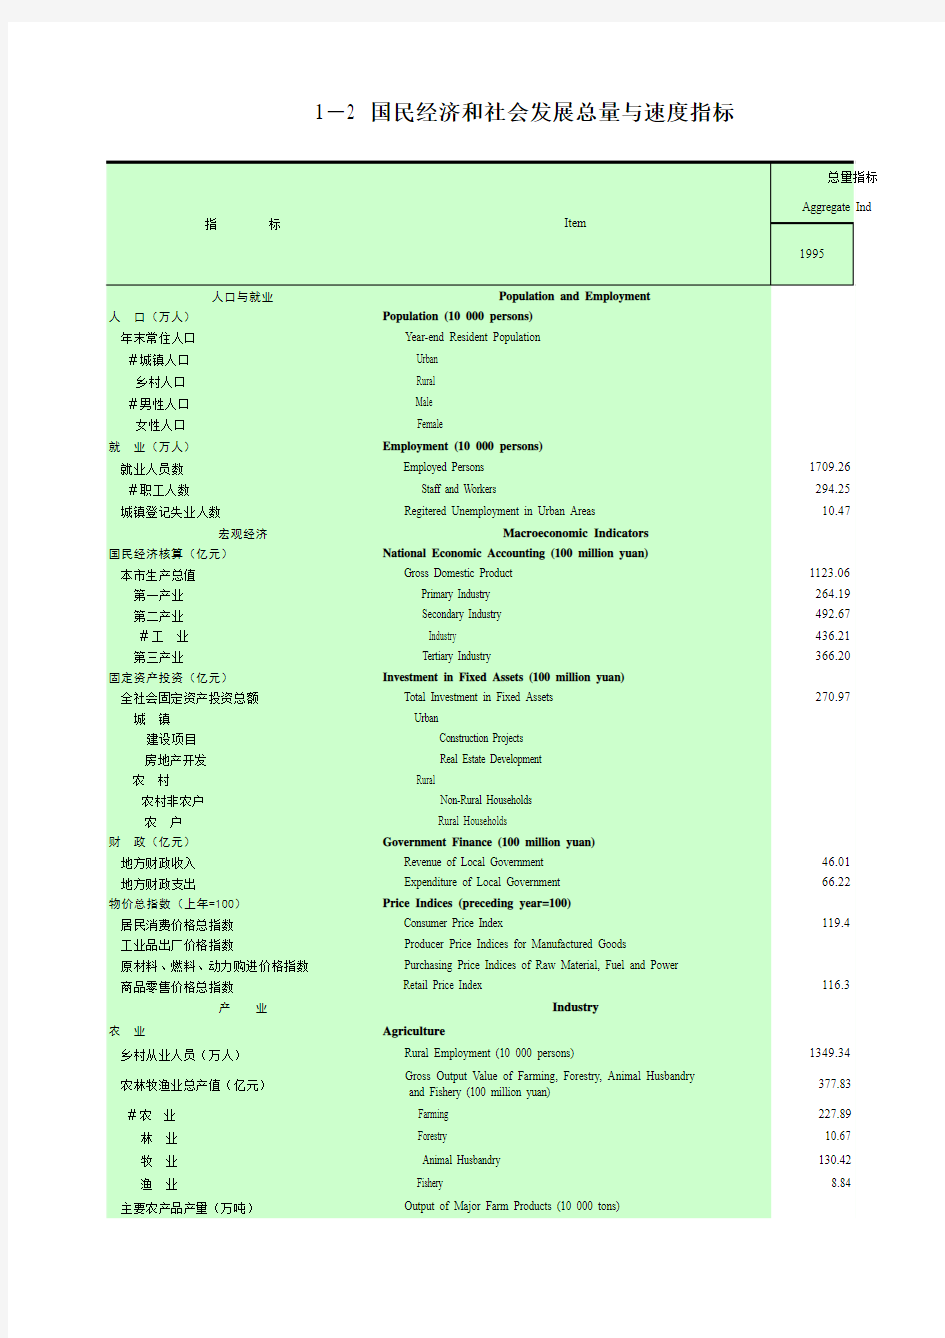

1-2 国民经济和社会发展总量与速度指标
注:1)本表数据本市生产总值、工业增加值速度指标按可比价计算,其余指标均为自然增长。
2)工业总产值的绝对值和指数按现价计算;工业增加值的绝对值按现价计算,指数按可比价计算。
3)建筑业2003年起的所有数据均不包括劳务分包企业;其增加值2003年前按工程结算利润计算,从2003年起按 营业利润计算(以下各表同)。
4)从2000年起民航货运量按新制度统计,旅客行李不再计入货运。
5)1996年起铁路数据按重庆现地域进行了调整(以下各表同)。
6)2008年公路、水路数据按部门专项调查作了调整。
7)邮电业务总量2001年前为1990年不变价,2001年及以后为2000年不变价口径(以下各表同)。
8)普通高等学校数据含研究生。
9)“城市居民人均房屋建筑面积”2002年前数据为“人均房屋居住面积”。
10)2002年起卫生统计指标名称变更,统计口径变化,不可与往年同比:2002年起卫生技术人员和床位不包括医学院校、卫生学校和计生站;执业(Note:1) The indicators of GDP and growth rate of value-added of industry are calculated at constant prices, while the other indicators are the value of nat
2) The value and index of gross output value of industry are calculated at current price; the value-added of industry is calculated at current price while the index is calc
3) All the data of construction has not included labor subcontractors since 2003. The value-added is calculated upon the settled profit before 2003 and upon the operat
4) Since 2000, the cargo turnover of civil aviation has been calculated by the new statistic system, and the luggage of passengers is no
longer accounted in.
5) The data of railway has been modified based on the present administrative division of Chongqing since 1996 (the same for the tables below).
6) The data of highway and waterway has been modified according to the specialized survey by the related departments since 2008.
7) The business volumes of postal and telecommunication services before 2001 are calculated at the constant price of 1990, while the data after 2000 are calculated at
8) The data of regular institutions of higher education include the postgraduates.
9) The data of “per capita residential space of urban residents” was formerly “per capital residential space” before 2002.
10) Due to the change of names and statistic scopes of the indicators of public health in 2002, the indicators are not comparable with the data in previous years: since 2 (assistant) doctor was formerly “doctor” before 2002
(the same for the tables below).
2875.302848.822798.002839.002859.0099.4100.4102.2 848.211013.881265.951419.091474.92173.9145.5116.5 2027.091834.941532.051419.911384.0868.375.490.3 1479.061409.831435.641445.7597.7102.5
1369.761388.171403.361413.25103.2101.8
1719.431690.001611.571646.441668.8397.697.198.7103.6 294.63208.87209.66229.590.0 10.9510.1516.8913.0213.44128.4122.7132.479.6
1315.121791.003467.725793.666530.01457.2410.4290.0171.4 287.56284.87463.40575.40606.80159.6152.3142.0116.6 568.99760.031564.003057.783448.77647.4577.0390.4197.1 502.06633.981293.812607.152917.40661.4589.0407.2203.3 458.57746.101440.322160.482474.44449.2392.3256.9161.3
320.73655.812006.324045.255317.921962.51658.1810.9265.1 228.60531.381838.423781.564958.742169.2933.2269.7 172.98391.751320.692790.563719.832150.4949.5281.7 55.62139.63517.73991.001238.912227.5887.3239.3 92.13124.43167.90263.69359.18389.9288.7213.9 40.0659.5296.09181.27268.93671.3451.8279.9 52.0764.9158.2982.4290.24173.3139.0154.8
54.94104.46394.96963.341165.712533.62121.81115.9147.8 79.42202.46625.351448.561806.072727.42274.1892.1163.8
109.796.7100.8105.698.4
104.198.6103.0105.895.5
106.3105.6108.2112.295.0
106.195.598.7105.097.3
1330.441352.601366.911379.891379.94102.3103.7102.0101.0 424.99 412.63 662.19 871.39 913.11241.7214.9221.3137.9 271.38 244.74 358.30 465.47 522.84229.4192.7213.6145.9 11.55 10.82 19.97 29.34 34.14319.9295.5315.5170.9 131.17 141.99 249.50 344.15 319.42244.9243.5225.0128.0 10.89 15.08 23.80 21.15 24.27274.5222.9160.9102.0%)
Principal Aggregate and Growth Rate Indicators of Nationa
Social Development
1172.141131.211168.191153.211137.2098.697.0100.597.3 23.60 31.06 42.71 35.76 40.54161.4171.8130.594.9 13.24 10.41 9.02 8.55 9.99128.175.596.0110.8
1.55 1.45 1.65
2.17 2.26129.1145.8155.9137.0 56.6281.68154.6319
3.28212.87359.0376.0260.6137.7 133.22143.91178.39177.59187.72147.6140.9130.4105.2 11
4.18122.45144.46140.65146.52130.5128.3119.7100.0 14.0720.032
5.0619.0620.39168.1144.9101.881.4
730.41962.322525.875755.906772.90
199.72287.50716.361829.632189.39
711.34959.362515.175667.616624.71931.3690.5263.4 48.0485.57256.48601.71710.501479.0830.3277.0 63.7787.10139.40204.00204.40
96.5099.1098.7998.0098.30
1354631081775111561671594841177.4513.1205.8
1498.721149.901957.793702.864290.79286.3373.1219.2 26.1038.9857.0979.5075.70290.3194.2132.6 128.73167.90234.03396.64428.26332.7255.1183.0 117.55156.98294.70487.20477.44406.2304.1162.0
7.3613.9839.3679.7675.151021.1573.6190.9
26457.002090.00
648.761402.782100.693230.513610.99556.6257.4171.9 12.4124.5942.1576.64118.65951.6482.5281.5
1.34 4.8215.3340.7263.304723.91313.341
2.9 177.36191.07420.84774.90761.74429.5398.7181.0 28.5450.425
3.8768.0172.77255.014
4.313
5.1 453.91343.5039
6.08451.00476.00104.9138.6120.2
205.30348.66783.571496.321915.25932.9549.3244.4 56.4394.52171.61485.00506.01896.7535.3294.9
40656088107231561916476405.3270.6153.7 22773084515564857473328.2242.3145.0
423705696960436107191114598288.43270.47201.16189.6 9721442122424722603132.67267.79180.51212.7 374105317057600102680110150320.40294.44207.17191.2 3900224013881578122636.5931.4554.7588.4 881172244616191627.97702.99528.74276.2 2433926852392006365168491300.46281.40255.07174.7 1633181219232086218273.70133.59120.40113.4 2021423646333785458958532320.67289.56247.53175.4 24911392389669717771491.24311.98558.29199.5
1.20
2.40 2.88 5.19 6.12874.29510.00255.00212.5
107624485251789386121009.57800.34351.78164.0
15.9985.82210.15424.75489.844469.343063.41570.78233.1
66.50268.43688.91688.10627.731685.63943.95233.8591.1
9.00160.00943.401281.701440.9239804.4216010.22900.58152.7
0.0310.00128.66189.57203.80679333.332038.00158.4
498.63 719.951227.802147.102479.01 496.0 414.0 286.7 201.9 438.07 627.361052.921793.532048.96 469.1 393.6 274.8 194.6 54.45 84.16 163.57 307.0 381.27 672.6 542.0 350.7 233.1
15.85 17.85 42.93 95.21 77.09 543.3 486.4 431.9 179.6 9.92 7.90 17.72 37.99 34.29 600.5 345.7 434.1 193.5 5.94 9.95 25.21 57.22 42.80 505.3 720.5 430.2 169.8
4.42 3.45 7.04 28.57 41.92 680.5 948.4121
5.1 595.5 2.19 2.44 5.16 27.29 40.161059.61833.81645.9 778.3 34.11 43.04 205.90 842.841468.024303.73410.9 713.0
16.1826.6152.3987.19104.81733.4647.8393.9200.1 709013837264364497753721848.3757.7388.2203.2
846.431904.714727.728021.9510933.001615.61291.7574.0231.3 500.711085.362545.853988.964908.681222.7980.3452.3192.8 913.931881.293719.526190.728766.061160.5959.2466.0235.7 10.4122.6312.7317.56331.3168.777.6
12.8227.7173.10200.56244.701908.7883.1334.7
6.488.271
7.5945.6456.63873.9684.8321.9
940010449201842839829883317.6317.9286.0148.1 4505412523332105203544.845.249.387.2 695038176693997103111106544157.8153.3130.3113.3 117711119014114326119161117460100.099.898.7102.7
7.9913.2535.7948.5052.33712.9654.9394.9146.2
6.958.459.6911.3911.06176.4159.1130.9114.1 101.2714
7.79173.52190.79192.02196.5189.6129.9110.7 273.71276.13260.98224.3920
8.1478.976.075.47
9.8
256.19327.71
343442965943570596218844561901730.61328.3153.8127.8
130231119811320136771318586.6101.2117.7116.5 3480408261086356182.6155.7
48674547316032159862123.0109.4 78.9093.7095.9696.4296.46128.6122.3102.9100.5 86.3089.9092.4992.8892.89109.3107.6103.3100.4
3.08 3.05 3.13 2.95 2.9397.395.196.193.6
3.85 3.70 3.71 3.70 3.619
4.996.1100.097.3
26.4419.0218.3226.1230.01113.5157.8163.8
1.68
2.07 5.657.378.31494.6401.4147.1
8.0010.7222.1727.3427.41337.1342.6255.7123.6
24.4429.5832.9135.0335.73149.1143.3118.4108.6
145.49173.23345.82613.78716.14547.0492.2413.4207.1
50108020166302698530965686.9618.1386.1186.2
14367.5515748.67
5022.966176.3010243.9915708.7417191.10392.9342.3278.3167.8
1479.051892.442809.324126.214478.35324.8279.0218.0159.4
16563511803312247149861120.9905.0426.8186.6
2567225014631396140456.054.762.496.0
8754288619787808874697199113.0111.0109.7123.4
3073344940373213941741943134.6136.593.3112.4
6633965666646748195092689137.8139.7141.2143.3
8454870722827518743392321109.2130.5111.6
11198075257204679223084256569229.1340.9125.4
18572806709578999033486.4321.9127.3
26523299554759376335238.9192.0114.2
11041588797710504129601173.9816.1162.5
2424
7875
营业利润计算(以下各表同)。
学院校、卫生学校和计生站;执业(助理)医师2002年以前统计口径为“医生”(以下各表同)。
of natural growth.
ated at current price while the index is calculated at constant price.
ed profit before 2003 and upon the operation profit since 2003 (the same for the tables below).
gers is no
the tables below).
2008.
while the data after 2000 are calculated at the constant price of 2001 (the same for the tables below).
ble with the data in previous years: since 2002, the medical technical personnel and the number of beds have no longer included the data of medical universities, health schools and family plan se
100.7-0.4…103.9 4.5 4.397.5-3.5-2.9
100.7-1.0100.70.3101.4-0.2-0.9-0.2-6.60.1103.2
-0.6
10.7
1.6
114.99.511.111.5105.5 2.4 4.0 3.3117.810.614.614.4117.210.214.914.6113.311.89.811.1131.519.3
25.124.1131.128.226.7133.327.526.6125.030.027.0136.2 6.211.0148.410.1
15.8109.5 5.7 2.0 3.7121.017.830.526.5124.7
25.0
25.3
27.2
100.0…0.20.4104.8 1.9 3.8 6.3112.3 1.3 2.6 5.7116.4-5.78.09.392.8 2.8 5.0 6.7114.8
11.4
5.7
5.4
2009为以下各年)
ational Economic and
Social Development
98.6-0.40.6-0.3 113.4 4.3 6.6 4.7 116.8 5.9-2.8-4.1 104.1-3.7 2.6 3.5 110.1 6.613.611.0 105.7 2.5 4.4 2.2 104.2 1.8 3.4 1.6 107.010.6 4.6 2.0
115.221.318.7 118.519.516.9 116.921.318.7 118.124.623.0
102.120.120.9
115.911.28.4 95.27.98.5 108.0 6.99.7 98.013.411.4 94.223.019.6
7.9
111.88.414.1 154.811.419.0 155.526.034.5 98.317.111.9 107.0 1.37.5 105.5 2.90.4
128.017.618.7 104.312.718.4 105.512.011.4 115.210.89.6
106.917.5 1.28.0 105.28-6.0-3.27.9 107.289.1 1.68.7 77.72-7.7-9.1-8.5 134.2325.213.916.2 107.60 3.37.98.3 104.59-9.3 1.2 2.3 107.22 5.37.18.5 111.48-2.522.89.1 117.9227.9 3.713.4 109.1123.516.517.3
115.350.919.630.1
91.248.420.718.8 112.4113.342.647.8 107.566.797.1
115.511.611.013.1 114.211.310.712.6 124.213.914.016.1
81.0 4.719.212.9 90.3 6.717.510.0 74.8 3.320.416.4
146.7-10.915.318.9 147.2-8.416.225.1 174.236.833.6
120.213.214.515.5 119.416.913.816.9
136.323.019.921.8 123.122.018.619.2 141.620.014.619.0 137.933.7 4.1 122.021.425.5 124.116.318.1
105.2 2.114.126.0 96.7-1.9-10.8-14.7 103.3 3.9 2.88.9 98.60.3-0.80.0
107.912.522.045.6 97.1 6.1 2.89.7 100.68.6 3.313.7 92.80.9-1.1-5.3 127.9
73.462.3 3.867.7
96.4-6.00.20.2 104.1 3.2
99.2 2.4
100.00.5 4.1 100.00.6 1.5
99.30.30.5-0.4
97.6-1.00.1-0.5
114.9-0.7 2.6
112.822.237.7
100.37.619.910.1
102.0 4.7 2.2 3.1
116.7 5.814.813.0
114.79.915.715.0
109.6
109.47.110.69.9
108.58.38.28.4
122.421.318.018.5
100.6
109.5
106.4
113.1
105.6 2.60.7
115.022.8 6.6
114.414.812.9
106.7 6.9 6.9
123.426.820.9
100.0
96.2
。
no longer included the data of medical universities, health schools and family plan service stations; the indicator of licensed