J. Geogr. Sci. 2013, 23(6): 1091-1106
DOI: 10.1007/s11442-013-1065-z
? 2013 Science Press Springer-Verlag
Soil erosion and its response to the changes of precipitation and vegetation cover on the Loess Plateau
SUN Wenyi1,2, *SHAO Quanqin1, LIU Jiyuan1
1. Institute of Geographic Sciences and Natural Resources Research, CAS, Beijing 100101, China;
2. University of Chinese Academy of Sciences, Beijing 100049, China
Abstract: Soil erosion is a major threat to our terrestrial ecosystems and an important global environmental problem. The Loess Plateau in China is one of the regions that suffered more severe soil erosion and undergoing climate warming and drying in the past decades. The vegetation restoration named Grain-to-Green Program has now been operating for more than 10 years. It is necessary to assess the variation of soil erosion and the response of precipita-tion and vegetation restoration to soil erosion on the Loess Plateau. In the study, the Revised Universal Soil Loss Equation (RUSLE) was applied to evaluate annual soil loss caused by water erosion. The results showed as follows. The soil erosion on the Loess Plateau between 2000 and 2010 averaged for 15.2 t hm-2 a-1 and was characterized as light for the value less than 25 t hm-2 a-1. The severe soil erosion higher than 25 t hm-2 a-1 was mainly distributed in the gully and hilly regions in the central, southwestern, and some scattered areas of earth-rocky mountainous areas on the Loess Plateau. The soil erosion on the Loess Plateau showed a deceasing trend in recent decade and reduced more at rates more than 1 t hm-2 a-1 in the areas suffering severe soil loss. Benefited from the improved vegetation cover and ecological construction, the soil erosion on the Loess Plateau was significantly declined, es-pecially in the east of Yulin, most parts of Yan’an prefectures in Shaanxi Province, and the west of Luliang and Linfen prefectures in Shanxi Province in the hilly and gully regions. The variation of vegetation cover responding to soil erosion in these areas showed the relatively higher contribution than the precipitation. However, most areas in Qingyang and Dingxi pre-fectures in Gansu Province and Guyuan in Ningxia Hui Autonomous Region were predomi-nantly related to precipitation.
Keywords: soil erosion; assessment; precipitation; vegetation cover; Loess Plateau
1 Introduction
Soil erosion is widespread and a major environmental threat to our terrestrial ecosystems Received: 2013-01-10 Accepted: 2013-04-02
Foundation: Ecological environment investigation and assessment in ten years in the zone of major ecological protection and construction, No.STSN-14-00; China Global Research Program, No.2010CB950902
Author: Sun Wenyi, Ph.D, specialized in GIS and ecological information. E-mail: sunwy@https://www.doczj.com/doc/002389872.html,
*Corresponding author: Shao Quanqin, Professor, E-mail: shaoqq@https://www.doczj.com/doc/002389872.html,
https://www.doczj.com/doc/002389872.html, https://www.doczj.com/doc/002389872.html,/content/1009-637X
1092 Journal of Geographical Sciences (Belyaev et al., 2005; Singer and Warkentin, 1996). The Chinese Loess Plateau is one of the most severely eroded regions in the world (Liu and Liu, 2010; Ritsema, 2003; Zheng et al., 2005). Severe soil erosion had not only led to the impoverishment of cultivated land causing poverty of local people, but also to desertification that destroys land conditions crucial for human survival.
The change of soil erosion was related to precipitation, soil properties, topography and land cover change. Among these factors, soil and topography, generally speaking, are rela-tively stable and change little. Therefore, the variation of soil erosion was mainly driven by the changes of precipitation and vegetation cover, which could retard or accelerate the proc-ess of soil erosion (Alatorre et al., 2012; Mohammad and Adam, 2010; Sharma et al., 2011; Zhu and Zhu, 2012). The precipitation is important for determining the severity of soil and water loss. Rainfall with low intensity mostly cannot produce severe soil erosion, even if experiencing high frequencies (Asselman et al., 2003). The variation of precipitation will also in?uence soil water content, which then in?uences the dynamics of vegetation devel-opment and succession under different land uses, and thus eventually decreases or acceler-ates erosion (Hou et al., 1996). Vegetation restoration can also improve the effectiveness of land cover and reduce susceptibility to soil erosion (Ritsema, 2003). The relationships be-tween precipitation, vegetation and erosion become uncertain and complex due to their in-teractions. To some extent, positive or negative correlation between precipitation and ero-sion mainly depends on the condition of vegetation cover (Wei et al., 2010; Xu, 2005). Sev-eral studies under different environmental conditions have demonstrated the positive effect of vegetation cover in reducing the water erosion (Mohammad and Adam, 2010; Nunes et al., 2011), and its negative effect for loss of vegetative cover as a result of human activities leading to increment of the risk of runoff and soil erosion (Asselman et al., 2003; Vásquez-Méndez et al., 2010).
In the last 50 years, the climate of Loess Plateau had an obvious tendency of warming and drying (Liu et al., 2006; Xin et al., 2008; Yao et al., 2005). There is a common sense that decreased rainfall would reduce the region's rainfall erosivity and eventually lower the soil loss. However, it may also theoretically lower the density of vegetation cover for lacking of enough water in the arid and semi-arid areas, causing the erosion increment. Since 1998, the Chinese government had launched the Grain-to-Green Program, which has been mainly di-rected to soil and water conservation on the Loess Plateau. Many infrastructure reforms and ecological projects were undertaken including construction of large reservoirs and silt dams, afforestation, and converting cropland on steep slopes to forest and grassland (Chen et al., 2010; Gao et al., 2010; Xin et al., 2008). Positive effects have been achieved through the recovery of the natural vegetation (Fu et al., 2011).
Some studies have revealed that the runoff and sediment from the Loess Plateau to the Yellow River had decreased significantly in recent decades, which was closely related to the soil erosion condition on the Loess Plateau (Kang et al., 2001; Wang et al., 2007). On the one hand, the decreased trend of runoff and sediment was attributed to the climate changes as the annual precipitation decreased slightly while the annual temperature and evaporation increased significantly (Wang et al., 2007; Zhang et al., 2008). On the other hand, more at-tention was paid to the vegetation restoration on the Loess Plateau since the implementation of the Grain-to-Green Program (Fu et al., 2011). Only a limited amount of research has been
SUN Wenyi et al .: Soil erosion and its response to the changes of precipitation and vegetation cover
1093
undertaken on the effects of climate change on soil erosion and how this might relate to hu-man modification of vegetation cover initiated by policies such as the Grain-to-Green Pro-gram. The program has now been operating for more than 10 years under the warming and drying climate. However, little knowledge about ecological effect of vegetation recovery on the soil erosion has been reported.
Therefore, in this study, we quantitatively assessed the impacts of vegetation cover and precipitation change on the soil erosion on the Loess Plateau. This assessment is required for scientific support for ongoing implementation and evaluation of ecological construction and environmental management programs.
2 Study area and methods
2.1 Description of study area
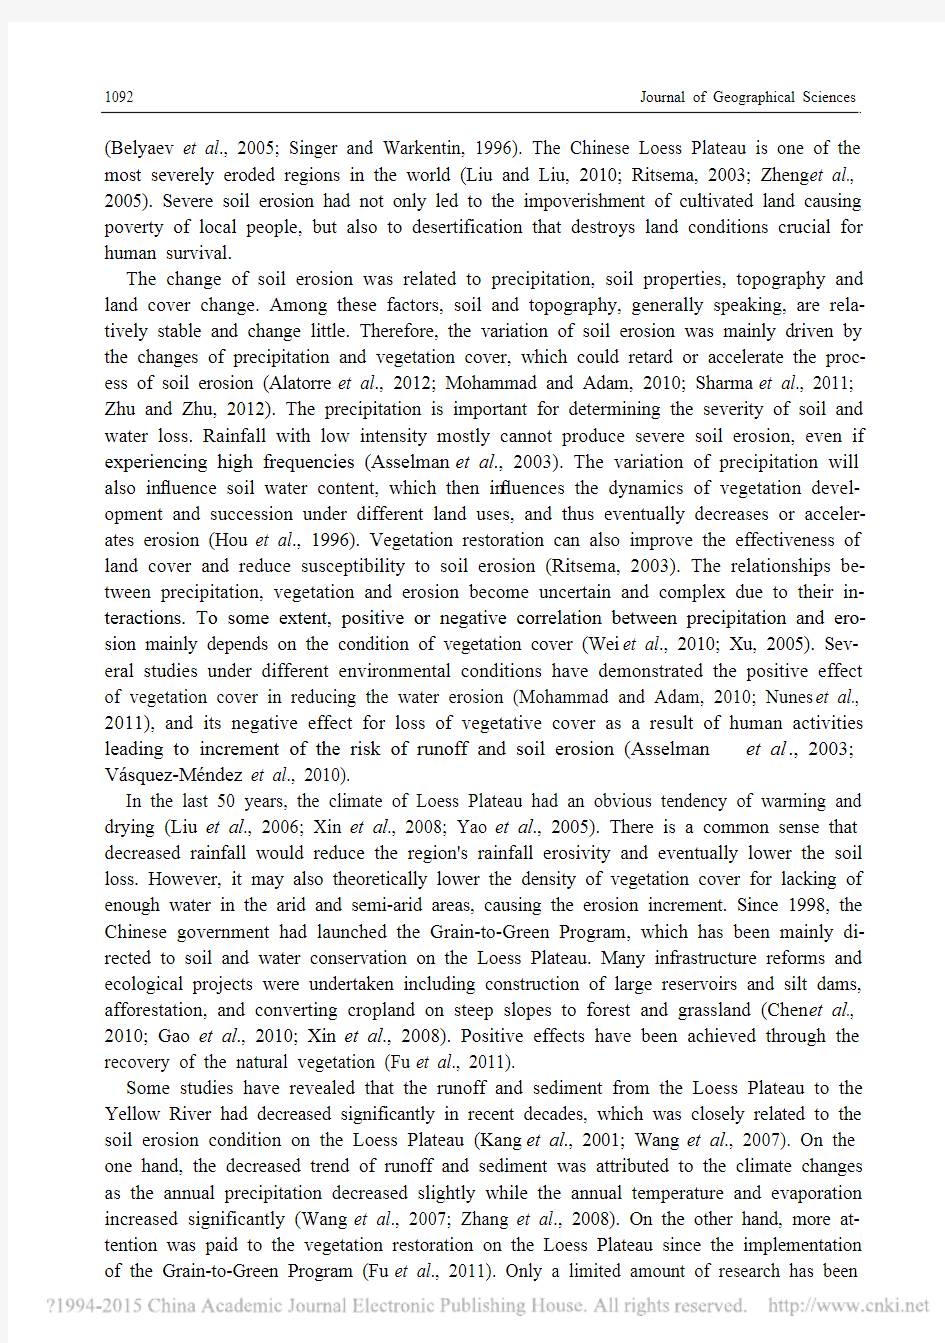
The Loess Plateau region (Figure 1), located in the upper and middle reaches of the Yellow River Basin, northwestern China, lies between longitudes 100°54′–114°33′E and latitudes 33°43′–41°16′N, covering an area of more than 620,000 km 2, 6.5% of the area of China. It extends to Yinshan Mountains in the north, Qinling Mountains in the south, Wuqiaol-ing-Riyue Mountains in the west and Taihang Mountains in the east. It has very complex topography, including sub-plateaus, basins, hills and gullies, with elevation ranging from 100 to 5000 m. Most of the Plateau has sub-humid and semi-arid climates with an average annual temperature of 4.3℃ in the northwest and 14.3℃ in the southeast (Li et al ., 2012). Average annual precipitation ranges from 150 mm in the northwest to 750 mm in the south-east and mostly falls as high intensity rainstorms between June and September (Li et al .,
Figure 1 Location of the Loess Plateau, China
1094
Journal of Geographical Sciences
2009). The Plateau surface is covered by highly erodible loess layers averaging 100 m deep and soil types in most parts are typical loess and clayey loess (Liu, 1964). Natural vegetation types vary from arid desert, to steppe and then to broad-leaved deciduous forest in the direc-tion from northwest to southeast (Yang and Yuan, 1991). The major crops are wheat, corn, millet, sorghum, soybean, and buckwheat.
The natural vegetation on the Loess Plateau has been largely destroyed by deforestation and cultivation. The combined effects of frequent heavy rainfalls during summer, steep to-pography, low vegetation cover and highly erodible loess soil have made the Loess Plateau the most severely eroded areas in the world. A large amount of the eroded soil was trans-ported into the Yellow River, carrying an annual sediment load of 16.4×10⁹ t (Zhang and Liu, 2005). The severe soil erosion has had a significant impact on the ecological security of the Yellow River and on the ecological environment of the Loess Plateau. The Chinese gov-ernment has made great efforts to control soil erosion, an ecological restoration program, designated “Grain to Green” was initiated on the Loess Plateau.
2.2 Method
2.2.1 Revised Universal Soil Loss Equation
The Revised Universal Soil Loss Equation (RUSLE) represents how climate, soil, topog-raphic slope and slope length as well as vegetation cover affect soil erosion caused by rain-fall impact and surface runoff (Renard et al ., 1997). It has been extensively used to estimate soil erosion loss and to assess erosion risk. It is the statistical relationship model established and can be developed better according to the local conditions of these factors. It can be used on the Loess Plateau where water erosion is the dominant cause of soil loss (Fu et al ., 2011). The RUSLE equation is:
A = R × K × L × S × C × P (1)
where A is the amount of the average soil loss (t hm -2 a -1); R the rainfall erosivity factor (MJ
mm hm -2 h -1 a -1); K the soil erodibility factor (t hm 2 h hm -2 MJ -1 mm -1); L the slope length factor; S the slope factor; C the vegetation cover factor and P the erosion control practice factor. Factors C and P are dimensionless.
Rainfall erosivity factor (R)
The rainfall erosivity index (R) in RUSLE model is an index of rainfall erosivity which is the potential ability of the rain to cause erosion. It is the driving force of erosion, and has direct relationships with soil erosion (Angulo-Martinez and Begueria, 2009; Renard et al ., 1997). In this study, the annual rainfall erosivity was calculated using the method of Zhang et al . (2002), a method based on aggradations of half-month rainfall erosivity using daily rainfall data that has been widely used in China (Cheng et al ., 2009; Men et al ., 2008; Zhang, 2003). The annual rainfall erosivity was estimated as follows:
1
()k
i j j M D βα==∑ (2)
where M i is the half-month rainfall erosivity (MJ mm hm -2 h -1 a -1) and D j is the effective rainfall for day j in one half-month. D j is equal to the actual rainfall if the actual rainfall is larger than the threshold value of 12 mm, which is the standard for China’s erosive rainfall. Otherwise, D j is equal to zero (Xie et al ., 2000). The term k is the number of days in the half-month. The terms α and β are the undetermined parameters:
SUN Wenyi et al .: Soil erosion and its response to the changes of precipitation and vegetation cover
1095
121218.17724.4550.8363d y P P β=++ (3) 7.189121.586αβ-= (4) where 12d P is the average daily rainfall that is more than 12 mm and 12y P is the yearly average rainfall for days with rainfall more than 12 mm.
Soil erodibility factor (K)
The soil erodibility represents both susceptibility of soil to erosion and the amount and rate of runoff, as measured under standard plot conditions (Parysow et al ., 2003). The K-factor is related to soil texture, organic matter content permeability, and other factors and is basically derived from the soil type (Wischmeier et al ., 1971). In this study the soil erodi-bility factor was determined using the EPIC equation (Williams et al ., 1984) as follows:
0.3
(1)0.20.3exp 0.0256SAN 100SIL SIL K CLA SIL ??-????=+?-?? ???+?????? 0.250.71.0 1.00.1317exp(3.72 2.95)exp( 5.5122.9)C SNI C C SNI SNI ????--? ???+-+-+????
(5) where SAN , SIL and CLA are the sand fraction (%), silt fraction (%), and clay fraction (%), respectively, C is the soil organic carbon content (%), and SNI is equal to 1-SAN/100. 0.1317 is the conversion factor from US customary units to SI units.
Topographic factor (LS)
The LS factor reflects the effect of slope length and the slope gradient on erosion (Lu et al ., 2004). A DEM-based procedure developed in USA (Hickey, 2000; Van Remortel et al ., 2001) was employed to resolve the difficulties for the estimation of the LS-factor on a re-gional scale. However, the LS factor algorithms was limited to slopes ≤18% because data used to develop RUSLE involved slopes up to 18% only (McCool et al ., 1989). Liu et al . (1994) fixed the formula using soil loss data from natural runoff plots ranging from 9% to 55% slopes and reported that soil loss was linearly related to the sine of the slope angle. Therefore, in this study the formula for L de ?ned and developed by McCool et al . (1987, 1997) and incorporation of the equations for slope gradient >18% formulated by Liu et al . (1994) was used:
22.13m L γ??= ??? 0.590.4930.3310.2
1m m m m θθθθ=??=>??=>??=?≥≥≥≥ (6) S = 10.8sin 0.03,9%16.8sin 0.05,
9%18%21.91sin 0.96,18%
θθθθθθ+?≤≤ (7) where γ is the slope length (m); m is a dimensionless constant depending on the percent slope (θ).
Vegetation cover factor (C)
Vegetation is the most sensitive factor influencing soil erosion and soil loss is
1096
Journal of Geographical Sciences
signi ?cantly related to vegetation coverage (Renard et al ., 1997) in a negative exponential relationship, whose turning point is about 78.3% (Wang and Liu, 1999). Cai et al . (2000) developed a method for C factor estimation using vegetation cover based on simulated and natural rainfall on experimental plots. The formula is expressed as:
100.65080.3436lg 078.3%078.3%f C f f f =??=-?
≤
(8) Vegetation coverage (f) was calculated using NDVI, which can better characterize vege-tation cover. ()()
soil max soil NDVI NDVI f NDVI NDVI -=- (9) where NDVI soil is NDVI value for pure bare soil pixel; NDVI max refers to NDVI value for regional pure vegetation pixel.
Erosion control practice factor (P)
The erosion control practice factor was considered the most difficult factor to determine and was the least reliable factor of the RUSLE input factors (Renard et al ., 1997). For this study, the erosion control practice factor (P) was roughly determined from the land use clas-sification map on the Loess Plateau (Liu et al ., 2005) (Table 1).
Table 1 Values of the erosion control practice factor ( P) based on the land use map of the Loess Plateau, China Cropland Land use
Woodland Grassland Flat Hills Mountains Steep slope( >25) Others P value
1 1 0.20 0.350.65 0.80 1
2.2.2 Trend analysis
The annual variation trends for soil erosion, vegetation cover and precipitation during the years from 2000 to 2010 were calculated by the slope equation described below. The slope equation was estimated by fitting linear functions using ordinary least-squares regression. It indicated the strong or weak, positive or negative trends for the variables. The boundaries were defined from a 95% confidence interval for the slope. The slope is expressed as: 1112211n n n i i i i i n n i i n i var i var Slope n i i =====??-=???-??
∑∑∑∑∑ (10)
where i is the number of years; n is the total number of years; var is the variable of time-series trend. 2.2.3 Multiple linear regression analysis
Multiple linear regressions were applied for examining the relationship of a collection of independent variables (or predictors) for precipitation and vegetation cover to a single de-pendent variable (or criterion) for soil erosion between 2000 and 2010 on the Loess Plateau. The dependent variable for soil erosion and both of independent variables for precipitation and vegetation cover in 2000–2010 were normalized between 0 and 1 using the min-max normalization algorithm before entering into the regression model. A robust regression using
SUN Wenyi et al.:Soil erosion and its response to the changes of precipitation and vegetation cover1097 iteratively reweighted least-squares model (Holland and Welsch, 1977) based on the pixel scales was applied to detect the significances and contribution rates of precipitation and vegetation cover corresponding to the changes of soil erosion. The procedures were per-formed using the robust-fit function of matlab 7.10.0 software.
2.3 Datasets
Daily rainfall data provided by the National Meteorological Information Centre of China (https://www.doczj.com/doc/002389872.html,/) from 133 meteorological stations, 72 were on the Loess Plateau and the remaining 61 were located adjacent to the Plateau, were used to analyze the annual rain-fall erosivity on the Loess Plateau. Soil organic carbon and texture data were collected and calculated for soil erodibility factor, which were derived from the Second Soil Investigation in China (Wei et al., 2012). DEM Dataset with a resolution of 90 m developed from SRTM (Shuttle Radar Topography Mission) was computed to topographic factor in the study, which was available from the International Scientific and Technical Data Mirror Site, Computer Network Information Center, CAS. (https://www.doczj.com/doc/002389872.html,). The monthly 1 km NDVI (Normalized Differential Vegetation Index) MOD13A products between 2000 and 2010 were performed for vegetation cover factor and obtained from NASA EOS DATA Gateway (https://https://www.doczj.com/doc/002389872.html,/api).
3 Results and discussion
3.1 Spatial and temporal characteristics of soil erosion on the Loess Plateau
Water erosion is the dominant soil loss mode on the Loess Plateau (Tang, 2004). According to the Standard for Classification and Gradation of Soil Erosion SL190-2007 (Ministry of Water Resources of PR China, 2008), water erosion could be classified into six levels, i.e., slight (less than 10 t hm-2 a-1), light (10–25 t hm-2 a-1), moderate (25–50 t hm-2 a-1), severe (50–80 t hm-2 a-1), very severe (80–150 t hm-2 a-1) and extremely severe (more than 150 t hm-2 a-1). In this study, soil erosion on the Loess Plateau with an average of 15.2 t hm-2 a-1 was identified as light soil erosion, being less than 25 t hm-2a-1 between 2000 and 2010 (Figure 2). The soil erosion less than 25 t hm-2 a-1 accounted for 80.5% of the total area and was mainly distributed in irrigated regions, plain areas, sandy areas and earth-rocky moun-tainous areas. The more severe soil erosion higher than 25 t hm-2 a-1 was mainly distributed in gully and hilly regions in the central and southwestern parts, where the fragmented to-pography, well-developed gullies and steep slopes, and some scattered areas of earth-rocky mountainous areas were common characteristics of the Loess Plateau.
The annual change of soil erosion from 2000 to 2010 was shown in Figure 3. Soil loss for most parts of the Loess Plateau declined at a rate of about 1 t hm-2 a-1. Erosion reduced at rates between 1 and 3 t hm-2 a-1 was observed in the areas suffering more severe soil loss on the Loess Plateau. These areas included the east of Yulin, most of the area of Yan’an prefec-ture (the northern part of Shaanxi Province), the west of Luliang and Linfen prefectures (the central part of Shanxi Province), Zhongwei and Guyuan prefectures (the southern part of Ningxia), east of Lanzhou and most of Qingyang (Gansu Province), which were mostly gully and hilly regions in central and southwestern parts along the Yellow River and its
1098 Journal of Geographical Sciences
Figure 2The spatial distribution of soil erosion averaged between 2000 and 2010 on the Loess Plateau, China
Figure 3 The spatial distribution of annual changes of soil erosion between 2000 and 2010 on the Loess Plateau, China.
SUN Wenyi et al.:Soil erosion and its response to the changes of precipitation and vegetation cover1099
tributaries, and in some earth-rocky mountainous areas. Soil erosion decreased significantly at rates higher than 3 t hm-2 a-1 occurred in Yan’an, Qingyang, Luliang and Linfen prefec-tures, which were the key areas of soil and water conservation and ecological restoration. These results were very similar to that reported in other studies, the areas suffered heavy soil and water loss had now shrunk, and the soil erosion rate in these region had declined from 33.5 to 23.9 t hm-2 a-1 between 2000 and 2008, particularly on the sloping land where soil erosion mainly occurs (Wei et al., 2010; Fu et al., 2011). An indirect example was shown that the suspended sediment flux decreased 16% from the Yellow River (Dai et al., 2009). However, in our study the soil erosion increased at the rate up to 1 t hm-2 a-1 over the ten years in some areas, which were in the western part of Erdos (Inner Mongolia Autonomous Region), the surroundings of Taiyuan city (Shanxi Province), and the eastern parts of Xining, Hainan and Huangnan prefectures (the east of Qinghai Province).
3.2 Response of soil loss to the changes of precipitation and vegetation cover
Precipitation and vegetation cover are two direct and sensitive factors that affected the soil erosion (Hudson, 1995; Quan et al., 2011; Renard et al., 1997). The precipitation is a de-structive force to the land surface making the soil prone to splash erosion, and is important for determining the severity of soil and water loss. Vegetation cover has the positive effects on the land surface for protecting soil surface from erosion. The increment of vegetation can improve the effectiveness of land cover and reduce susceptibility to soil erosion (Ritsema, 2003). In the last 60 years, the climate of the Loess Plateau had an obvious trend of warming and drying (Liu et al., 2006; Xin et al., 2011). At the same time, lots of infrastructure and ecological reconstructions were carried out on the Loess Plateau, especially returning farm-land to forest and grassland (Fu et al., 2009; Gao et al., 2010). The soil erosion would be significantly changed due to the variation of precipitation and vegetation cover, especially in the zone of fragile ecosystem and semiarid climate on the Loess Plateau.
On the Loess Plateau, erosion rate change predominantly related to precipitation, rather than by erosion-resistance of vegetation, was shown in Qingyang Prefecture in Gansu and Guyuan Prefecture in Ningxia. In these prefectures soil erosion declined markedly as pre-cipitation decreased (Figure 4), but there was little increment of vegetation cover (Figure 5). However, evident erosion-resistance due to vegetation cover (Figure 5) was shown for re-gions along the Yellow River and its tributaries, particularly at slopes greater than 25°. These areas were located in the east of Yulin, most parts of Yan’an prefecture in Shaanxi, and the west of Luliang and Linfen prefectures in Shanxi in hilly and gully regions on the Loess Plateau. They were the key areas for soil and water conservation and ecological restoration undertaken by the National Grain-to-Green Program and a large area of steep slope cropland has been converted into grasslands and forests (Xin et al., 2008). The decrease of soil ero-sion in these areas was mainly driven by significant increments of vegetation cover, whereas precipitation increased relatively more in Yulin and Luliang prefectures and little change in Yan’an and Linfen prefectures (Figure 4).
3.3 The significant tests of precipitation and vegetation cover responding to soil erosion
Statistical P values were calculated to analyze the significant tests for soil erosion based on the variation of precipitation (Figure 6) and vegetation cover (Figure 7). The P values
1100 Journal of Geographical Sciences
Figure 4 The variation of precipitation between 2000 and 2010 on the Loess Plateau, China
Figure 5 The variation of vegetation coverage between 2000 and 2010 on the Loess Plateau, China (the value of vegetation coverage ranging from 0 to 1)
SUN Wenyi et al .: Soil erosion and its response to the changes of precipitation and vegetation cover
1101
Figure 6 The significance analysis of precipitation on soil erosion in 2000-2010
Figure 7 The significance analysis of vegetation on soil erosion in 2000-2010
1102 Journal of Geographical Sciences map was divided into three categories, significance at 0.05 and 0.01 levels and no signifi-cance (P>0.05). The significant areas (with P values less than 0.05) of precipitation corre-sponding to soil erosion mostly located in gully and hilly regions, irrigated regions and sandy areas. These areas included Yulin and Yan’an prefectures in Shaanxi, and Luliang and Linfen prefectures in Shanxi in the hilly and gully region, Zhongwei and Guyuan prefectures in Ningxia, Qingyang and Dingxi in Gansu in the gully region and agricultural irrigation areas, and Erdos in Inner Mongolia in sandy areas.
The significant areas of vegetation cover corresponding to soil erosion was much lower than that of precipitation, including the north of Yulin, central part of Yan’an in Shaanxi, Luliang and Linfen in Shanxi in the hilly and gully region, small part in Qingyang and Gu-yuan in the gully regions of the Loess Plateau. To some degree, vegetation cover is closely controlled by the distribution of annual precipitation, the larger vegetation cover resulted from higher annual precipitation in disturbed ecosystem, which resulted in higher ero-sion-resistance due to the increased vegetation cover (Nunes et al., 2011; Xu, 2005).
3.4 The contribution of precipitation and vegetation cover responding to soil erosion The variations of precipitation and vegetation cover had the significant impacts on the soil erosion on the Loess Plateau, as we mentioned above. However, the significant influences of precipitation and vegetation cover both existed in some areas. The contribution rates of pre-cipitation and vegetation cover to soil erosion may be inconsistent. Therefore, we take a further step to quantify the relative contributions of precipitation and vegetation cover to soil erosion on the Loess Plateau.
On the whole, the contribution rate of precipitation showed the positive trend with the variation of soil erosion (Figure 8), which indicated that precipitation decrease reduced the Plateau’s rainfall erosivity and eventually lowered soil loss. At the same time, vegetation cover increase also reduced the soil erosion due to its negative contribution rate (Figure 9), although the contribution rate of vegetation cover in most areas of the Loess Plateau was very low.
The areas affected remarkably by precipitation and vegetation cover mainly existed in hilly and gully region in the central and southwestern parts of the Loess Plateau. It was the region that suffered severe soil erosion and experienced the ecological restoration for Grain-to-Green Program. The contribution rate of precipitation in the hilly and gully region, such as Yulin, Yan’an in Shaanxi, and Luliang, Linfen in Shanxi, was mainly between 0.1 and 0.3 (Figure 8). The area in that region with contribution rate from 0.3 to 0.6 for precipi-tation was relatively small and scattered (Figure 8). However, the contribution rate of vege-tation cover in these areas was higher than precipitation, especially along the main stream of the Yellow River (Figure 9). The absolute values of contribution rate for vegetation cover in the hilly and gully region were mainly higher than 0.3, and the areas with contribution rate more than 0.6 performed obviously (Figure 9). Therefore, the change of soil erosion in these areas predominantly related to the increased vegetation cover.
However, the areas in the gully region of the Loess Plateau, including Qingyang and Dingxi in Gansu and Guyuan in Ningxia, were more predominantly related to precipitation than to vegetation cover. The contribution rate of precipitation in most of these areas was mainly between 0.3 and 0.6 (Figure 8), while the absolute value of that for vegetation cover
SUN Wenyi et al .: Soil erosion and its response to the changes of precipitation and vegetation cover
1103
Figure 8 The relative contribution of precipitation ro soil erosion in 2000-2010 (the values ranging from 0 to 1)
Figure 9 The relative contribution of vegetation to soil erosion in 2000-2010 (the values ranging from 0 to 1)
1104 Journal of Geographical Sciences was less than 0.3 except some areas in the east of Qingyang in Gansu (Figure 9).
4 Conclusions
In recent decades, the soil erosion on the Loess Plateau showed a decreasing trend due to climate warming and drying and vegetation restoration. Great efforts have been made to en-hance the vegetation restoration in the areas suffering from intense soil loss, which signifi-cantly reduced the soil erosion on the Loess Plateau.
(1) The average water erosion on the Loess Plateau between 2000 and 2010 was charac-terized as light. The more severe soil erosion with values more than 25 t hm-2 a-1 was mainly distributed in gully and hilly regions in the central, southwestern, and some earth-rocky mountainous areas. These areas suffering more severe soil loss on the Plateau reduced ero-sion at rates more than 1 t hm-2 a-1, even more in Yulin, Yan’an, Luliang, Linfen and Qin-gyang prefectures where the soil erosion decreased at rates more than 3 t hm-2 a-1.
(2) The contributions of precipitation and vegetation cover to the soil erosion on the Loess Plateau were assessed. Soil erosion intensity depended on both rainfall erosivity and erosion-resistance due to vegetation coverage. An increasingly abundant vegetation cover can better protect against soil erosion. Our results indicated that the soil erosion on the Loess Plateau was significantly declined for being benefited from the improved vegetation cover and ecological construction. These areas lied in the east of Yulin, most of the area of Yan’an prefecture in Shaanxi, and the west of Luliang and Linfen prefectures in Shanxi in the hilly and gully regions on the Loess Plateau and showed an evident erosion-resistance due to in-crease in the vegetation cover. The variation of vegetation cover responding to soil erosion showed the relatively higher contribution than the precipitation due to the soil and water conservation and ecological restoration. The achievement should be enhanced to ensure the sustainability of the Grain-to-Green Program in the Loess Plateau. However, some areas in Qingyang and Dingxi prefectures in Gansu and Guyuan in Ningxia were predominantly re-lated to decreased precipitation, rather than by erosion-resistance of vegetation cover. References
Alatorre L C, Begueria S, Lana-Renault N et al., 2012. Soil erosion and sediment delivery in a mountain catchment under scenarios of land use change using a spatially distributed numerical model. Hydrology and Earth System Sciences, 16(5): 1321–1334.
Angulo-Martinez M, Begueria S, 2009. Estimating rainfall erosivity from daily precipitation records: A comparison among methods using data from the Ebro Basin (NE Spain). Journal of Hydrology, 379(1): 111–121. Asselman N E M, Middelkoop H, van Dijk P M, 2003. The impact of changes in climate and land use on soil erosion, transport and deposition of suspended sediment in the River Rhine. Hydrological Processes, 17(16): 3225–3244.
Belyaev V R, Wallbrink P J, Golosov V N et al., 2005. A comparison of methods for evaluating soil redistribution in the severely eroded Stavropol region, southern European Russia. Geomorphology, 65(3): 173–193.
Cai C F, Ding S W, Shi Z H et al., 2000. Study of applying USLE and geographical information system IDRISI to predict soil erosion in small watershed. Journal of Soil and Water Conservation, 14(2): 19–24. (in Chinese) Chen L D, Wang J P, Wei W et al., 2010. Effects of landscape restoration on soil water storage and water use in the Loess Plateau Region, China. Forest Ecology and Management, 259(7): 1291–1298.
Cheng L L, Zhao W W, Zhang Y H et al., 2009. Effect of spatial distribution of rainfall erosivity on soil loss at catchment scale. Transactions of the Chinese Society of Agricultural Engineering , 25(12): 69–73.(in Chinese) Dai S B, Yang S L, Li M, 2009. The sharp decrease in suspended sediment supply from China’s rivers to the sea:
SUN Wenyi et al.:Soil erosion and its response to the changes of precipitation and vegetation cover1105 Anthropogenic and natural causes. Hydrological Sciences Journal, 54(1): 135–146.
Feng X, Wang Y, Chen L et al., 2010. Modeling soil erosion and its response to land-use change in hilly catchments of the Chinese Loess Plateau. Geomorphology, 118(3): 239–248.
Fu B J, Liu Y, Lü Y H et al., 2011. Assessing the soil erosion control service of ecosystems change in the Loess Plateau of China. Ecological Complexity, 8(4): 284–293.
Fu B J, Wang Y F, Lu Y H et al., 2009. The effects of land-use combinations on soil erosion: A case study in the Loess Plateau of China. Progress in Physical Geography, 33(6): 793–804.
Gao Q, Kang M, Xu H et al., 2010. Optimization of land use structure and spatial pattern for the semi-arid loess hilly-gully region in China. Catena, 81(3): 196–202.
Hickey R, 2000. Slope angle and slope length solutions for GIS. Cartography, 29(1): 1–8.
Holland P W, Welsch R E, 1977. Robust regression using iteratively reweighted least-squares. Comm unications in Statistics: Theory and Methods, 6(9): 813–827.
Hou X L, Bai G S, Cao Q Y, 1996. Study on benefits of soil and water conservation of forest and its mechanism in loess hilly region. Research of Soil and Water Conservation, 3(2): 98–103.(in Chinese)
Hudson N W, 1995. Soil Conservation. London: BT Batsford Limited.
Kang S, Zhang L, Song X et al., 2001. Runoff and sediment loss responses to rainfall and land use in two agricultural catchments on the Loess Plateau of China. Hydrological Processes, 15(6): 977–988.
Li Z, Liu W Z, Zhang X C et al., 2009. Impacts of land use change and climate variability on hydrology in an agricultural catchment on the Loess Plateau of China. Journal of Hydrology, 377(1): 35–42.
Li Z, Zheng F L, Liu W Z et al., 2012. Spatially downscaling GCMs outputs to project changes in extreme precipitation and temperature events on the Loess Plateau of China during the 21st century. Global and Planetary Change, 82-83: 65–73.
Liu B Y, Nearing M A, Risse L M, 1994. Slope gradient effects on soil loss for steep slopes. Transactions of the American Society of Agricultural Engineers, 37(6): 1835–1840.
Liu D S, 1964. Loess in the Middle Yellow River Drainage Basin. Beijing: Science Press. (in Chinese)
Liu J Y, Liu M L, Tian H Q et al., 2005. Spatial and temporal patterns of China’s cropland during 1990–2000: An analysis based on Landsat TM data. Remote Sensing of Environment, 98(4): 442–456.
Liu L, Liu X H, 2010. Sensitivity analysis of soil erosion in the northern Loess Plateau. Procedia Environmental Sciences, 2: 134–148.
Liu X Q, Zhao J B, Yu X F, 2006. Study on the climatic warming-drying trend in the Loess Plateau and the countermeasures. Arid Zone Research, 23(4): 627–631.
Lu D, Li G, Valladares G S et al., 2004. Mapping soil erosion risk in Rondonia, Brazilian Amazonia: Using RULSE, remote sensing and GIS. Land Degradation and Development, 15(5): 499–512.
McCool D K, Foster G R, Mutchler C K et al., 1989. Revised slope length factor for the universal soil loss equation. Transactions of the American Society of Agricultural Engineers, 32(5): 1571–1576.
Men M X, Yu Z R, Xu H, 2008. Study on the spatial pattern of rainfall erosivity based on geostatistics in Hebei Province, China. Frontiers of Agriculture in China, 2(3): 281–289. (in Chinese)
Ministry of Water Resources of PR China, 2008. Standard for Classification and Gradation of Soil Erosion SL 190–2007. Beijing: China Waterpower Press. (in Chinese)
Mohammad A G, Adam M A, 2010. The impact of vegetative cover type on runoff and soil erosion under different land uses. Catena, 81(2): 97–103.
Nunes A N, de Almeida A C, Coelho C O A, 2011. Impacts of land use and cover type on runoff and soil erosion in a marginal area of Portugal. Applied Geography, 31(2): 687–699.
Parysow P, Wang G X, Gertner G et al., 2003. Spatial uncertainty analysis for mapping soil erodibility based on joint sequential simulation. Catena, 53(1): 65–78.
Quan B, Romkens M J M, Li R et al., 2011. Effect of land use and land cover change on soil erosion and the spatio-temporal variation in Liupan Mountain Region, southern Ningxia, China. Frontiers of Environmental Science & Engineering in China, 5(4): 564–572.
Renard K G, Foster G R, Weesies G A et al., 1997. Predicting soil erosion by water: A guide to conservation planning with the revised universal soil loss equation (RUSLE). USDA. Agriculture Handbook, (Washington) no.703.
Ritsema C J, 2003. Introduction: Soil erosion and participatory land use planning on the Loess Plateau in China.
1106 Journal of Geographical Sciences Catena, 54(1): 1–5.
Sharma A, Tiwari K N, Bhadoria P B S, 2011. Effect of land use land cover change on soil erosion potential in an agricultural watershed. Environmental Monitoring and Assessment, 173(1–4): 789–801.
Singer M J, Warkentin B P, 1996. Soils in an environmental context: An American perspective. Catena, 27(3): 179–189.
Tang K L, 2004. Soil and Water Conservation in China. Beijing: Science Press. (in Chinese)
Vásquez-Méndez R, Ventura-Ramos E, Oleschko K et al., 2010. Soil erosion and runoff in different vegetation patches from semiarid Central Mexico. Catena, 80(3): 162–169.
Van Remortel R D, Hamilton M E, Hickey R J, 2001. Estimating the LS factor for RUSLE through iterative slope length processing of digital elevation data within Arclnfo grid. Cartography, 30(1): 27–35.
Wang G, Innes J, Yusheng Y et al., 2012. Extent of soil erosion and surface runoff associated with large-scale infrastructure development in Fujian Province, China. Catena, 89(1): 22–30.
Wang H, Yang Z, Saito Y et al., 2007. Stepwise decreases of the Huanghe (Yellow River) sediment load (1950–2005): Impacts of climate change and human activities. Global and Planetary Change, 57(3): 331–354. Wang H S, Liu G B, 1999. Analysis on vegetation structures and their control on soil erosion. Journal of Arid Land Resources and Environment, 13(2): 62–68. (in Chinese)
Wei S G, Dai Y J, Liu B Y et al., 2012. A soil particle-size distribution dataset for regional land and climate modelling in China. Geoderma, 171: 85–91.
Wei W, Chen L D., Fu B J et al., 2010. Water erosion response to rainfall and land use in different drought-level years in a loess hilly area of China. Catena, 81(1): 24–31.
Williams J R, Jones C A, Dyke P T, 1984. A modeling approach to determining the relationship between erosion and soil productivity. Transactions of the American Society of Agricultural Engineers, 27(1): 129–144. Wischmeier W H, Johnson C B, Cross B V, 1971. A soil erodibility nomograph for farmland and construction sites.
Journal of Soil and Water Conservation, 26(5): 189–193.
Xie Y, Liu B Y, Zhang W B, 2000. Study on standard of erosive rainfall. Journal of Soil and Water Conservation, 14(4): 6–11. (in Chinese)
Xin Z B, Xu J X, Zheng W, 2008. Spatiotemporal variations of vegetation cover on the Chinese Loess Plateau (1981–2006): Impacts of climate changes and human activities. Science in China Series D-Earth Sciences, 51(1): 67–78.
Xin Z B, Yu X X, Li Q Y et al., 2011. Spatiotemporal variation in rainfall erosivity on the Chinese Loess Plateau during the period 1956-2008. Regional Environmental Change, 11(1): 149–159.
Xu J X, 2005. Precipitation-vegetation coupling and its influence on erosion on the Loess Plateau, China. Catena, 64(1): 103–116.
Yang Q Y, Yuan B Y, 1991. Natural Environment of Loess Plateau and Its Evolution. Beijing: Science Press. (in Chinese)
Yao Y B, Wang Y R, Li Y H et al., 2005. Climate warming and drying and its environmental effects in the Loess Plateau. Resources Science, 27(5): 146–152. (in Chinese)
Zhang C, Xie G, Liu C et al., 2011. Assessment of soil erosion under woodlands using USLE in China. Frontiers of Earth Science, 5(2):150–161.
Zhang W B, 2003. Temporal and spatial distribution of rainfall erosivity in the econtone between agriculture and animal husbandry in northern China. Advances in Natural Science, 13(6): 651–654. (in Chinese)
Zhang W B, Xie Y, Liu B Y, 2002. Rainfall erosivity estimation using daily rainfall amounts. Scientia Geographica Sinica, 22(6): 705–711. (in Chinese)
Zhang X, Zhang L, Zhao J et al., 2008. Responses of streamflow to changes in climate and land use/cover in the Loess Plateau, China. Water Resources Research, 44(7): WR006711.
Zhang X C, Liu W Z, 2005. Simulating potential response of hydrology, soil erosion, and crop productivity to climate change in Changwu tableland region on the Loess Plateau of China. Agricultural and Forest Meteorology, 131(3): 127–142.
Zheng F, He X, Gao X et al., 2005. Effects of erosion patterns on nutrient loss following deforestation on the Loess Plateau of China. Agriculture, Ecosystems & Environment, 108(1): 85–97.
Zhu L Q, Zhu W B, 2012. Research on effects of land use/cover change on soil erosion. Advanced Materials Research, 433:1038–1043.
黄土高原是世界最大的黄土沉积区。位于中国中部偏北。北纬34°~40°,东经103°~114°。东西千余千米,南北700千米。包括太行山以西、青海省日月山以东,秦岭以北、长城以南广大地区。跨山西省、陕西省、甘肃省、青海省、宁夏回族自治区及河南省等省区,面积约40万平方千米。 按地形差别分陇中高原、陕北高原、山西高原和豫西山地等区。 平均海拔1000~1500米,除少数石质山地外,高原上覆盖着深厚的黄土层,黄土厚度在50~80米之间。最厚达150~180米。年均气温6~14℃,年均降水量200~700毫米。从东南向西北,气候依次为暖温带半湿润气候、半干旱气候和干旱气候。植被依次出现森林草原、草原和风沙草原。土壤依次为褐土、垆土、黄绵土和 黄土高原 灰钙土。山地土壤和植被地带性分布也十分明显。气候较干旱,降水集中,植被稀疏,水土流失严重。黄土高原矿产丰富,煤、石油、铝土储量大。黄土颗粒细,土质松软,富含可溶性矿物质养分,利于耕作,盆地和河谷农垦历史悠久。黄土高原是中国古代文化的摇篮。近年来科学家发现许多现象是黄土风成学说无法解释的。譬如,黄土中粗粉沙含量由西北向东南递减,黏土的含量却从西北向东南递增,这种自西北向东南的有规律的排列呈叠瓦阶梯状的分布过渡,而不是平面模糊过渡。这种叠瓦阶梯状的分布过渡更像是洪水的杰作等等。为了解黄土高原的“变脸”过程,专家们特意到黄土高原西部甘肃静宁县、秦安县、定西县等地采集黄土高原6个典型地质剖面的黄土标本,从中获得了700余块孢粉样本和209块表土孢粉样本,这近千份孢粉样本大约记录了公元前4.6万年至今黄土高原植被变迁过程。通过对碳14的测量,在6个典型剖面中共测得年代34个。经过分析,专家们发现,从黄土高原采集的20克样品中最多分离出孢粉颗粒达到1112粒左右,最少的则不足50粒,显示着4万多年来,环境和植被出现了巨大的变化过程。从孢粉的分析来看,发现了松、云杉、冷杉、铁杉、栎、菊科等数十种植物孢粉的记录,专家们认为黄土高原在最初的时候并不姓“黄”,在4.6万年的历史中,有一多半的时间,黄土高原是森林和草原的成分相互消长,在这段时间里,黄土高原经历过多次快速的“变脸”———历经过草原、森林草原、针叶林以及荒漠化草原和荒漠等多次转换。黄土高原的形成和青藏高原的隆升,加快了侵蚀和风化的速度,在高原周围的低洼地区堆积了大量卵石、沙子和更细的颗粒。每当大风骤起,在西部地区便形成飞沙走石、尘土弥漫的景象。 被卷起的沙和尘土依次沉降,颗粒细小的粉尘最后降落到黄土高原区域,形成了一条荒凉地带。 印度板块向北移动与亚欧板块碰撞之后,印度大陆的地壳插入亚洲大陆的地壳之下,并把后者顶托起来。从而喜马拉雅地区的浅海消失了,喜马拉雅山开始形成并渐升渐高,青藏高原也被印度板块的挤压作用隆升起来。 然而东西走向的喜马拉雅山挡住了印度洋暖湿气团的向北移动,久而久之,中国的西北部地区越来越干旱,渐渐形成了大面积的沙漠和戈壁。这里就是堆积起了黄土高原的那些沙尘的发源地。体积巨大的青藏高原正好耸立在北半球的西风带中,240万年以来,它的高度不断增长着。青藏高原的宽度约占西风带的三分之一,把西风带的近地面层分为南北两支。南支沿喜马拉雅山南侧向东流动,北支从青藏高原的东北边缘开始向东流动,这支高空气流常年存在于3500—7000米的高空,成为搬运沙尘的主要动力。与此同时,由于青藏高原隆起,东亚季风也被加强了,从西北吹向东南的冬季风与西风急流一起,在中国北方制造了一个黄土高原。基本概况 黄土高原(英文:Loess Plateau 亦作Huang-t'u Kao-yuan或Huangtu Gaoyuan) 世界最大的黄土高原。在中国中部偏北,包括太行山以西、秦岭以北、乌鞘岭以东、长城以南的广大地区。跨山西、陕西、甘肃、青海、宁夏及河南等省区,面积约40万平方公里,
黄土高原植被与水循环关系 摘要:为了改善水土保持效果,研究了黄土高原地区植被和水循环的相互关 系。以黄土高原51个小流域为研究区域,分析了归一化植被指数( NDVI)与降水和蒸散发的关系。结果表明: 在多年平均降水量越多的区域, 植被密度越大, 实际蒸散发量也越高。在降水越充沛的区域, NDVI 的变差系数较小, 植被的年际波动也较小。植被密度大的地区, 蒸发效率高, 但蒸发系数较低; 增加植被会增加地表水和地下径流的分配比例。提高土壤含水量是增加植被覆盖的途径之一。 关键词:黄土高原; 植被; 降水; 蒸散发; 归一化植被指数 黄土高原(英文:Loess Plateau 亦作Huang-t'u Kao-yuan或Huangtu Gaoyuan)是世界最大的黄土沉积区。位于中国中部偏北。北纬34°~40°,东经103°~114°。东西千余千米,南北700千米。包括太行山以西、青海省日月山以东,秦岭以北、长城以南广大地区。跨山西省、陕西省、甘肃省、青海省、宁夏回族自治区及河南省等省区,面积约40万平方千米,海拔1500到2000。除少数石质山地外,高原上覆盖深厚的黄土层,黄土厚度在50~80公尺之间,最厚达150~180。黄土高原的地理位置比较特殊,即处于从平原向山地高原过渡、从沿海向内陆过渡、从湿润向干旱过渡、从森林向草原过渡、从农业向牧业过渡的地区,各种自然要素相互交错,自然环境条件不够稳定,表现为地址地震灾害、水旱灾害和气象灾害,以及水土流失、土壤侵蚀等自然灾害比较频繁和严重。而人类的不合理开发利用,如滥垦、滥牧、过樵、过牧,都会引起自然环境的强烈反应,所以使得自然灾害发生地频度增多,据记载,1999年, 中国开始在黄土高原地区展开植树造林和水土保持工程。然而, 植树造林与水土保持实践需要考虑到植被覆盖与当地水量平衡之间的复杂关系。因此,探究中国黄土高原地区植被和水循环之间的相互作用, 为水土保持工作提供科学依据, 黄土高原特殊的地形和地貌使得当我们是当前急迫需要开展的研究课题。本文分析了黄土高原地区植被与降雨、蒸散发、径流成分等之间的关系; 研究目的在于预测干旱半干旱区在气候变化和人类活动影响下的流域生态水文响应, 并为黄土高原的水土保持提供科学依据。 1 研究区域及资料情况 选择黄土高原地区的51个小流域作为研究区域( 图1) 。研究区内85个站的长期气象观测数据来源于中国气象局, 包含逐日降水量、气温、日照时间、风速、相对湿度、辐射等。研究区域内51个子流域出口的月径流数据来源于水利部水文局( 图1)[ 3]。流域边界从1km的数字高程模型( DEM) 中提取。降水
八年级地理下册《黄土高原》教案-新人教 版
第八章认识跨省区域 第一节沟壑纵横的特殊地形区——黄土高原(第一课时) ※教学目标 知识目标 1.让学生了解黄土高原的地理位置,并对黄土高原的地理位置作出简要评价。 2.了解黄土高原上黄土物质的形成原因。 3.让学生理解黄土高原千沟万壑的地形地貌特征。 4.让学生认识黄土高原生态环境恶化、自然灾害频繁的自然和人为原因,并认识相应的环境保护与资源开发的办法与经验。 能力目标 1.通过阅读地图说明黄土高原的位置。描述黄土高原所跨的省级行政区,培养学生的读图、析图能力。 2.通过读图分析造成黄土高原水土流失严重的原因,并讨论由此导致的严重的后果。进一步培养训练学生的读图分析及归纳整理能力。 德育目标 通过本节内容学习,使学生认识到自然环境各要素之间相互作用、相互影响的复杂关系。从而培养学生正确的人地观和可持续发展观。 ※教学重点 1.黄土高原水土流失严重的原因。 2.黄土高原脆弱的生态环境及成因。 ※教学难点 黄土高原上黄土物质的形成原因。
※教学方法 导学法、谈话法、讲述法相结合。 ※教具准备 1.有关课本插图资料。 2.挂图——黄土高原的位置,中国水土流失分布图。 ※课时安排 二课时 第一课时 ※教学过程 [导入新课] 同学们:我国有960万 km2的陆地面积。幅员辽阔,各地的自然景观不同。黄土高原)看一看这是什么地形区,主要地貌有哪些?(黄土高原地貌有黄土塬、黄土峁、黄土梁)引出新课。 板书:沟壑纵横的特殊地形区——黄土高原 [讲授新课] 教师出示挂图——黄土高原的位置。首先让学生在图上找出太行山、乌鞘岭、秦岭、长城以及黄土高原所跨的省级行政区,。 板书:一、世界最大的黄土堆积区 黄土高原东起太行山、西至乌鞘岭、南至秦岭、北抵长城。跨越了山西省、陕西省、宁夏回族自治区、甘肃省。在这片广阔的区域内黄土的厚度一般超过
黄土高原土壤侵蚀与旱地农业国家重点实验室 2014年度实验室开放基金课题指南 一、实验室主要研究方向 土壤侵蚀和干旱是影响农业生产和环境的世界性问题,在我国黄土高原地区尤为突出。本实验室是以黄土高原侵蚀环境调控和提高旱地农业生产力为研究方向,以解决黄土高原水土流失和干旱问题为目标,主要研究土壤侵蚀过程及其机理、土壤侵蚀预测预报、侵蚀环境演变机制及其提高生产力途径,土壤侵蚀与旱地农业研究的新技术与新方法、侵蚀与干旱逆境下作物生理生态和土壤水分、养分循环机制及其调控,发展土壤侵蚀与旱地农业新领域及其交叉学科,为加速黄土高原水土保持、生态环境建设和农业持续发展及黄河治理服务。 二、基金资助范围 本实验室主要资助符合实验室研究方向,又具有创新意义的基础及应用基础研究课题。主要资助如下研究方向: 1.土壤侵蚀动力学过程及其机制、土壤侵蚀预测预报、侵蚀环境演变机制及其调控(简称:侵蚀) 包括土壤侵蚀过程动力学机制、土壤侵蚀预报模型、土壤侵蚀研究新技术与新方法,土壤侵蚀环境演变机制及其时空分布特征、侵蚀环境演变的驱动力、土壤侵蚀环境效应评价、土壤侵蚀与环境演变的预测预报等。 2.旱地农业生态系统中水分、养分迁移与调控及提高旱地农业生产力的机制(简称:旱农)包括农林草生态系统中水分、养分迁移机制与动力学模式,土壤水—肥—生产力相互关系及产量形成过程的机理与动态模拟,提高水分、养分利用效率的机制与途径,作物对干旱逆境的适应性及旱地作物增产的机制,农业节水的生理生态基础,黄土高原发展集雨农业的理论与途径等。 3.黄土高原土壤侵蚀环境演变及调控与旱地农业生产力的相互关系(简称:交叉) 包括侵蚀条件下土壤养分运移规律,植被—侵蚀—土壤互动作用,侵蚀条件下的土壤退化对旱地农业生产力和生态环境影响的定量评价,水土保持和生态建设对区域水环境的影响评价、旱地农业生产力改变对区域水文情势影响的机制与效应,旱区生态农业对调控土壤侵蚀环境的效应,旱地农业可持续发展的优化模式等。 4. 黄土高原植被建设环境效应及调控(简称:植被) 包括半干旱区退化林草植被生态系统水分循环与恢复模型,灌草立体配置的水文生态与水土保持耦合效应;确定自然和人为作用下的土壤水分恶化过程及机理,建立区域土壤干层预报模型,提出区域植被恢复与建设高效种植模式,以指导黄土高原生态环境恢复与重建。 三、基金资助方式 为了更加有效地管理实验室基金,充分发挥实验室基金在推动学科建设和人才培养方面的作用,实验室基金资助方式包括如下三种类型:
第一节 中国黄土高原水土流失的原因 [学习目标定位] 1.了解水土流失的概念和我国水土流失最严重的地区。 2.理解黄土高原水土流失现象出现的自然原因和人为原因。 一、区域可持续发展 1.内容:包括① 、② 和社会三个方面的可持续发展,③ 的可持续发展是区域可持续发展的基础。 2.环境的可持续发展需要解决的问题:环境污染、④ 等方面。 3.水土流失 (1)概念:在⑤ 等外营力和人为因素的综合作用下,水土资源和土地生产力遭受的破坏及损失,包括土地表层侵蚀及水的损失。 (2)分布:多分布在⑥ 、⑦ 和高原地带,其中以黄土高原地区最为严重。 二、黄土高原水土流失的原因 1.自然原因??? 地貌形态的不稳定与黄土⑧ 降水⑨ ,多暴雨 植被○ 10 2.人为原因??? ? ? 森林、草原被毁不合理? [思维活动] 1.人类社会之前和之后影响黄土高原水土流失的主导因素是否相同? 三、水土流失的危害 1.破坏? ,造成农业减产。 2.加剧? 发展,威胁? 安全。 3.造成? 恶化。 4.淤积? ,加剧洪涝灾情。 5.影响? 合理和有效利用。 [思维活动] 2.位于河南省的小浪底水库为什么每年都要进行调水调沙? 探究点 黄土高原水土流失的原因 [探究活动] 阅读材料,回答下列问题。 材料一 黄土高原东起太行山,西至乌鞘岭,南连秦岭,北抵长城,主要包括山西、陕西以及甘肃、青海、宁夏、河南等省部分地区,面积40万平方千米,为世界最大的黄土堆积区,黄土厚50~180米。黄土颗粒细,土质松软,含有丰富的矿物质养分,利于耕作,农垦历史悠久,是中国古代文明的摇篮。现在,黄土高原平坦耕地不到1/10,绝大部分耕地分布在10°~35°的斜坡上,地块狭小分散,地表支离破碎,沟壑纵横是黄土高原的基本特征。
位置:105°E~114°E ,34°N~长城(36°N、110°E穿过黄土高原中部)。 范围及面积:黄土高原位于太行山以西,乌峭岭以东,秦岭以北,长城以南。横跨青、甘、宁、内蒙古、陕、晋、豫七省区大部分或一部分,面积30多万平方千米。 地形:高原,海拔在1000米左右, 汾河谷地、渭河平原、晋陕峡谷 地势:黄土高原地势由西北向东南倾斜 地貌及原因:外力作用为主 风力搬运、堆积———黄土高原 流水侵蚀————千沟万壑、支离破碎 内力作用:断层:上升———华山;下沉———渭河平原、汾河谷地 河流及水文特征:河流多为外河流、流量小,汛期短,含沙量大,结冰期短。黄河(中游,河口~旧孟津)、汾河(山西)渭河(陕西) 气候:温带大陆性季风(气温:暖温带温度较高。降水:半干旱、半湿润地区雨季较短) 植被:温带落叶阔叶林,地面被厚层黄土覆盖,植被多为次生灌木、矮林、覆盖率低,许多地表裸露。 资源: ①矿产资源:煤矿:神府、大同、朔州、西山、阳泉 ②水能资源:(万家寨引水工程)三门峡、小浪底 ③旅游资源:平遥古城、五台山、华山、秦始皇陵兵马俑、云岗石窟、壶口瀑布 农业生产:优势:雨同期热、土壤肥沃、灌溉水源、光照充足,温差大 制约因素:水资源短缺,春旱严重,寒潮 主要粮食作物:高粱、谷子、冬小麦 主要经济作物:苹果、梨、桃、杏、柿子 工业生产:主要部门:有色金属工业、重工业、能源工业 主要城市:太原、大同、西安、兰州
①充分发挥资源能源优势,加快发展能源、原材料加工,使这里进一步成为中国能源基地。 ②更新设备,提高质量,适当限制能源耗费,优化产业结构,延长生产链。 自然灾害:气象灾害:旱涝、寒潮、沙尘暴地质灾害:地震、滑坡、泥石流 交通:陇海—兰新线、同蒲线、太焦—焦柳线 运煤线路:大秦线、神骅线、焦—兖—日线 生态环境问题:水土流失、土壤侵蚀、 国土整治——黄土高原水土流失的治理 形成原因: 自然原因: ①降水:变率大,集中在夏季,多暴雨 ②地形:从平原向山地过度,地形坡度大 ③植被:从森林向草原过度,植被覆盖率低; ④土壤:土质疏松 人为原因: ①毁林开荒; ②过度樵采; ③轮荒——不合理的耕作制度; ④开矿 整治方针:治理与开发相结合 基本措施:调整土地利用结构 ①农: 压缩农业用地,采用现代农业技术,提高土地生产率。 ②林:扩大林草栽种面积,营造防风固沙林、经济林、用材林,四旁绿化。 ③矿:土地复垦,存放表土。
黄土高地区主要土壤类型介绍 一.简介 黄土高原是中国四大高原之一,是中华民族古代文明的发祥地之一。黄土高原海拔800~3000米,是地球上分布最集中且面积最大的黄土区,总面积64万平方千米。高原横跨青、甘、宁、内蒙古、陕、晋、豫7省区大部或一部。高原地势由西北向东南倾斜。除许多石质山地外,高原大部分为厚层黄土覆盖,经流水长期强烈侵蚀,逐渐形成千沟万壑、地形支离破碎的特殊自然景观。地貌起伏,山地、丘陵、平原与宽阔谷地并存,四周为山系所环绕,如北部的阴山,南部的秦岭,东部的吕梁山、西部的六盘山。黄土高原面积广阔,土层深厚,地貌复杂,水土流失严重,世所罕见 平均海拔1000~1500米,除少数石质山地外,高原上覆盖着深厚的黄土层,黄土覆盖厚度大多在100米以上,最大厚度超过200米。年均气温6~14℃,年均降水量200~750毫米。从东南向西北,气候依次为暖温带半湿润气候、半干旱气候。植被依次出现森林草原、草原和风沙草原。土壤主要有黄绵土、褐土和黑垆土。 二.气候 黄土高原地区属(暖)温带(大陆性)季风气候,年降水量200~750毫米之间。冬春季受极地干冷气团影响,寒冷干燥多风沙;夏秋季受西太平洋副热带高压和印度洋低压影响,炎热多暴雨。多年平均降雨量为466毫米,总的趋势是从东南向西北递减,东南部600~800 毫米,中部400~600毫米,西北部200~300毫米。以200毫米和400毫米等年降雨量线为界,西北部为干旱、半干旱区,中部为半亚湿润区,东南部为半湿润区。 中部半亚湿润区 包括黄土高原大部分地区,主要位于陕北、晋北、陇东和陇西南部等地区,年均温4℃~12℃,年降雨量400~600毫米,干燥指数1.5~2.0,夏季风渐弱,蒸发量远大于降水量。该区的范围与暖温带落叶阔叶林草原带大体一致 东南部半湿润区 主要位于河南西部、陕西关中平原、甘肃东南部、山西南部,年均气温8~14℃,年降雨量600~800毫米,干燥指数1.0~1.5,夏季温暖,盛行东南风,雨热同季。该区的范围与暖温带落叶阔叶林带大体一致。 西北部干旱、半干旱区 主要位于长城沿线以北,陕西定边——宁夏同心、海原以西。年均温2℃~8℃,年降雨量100~300毫米,干燥指数2.0~6.0。气温年较差、月较差、日较差均增大,大陆性气候特征显著。风沙活动频繁,风蚀沙化作用剧烈。该区的范围与温带荒漠草原带大体一致。 黄土高原地区降雨年际变化大,丰水年的降水量为枯水年的3~4倍;年内分布不均,汛期(6~9月)降水量占年降水量的70%左右,且以暴雨形式为主。 黄土高原大部分属于暖温带、少许的中温带,属于温带季风气候区,光照、热量充足;夏季降水多.社会经济:劳动力数量多,有悠久的种植历史,劳动力经验丰富;
黄土高原 黄土高原是世界最大的黄土沉积区。位于中国中部偏北。北纬34°~40°,东经 103°~114°。东西千余 千米,南北700千 米。包括太行山以西、青 海省日月山以东,秦岭以 北、长城以南广大地区。 跨山西省、陕西省、甘肃 省、青海省、宁夏回族自 治区及河南省等省区,面 积约40万平方千米。 按地形差别分陇中高原、 陕北高原、山西高原和豫西山地等区。 目录 ??概述 ??来源 ??历史 ??水土流失 ??治理 [显示全部] 黄土高原-概述
海拔1000~1500米,除少数石质山地外,高原上覆盖着深厚的 黄土层,黄土厚度在50~80米之间。最厚达150~180米。年均气温 6~14℃,年均降水量200~700毫米。从东南向西北,气候依次为暖 温带半湿润气候、半干旱气候和干旱气候。植被依次出现森林草原、 草原和风沙草原。土壤依次为褐土、垆土、黄绵土和灰钙土。山地土 壤 分明显。黄土颗粒细, 土质松软,富含可溶性 矿物质养分,利于耕作, 盆地和河谷农垦历史悠 久。黄土高原是中国古 代文化的摇篮。 在中国北方,它东起太 行山,西至乌鞘岭,南 连秦岭,北抵长城,主要包括山西、陕西、以及甘肃、青海、宁夏、 河南等省部分地区,面积40万平方公里,为世界最大的黄土堆积区。 黄土厚50—180米,气候较干旱,降水集中,植被稀疏,水土流失严 重。黄土高原矿产丰富,煤、石油、铝土储量大。 科学在不断发展,近年来科学家发现许多现象是黄土风成学说无法解 释的。譬如,黄土中粗粉沙含量由西北向东南递减,黏土的含量却从 西北向东南递增,这种自西北向东南的有规律的排列呈叠瓦阶梯状的
第一节中国黄土高原水土流失的治理一.选择题 1.关于黄土高原地理位置的叙述,正确的是( ) A.位于黄河下游,由黄河冲积物组成 B.位于从湿润向干旱过渡地带,植被由森林向草原过渡 C.位于中温带,粮食作物以春小麦为主 D.位于大兴安岭、太行山以西,多为内流区 2.有关黄土高原水土流失的原因叙述正确的是( ) A.亚热带季风气候,使其降水强度大,多暴雨 B.位于环太平洋火山地震带上,高原地面破碎 C.由于气候干旱,早期的黄土高原植被覆盖率低 D.引发水土流失的原因,人为原因是最主要的 3.“轮荒”这种耕作方式引起的后果是( ) A.土壤肥力得以恢复 B.林草生长茂密 C.原有林草种源被破坏殆尽 D.水土流失得以抑制 读“我国某地农业建设模式示意图”,回答4~5题。 4.该模式最有可能位于( ) A.华北平原 B.南方低山丘陵区 C.内蒙古草原 D.黄土高原 5.该模式主要治理的环境问题( ) A.水土流失 B.土壤盐碱 C.森林减少 D.荒漠化读“我国某区域示意图”,完成6-8题 6.该区域在我国多种自然或人文地理要素分布中具有明显的( ) A.过渡型 B.多变性C.不确定性 D.单一性7.该区域严重的自然灾害有( ) ①水旱灾害②台风③寒潮④土壤侵蚀⑤火山爆发 A.①③④ B.①②③ C.①④⑤ D.③④⑤ 8.该区域生态系统十分脆弱,主要表现在( ) ①抵御自然灾害能力较低②水土流失严重③人地矛盾尖锐④环境遭到破坏后恢复困难 A.①② B.②③ C.②④ D.①④ 下图为“我国某区域图”,读图完成9~10题。 9.图中A地区农业发展中存在较明显的土壤盐碱 化问题,其产生的主要原因是( ) ①纬度较高,冻土发育,含盐水分不易下渗②气 候干旱,降水少,蒸发旺盛③农业耕种过程中,长期 采用大水漫灌的灌溉方式④地处河谷地区,水流平缓,对土壤侵蚀作用微弱 A.①② B.①③ C.②③ D.③④ 10.图中B处在汉朝时还是水草丰美的大草原,而 现在已变成一片沙漠,其人为原因是( ) A.气候由湿润向干旱转变的结果 B.植被由草原向荒漠退化的结果 C.农业由耕种向畜牧转变的结果 D.人类过度开垦和放牧对植被破坏的结果 11.有关黄土高原泥沙大量流入黄河的主要原因,叙述不正确的是 ( ) A.黄土高原有黄河的主要支流 B.黄土高原上植被破坏严重 C.黄土高原上的河流流量大 D.黄土高原的黄土土质疏松 在黄土高原的缓坡上修筑梯田是该区域综合治理 的一项措施。读下图,完成12~13题。 12.梯田田埂的水平延伸方向一般与( ) A.坡面倾斜方向一致 B.等高线基本平行 C.山谷走向基本一致 D.山脊走向基本平行 13.下列措施中不利于黄土高原地区水土保持的是( ) A.扩大林草种植面积 B.改善天然草场的植被 C.开展土地复垦工作 D.增加粮食作物种植面积 14.分析下表资料(资料来源于对黄土高原的研究)判断 下列说法,不正确的是( ) 植被覆盖率/% 径流减少率/% 侵蚀减少率/% 20 15 55~20 40 30 80~40 60 60~30 95~70 80 75~50 98~80 ≥9070 100~90 B.人为因素是导致黄土高原水土流失的主要原因 C.保持水土的根本措施在于植树种草 D.黄土高原的水土流失是无法治理的 二、综合题
黄土高原水土流失及其治理 摘要:黄土高原的水土流失是脆弱的生态系统与不合理的人类活动共同作用的结果,水土保持是该地区生态恢复和重建的基础,是经济和社会持续发展的必然要求。文章分析了黄土高原地区水土流失的基本现状,探讨了水土流失的影响因素,提出了黄土高原地区水土保持的建议。本文提倡采用节水型水土保持模式,加强淤地坝工程建设,防范基础设施建设过程中的水土流失。提高生态植被建设质量和效率,推进退耕还林、退人还植工程建设。只有以水资源保护为核心,发展“混林农业”,加快山区的梯田建设步伐,综合运用各种措施减轻或根除黄土高原的水土流失,才能实现经济效益、社会效益和生态效益的统一。 关键词:水土流失;退耕还林;梯田建设;黄土高原 黄土高原地区脆弱的自然生态系统叠加了不合理的人类活动,导致人与自然的关系处于尖锐的对立之中,成为世界上水土流失最为严重、最为集中的地区,严重制约当地社会经济发展。近年来,一些地区在水土流失的治理中取得了很大的成效,但水土流失仍然是黄土高原上很严峻的一个环境问题,需要我们的进一步努力。搞好水土保持是黄土高原恢复生态和社会经济建设的基础,关系到当地社会经济建设的成败,关系到全国社会经济和环境的可持续发展能否顺利进行。 1 黄土高原自然环境概况 黄土高原位于我国的中北部地区,其范围东起太行山,西到日月山,北起长城沿线,南抵秦岭,总面积为 6.15×10⁵km2,其中水土流失总面积为 4.54×10⁵km2,平均海拔800—1800m,地貌类型为山地,黄土丘陵和高原沟壑;气候属于东部季风区向西北干旱区过渡地带,大陆性季风气候显著,年降水量200—600mm,主要集中在6月,降水时空分布不均且强度大,日照充足,太阳辐射强,年辐射总量为4.60—6.30×10⁹J/m2[1] 。 2 黄土高原水土流失的基本现状 黄土高原区土壤侵蚀模数为0.5—2.6×10⁴t/km2·a,地面分割强烈,形成塬、梁、峁独特的高原景观。2006年黄土高原五省区因水蚀、风蚀造成的水土流失高达1.2×105 km2。严重的水土流失每年向黄河输入泥沙1.6×10⁹t,相当于损失N、P、K养分8.0×10⁶t,其中甘、陕两省每年输入黄河的泥沙量占总量的80%左右[1]。据统计,黄河每年从中游带来的泥沙约有4×10⁸t,淤积在下游河道里,河床每年抬高10cm,给下游防洪造
植被恢复(vegetation restoration)是指运用生态学原理,通过保护现有植被、封山育林或营造人工林、灌、草植被,修复或重建被毁坏或被破坏的森林和其他自然生态系统,恢复其生物多样性及其生态系统功能,其内涵包括以下三个方面:(1)从生态和社会需求出发,确定植被恢复希望达到的生态、社会、经济效益;(2)确定能够达到上述效益的植物群落的组成和结构;(3)通过对植物群落的物理、化学、生物乃至社会文化要素的控制,带动植被的恢复,达到生态系统的自我维持。因此,植被恢复可概括为恢复植被的合理的结构、高效的功能和和谐的关系。根据植被系统退化的程度和类型,植被恢复的途径包括自然恢复、人工促进的自然恢复和生态工程恢复 3 种模式。自然恢复是指不通过人工干扰,完全依靠植被生态系统本身的恢复能力使其向典型自然植被系统顺向演替的过程,封山育林、撂荒演替就是典型的自然恢复方式。虽然一般的退化生态系统停止人干扰后,经过一定时间,生态系统凭借自身的能力可恢复到退化前的自然植被系统,但其恢复速度慢,周期长,对自然条件要求较高,而且要严格控制人为活动的影响。人工促进的自然恢复主要是依靠自然力来恢复受损的植被系统,同时加以人工措施的辅助,例如改善土壤营养条件、改善种源、改变种间关系,使植被群落快速形成并促进其向自然植被系统的演替过渡。生态工程恢复是在生态学原理的基础上,通过人工途径模拟自然生态系统的结构和功能,重建人工优化的植被系统,我国退耕还林工程中的植被恢复与重建基本就是构建优化人工植被系统的过程。 国外植被恢复研究进展 美国是世界上最早的植被恢复研究与实践的国家之一,早在20世纪30年代就成功恢复了一片温带高草草原,其中,著名生态学家Leopold提出植被恢复只是生态恢复中的第一步,如何保持一个生态系统整体性和稳定性才是生态恢复的关键,并在1941年进一步提出土地健康(land health)的概念。此后,北美针对各自面临的环境问题,进行了植被恢复的实践探索,主要是集中在北方阔叶林、混交林等生态系统的恢复试验研究以及探讨采伐破坏及干扰后系统生态学过程的动态变化及其机制方面。在此期间,欧洲共同体国家,特别是中北欧各国从森林营养健康和物质循环角度对生态恢复开展了深入的研究,形成了独具特色的欧洲共同体森林退化和研究分享网络,并开展了大量的恢复试验研究。20世纪70年代,生态恢复研究取得了较大的进步,其中对温带陆地、淡水生态系统的退化与恢复关注较多。1985年,国际恢复生态学会成立,该组织先后开展了森林、草地、海岸带、矿地、流域、湿地等生态系统的恢复实践,并出版了一系列植被恢复实例专著。20世纪90年代以后,植被恢复与重建研究进入快速发展时期,学科的理论框架和方法初步形成,在理论构建和实践方面都有明显进展,相继召开了一系列相关的学术会议和活动,成立了一些生态恢复相关学术机构,涌现出大量有关植被恢复的学术论文和刊物。2000年在英国利物浦举行的第十二届恢复生态学国际大会,是首次在北美以外举行的以植被恢复为主题的国际性研讨大会,这标志着恢复生态学的研究重心由北美开始向世界拓展。2010年世界土地退化防治国际学术研讨会在中国西安召开,大会的目标是追求在更大空间尺度上有应用意义的水土保持和植被恢复理论与技术,建立协作关系并发挥其作用,从而成功实现退化土地的植被恢复与重建。 1.1. 2.2 国内植被恢复研究进展 我国是世界上生态系统退化最为严重的国家之一,同时也是对生态恢复研究较早的国家之一,自从上世纪50 年代开始,我国就对退化生态系统进行了长期定位观测试验和综合整治工作,开展了相关的植被恢复工作,其中,任海, 彭少麟等人提出了在一定的人工启动下退化生态系统的恢复可分三步走、恢复过程中植物多样性是动物和微生物多样性的根本、森林恢复过程中结构与功能不同步恢复等植恢复理论。从此以后,先后有多个单位开展了植被恢复与重建研究。80 年代以前的研究工作主要集中于植被资源调查和对其质与量的评价,对
《水土保持学》课程作业 题目:黄土高原地区土壤侵蚀的研究 系别:地球科学与资源系 专业班级: 12级土管五班 学号: 033120528 姓名:张楼 指导教师:王殿武 2013年 12 月 1日
目录 摘要---------------------------------------第2页 引言---------------------------------------第2页 正文 1、黄土高原地区土壤侵蚀的形式-------------------第3页 2、黄土高原地区土壤侵蚀的成因-------------------第5页 3、黄土高原地区土壤侵蚀的影响-------------------第7页 4、黄土高原地区土壤侵蚀的解决措施---------------第8页总结----------------------------------------第9页参考文献----------------------------------------第10页
黄土高原地区土壤侵蚀的研究 摘要: 黄土高原是我国重要的自然地理单元之一,既是生态过渡带,又是环境脆弱带。生态环境脆弱,水土流失和土壤侵蚀形势严峻。深刻认识黄土高原的土壤侵蚀发生的自然和人为原因及其危害,对于土壤侵蚀的防治具有极为重要的意义。自然和人为因素使得该区土壤侵蚀极为严重。本文通过探讨黄土高原土壤侵蚀的类型、分布、动因和危害,提出了黄土高原土壤侵蚀的防治对策,可以为该区水土保持和国土整治工作提供一定的参考。 关键词: 黄土高原;土壤侵蚀;防治。 。 引言: 土壤侵蚀遍布世界各地,严重影响了包括农业和森林在内的所有自然和人为生态系统,它所带来的影响是深刻而持久的,随着人口的不断增加和人类活动方式和范围的扩大,土壤侵蚀严重影响了自然生态系统。黄土高原处于黄河中上游,是我国西部开发尤其是西北开发的关键地域,区域上指的是太行山以西,日月山―贺兰山以东,秦岭以北,阴山以南的广阔区域,跨越陕西、甘肃、宁夏、山西、青海、内蒙古、河南7省区,自然地理条件复杂,地形破碎,图纸疏松,植被稀少且年降水量少而集中,该区是我国水土流失最为严重、生态环境最为脆弱的地区之一。
土壤侵蚀类型区的划分 2012-07-04 16:02 根据我国的地形特点和自然界某一外营力在一较大的区域里起主导作用的原则,水利水电部颁发了《关于土壤侵蚀类型区划分和强度分级标准的规定》,把全国区分为三大土壤侵蚀类型区。 (一) 水力侵蚀为主的类型区 这一类型区大体分布在我国大兴安岭—阴山—贺兰山—青藏高原东缘一线以东,包括西北黄土高原、东北的低山丘陵和漫岗丘陵、北方山地丘陵、南方山地丘陵、盆地及周围山地丘陵、云贵高原六个二级类型区。 1.西北黄土高原 这一高原区主要是指日月山以东,太行山以西,陕北长城以南,陕、甘岭以北的广区。绝大部分属黄河中游,是我国土壤侵蚀最严重的地区。 土壤条件:黄土在本区分布很广、厚度很大的第四纪粉沙物质。分为新黄土和老黄土两种。前者覆盖在后者之上,总厚度由几十米至100多米,最厚处达200多米。黄土质地匀细,组织疏松,具有大孔隙构造,垂直节理发育,湿陷性和渗透性都较大。颗粒粒径0.05-0.002mm的占50%,渗透速度一般在0.8-1.3mm/min。黄土具有迅速分散的特性,在清水中1—4 min即可全部分散。 地貌条件:按形态、结构分,除大部分为丘陵沟壑、高原沟壑,还有风沙丘陵、涧地、河谷川地和土石山地。总的来看,沟壑纵横,
地形破碎,沟深陡坡是黄土地貌的主要特征。 气候条件:属大陆型季风气候,冬寒夏热,气温变化剧烈,年平均降雨量在300—600mm,分布集中,7、8、9三个月,降雨量占全年的70%;多以暴雨形式出现,暴雨强度每分钟可达1mm,甚至2mm 以上,瞬时暴雨强度更大。一次大暴雨产沙量可占全年总产沙量的40%-86%。 植被条件:黄土高原自东南向西北大致可分为:山地森林、森林草原、草原和干旱草原四个带。山地植被带的植被以针、阔叶混交林和灌丛为主,开垦指数低,一般在10%以下,土壤侵蚀轻微;森林草原带植被类型以夏绿阔叶林及禾本科、菊科植物群落为主,开垦指数一般在40%-50%,部分人多地少地区高达60—70%,土壤侵蚀严重;干旱草原带的植被以藜科及旱生多刺的植物群落为主,开垦指数为10%—20%,土壤侵蚀严重,同时有较强烈的风蚀发生。 水土流失状况:除了溅蚀和层状面蚀普遍发生外,2度以上的坡耕地有细沟侵蚀发生;5度以上,则细沟侵蚀较强,并开始发生浅沟侵蚀。25度以上有切沟出现;35以上土壤泻溜;45度-75度陡坡地可发生滑坡;75度以上陡崖和岸壁可发生崩塌。年平均侵蚀模数一般为5000—10000t/km2,高的可达20000t/km2以上,黄河下游泥沙绝大部分来自于本区。 2.东北的低山丘陵和漫岗丘陵区 本类型区南界为省南部,西、北、东三面为大、小兴安岭和长白山所围绕。在该区域,除了大、小兴安岭林区以及三江平原外,其
黄土高原地区的可持续发展问题 理学部地理科学一班杜春林2013510034 摘要:通过对黄土高原地区生态经济系统的结构、功能、特点及生态环境恶化原因的分析,指出生态系统的脆弱性、经济系统结构的不合理性和人口的过快增长是该区生态破坏和贫穷落后的主要原因,也是该区实施可持续发展战略的主要障碍。因此,必须从改善区域生态环境的总目标出发,尤其是从防治黄河下游水患的需要出发,通过政策调控,将生态环境的恢复与重建放在首位,建立黄河流域的生态支持体系。在此基础上合理开发利用资源,促进经济、社会的全面发展是实现中国黄土高原区域可持续发展的惟一正确途径。 关键词:黄土高原地区;生态经济系统;生态恢复与重建;可持续发展 黄土高原地区地处34°N~45°5′N,101°E~114°33′E之间,南北分别以横贯东西的秦岭和阴山山脉作为天然屏障,西到日月山、贺兰山,东以太行山为界与华北平原相望。总面积62.38×10⁴km2,总人口约占全国的8%。黄土高原地区土地辽阔,光热充足,具有发展农林牧业的有利条件。该区还是我国矿产资源的宝库,尤其是能源矿产资源极为丰富,拥有我国和世界上罕见的大煤田和特大型天然气田,煤炭探明总储量占全国的2/3。按照中国国土开发整治的地域战略规划,黄土高原地区将建成我国最重要的、规模最大的能源重化工基地,在中华民族未来的发展中,它的战略地位将越来越重要。 然而,黄土高原又是我国水土流失最严重的地区之一,同时也是我国经济最贫困的地区之一。在这一巨大的区域生态经济系统中,生态系统与经济系统之间仍表现为强烈冲突的不协调状态,环境与发展之间的矛盾也未有效调和,不少地区生态破坏与经济贫困所形成的恶性循环仍在继续。所以,研究黄土高原地区实施可持续发展战略的途径与对策,对于该区社会经济的发展和生态环境的改善,以及全国实现可持续发展的伟大战略都具有重要意义。 1 自然生态系统的结构与功能特征 1.1 地表物质疏松易蚀地表物质疏松易蚀是黄土高原地区水土流失、生态退化的内因。黄土高原地区是世界上黄土覆盖最深、最广的地区,该区70%覆盖着第四纪黄土,其次为第三纪红粘土、基岩和其他地质时期的堆积物。黄土质地疏松,垂直节理发育,抗蚀性差,极易流失。加之地貌类型以黄土塬、梁、峁与其间的沟壑为主,地表破碎,相对高差较大,这种地表形态与岩性的组合为水土流失提供了有利的地形条件。 1.2 植被覆盖差黄土高原地区自然植被破坏严重。去除苗圃地、未成林地,全区森林覆盖率为12%;去除灌木林和疏林地,森林覆盖率仅为6.5%。现有草场面积中,中度和重度退化的占总面积的68.8%,草场的植被覆盖度为25%~65%。植被覆盖差,严重限制了植被在水土保持方面作用的发挥。 1.3 水资源贫乏,时空分布不均黄土高原地区是全国著名的缺水地区之一。这里水资源量少质差,人均水量和单位面积水量仅相当于全国平均水平的20%和10%,干旱灾害严重。同时,该区降水时空分布不均,多暴雨,这不仅加剧了少雨时期的干旱程度,而且为水土流失提供了动力条件。降水集中的时段每年在7~9月,也是该区水土流失最为强烈的时期。另外,暴雨还容易引起洪涝等灾害。 1.4 水土流失严重 在自然因素和人类不合理垦殖的综合作用下,黄土高原地区成为世界上水土流失最严重的地区之一。据统计,全区水土流失面积达 3.4×10⁵km2,其中土壤侵蚀强度大于1000t/km2 ·a的面积约为2.9×10⁵ km2 ,大于5000t/km2·a的面积约为1.66×105km2,有些地方甚至超过20000t/km2·a[1] 。严重的水土流失,导致了该区生态系统功能的严重退化,
Hans Journal of Agricultural Sciences 农业科学, 2017, 7(6), 412-420 Published Online September 2017 in Hans. https://www.doczj.com/doc/002389872.html,/journal/hjas https://https://www.doczj.com/doc/002389872.html,/10.12677/hjas.2017.76053 Study Advances of Soil Moisture Regime on the Loess Plateau Lu Zhang Key Laboratory of Degraded and Unused Land Consolidation Engineering, the Ministry of Land and Resources of China, Institute of Land Engineering & Technology, Shaanxi Land Construction Group, CO., LTD., Xi’an Shaanxi Received: Aug. 29th, 2017; accepted: Sep. 10th, 2017; published: Sep. 15th, 2017 Abstract There is arid climate and low rainfall in Loess Plateau, where the soil moisture has obvious space-time variable characteristics, and is prone to dry layer in the dry season and the crop grow-ing season, which affect plant growth and sustainable development of the local soil. This paper looked to solve the problem of local soil moisture imbalance, summarized the research progress of ecological conditions, space-time variability of soil moisture and soil dry layer, and proposed some control measures to improve soil moisture conditions in this area, and indicated the prob-lem which needed to be further resolved and future research development direction. Keywords Soil Moisture, Space-Time Variability, Soil Dry Layer 黄土高原土壤水分状况研究进展 张露 陕西省土地工程建设集团,陕西地建土地工程技术研究院,国土资源部退化及未利用土地整治工程重点实验室,陕西西安 收稿日期:2017年8月29日;录用日期:2017年9月10日;发布日期:2017年9月15日 摘要 黄土高原地区气候干旱,降雨量少,其土壤水分具有明显的时空变异特征,在干旱季节及作物生长旺季
黄土高原地区植被生态修复策略与对策 张文辉1 ,刘国彬 2 (1.西北农林科技大学西部环境与生态教育部重点实验室;2.中国科学院水利部水土保持研究所:712100,陕西杨凌) 摘要 根据近年来黄土高原地区实施植被生态修复的经验和黄土高原生态安全考察成果,论述植被生态修复的特点和功能,提出植被生态修复的核心内涵是将人为促进群落演替的人力与天然群落演替的自然力结合起来,实现区域生态系统整体恢复与局部快速恢复相结合的有效途径。黄土高原植被生态修复的目标是:区域内植物群落物种多样性平均增加10%~15%;地带性植被的代表种盖度在群落中占到20%~25%;植被总覆盖度75%~85%;水土流失强度有显著性减少。目前植被生态修复的关键问题是有关基础理论研究和技术措施积累不足,方法简单,效益不高。未来应采取正确生态修复思路,尽快解决生态修复中关键技术理论;科学规划,在典型地区黄龙森林区和安塞森林草原区建立示范点,实施综合的植被生态修复措施,建立法律保障体系,为黄土高原植被生态修复奠定基础。 关键词 生态修复;指导思想;目标;黄土高原 收稿日期:2008 11 24 修回日期:2009 04 01 项目名称:中国科学院西部行动计划课题 林草植被恢复与生态稳定性研究与示范 (KZC X2 XB2 05);国家 十一五 科技支 撑课题 植被优化配置与可持续建设技术 (2006BAD09B03);中国科学院百人计划项目(KZCX2 YW BR 02)第一作者简介:张文辉(1954!),教授,博士生导师。主要研究方向:植物生态、生物多样性保护与利用。E mail:zwhckh@163. com Countermeasures and strategy to vegetation rehabilitation in Loess Plateau,China Zhang Wenhui 1 ,Liu Guobin 2 (1.The Envi ronment and Ecol ogy Key Laboratory of of Educati on Mini stry in Wes t Chi na,Northwes t A &F University; 2.Soil and Water Cons ervation Ins titute of CAS and MWR:712100,Yangling,Shaanxi,Chi na) Abstract According to the experience of vegetation rehabilitation and the result of ecological safety investigation in the Loess Plateau,the func tions and characters of vegetation rehabilitation had been explained,and the core content of ve getation rehabilitation combining the artificial power for promoting vegetation restoration with the natural power of plant community succession is shown in order to achieve that all area vegeta tion rehabilitation combing with part area vegetation rehabilitation quickly.The aims for the vegetation rehabilitation in the Loess Plateau are that biodiversity increase 10%-15%on average.The coverage of typical species of the geography belt should acheive 20%-25%.The total vegetation coverage should acheive 75%-85%.The soil erosion decrease evidently.At present,the disadvantage for vegetation rehabilitation is no enough research accumulation for technology and the theory of vegetation rehabilitation and ecological efficiency of rehabilitation is not ideal.In the future the key techno-theoretic problems should be solved as quickly as possible by the sketch ideas.The typical demonstration area for vegetation rehabilitation should be set up for comprehensive measurements for rehabilitation.The law and regulation system for vegetation rehabilitation should be formed for the Loess Plateau. Key words ecological rehabilitation;leading ideas;aim;Loess Pla teau 2009年6月7(3):114 118中国水土保持科学 Science of Soil and Water Conservation Vol.7 No.3Jun.2009