生物化学胡萝卜素生物合成中英文对照外文翻译文献
- 格式:doc
- 大小:95.16 KB
- 文档页数:12
第 6 卷 第 6 期2020 年 12 月生物化工Biological Chemical EngineeringVol.6 No.6Dec. 2020类胡萝卜素的研究进展姜立,朱长甫,于婷婷,盛彦敏*(长春师范大学,吉林长春 130031)摘 要:类胡萝卜素是一类重要的天然色素的总称,对于人类的健康起着非常重要的作用,并且人和动物自身不能合成,需要从外界摄取。
类胡萝卜素的种类繁多,不同的类胡萝卜素具有不同的生理功能,其应用领域也非常广泛。
本文综述了近年来国内外学者对类胡萝卜素的研究进展,阐述了类胡萝卜素的由来、理化性质和分类、常见类胡萝卜素的分布和作用功效,对人们合理的选择和利用类胡萝卜素有重要意义。
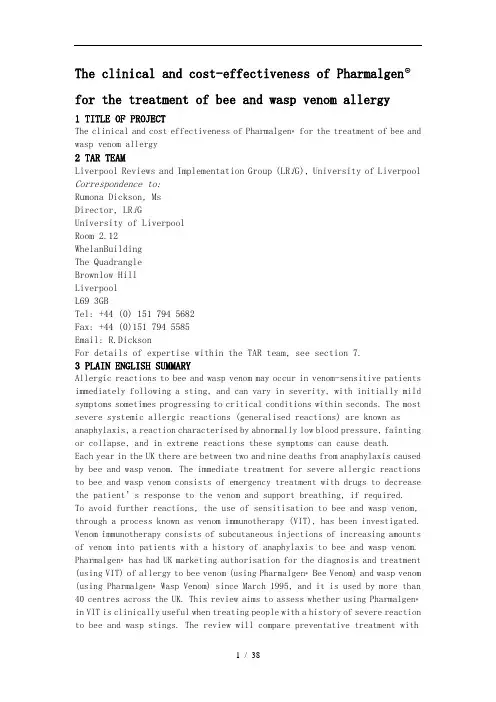
关键词:类胡萝卜素;天然色素;分类和分布;抗氧化性中图分类号:S852.2 文献标识码:AResearch Progress of CarotenoidsJIANG li, ZHU Changfu, YU Tingting, SHENG Yanmin*(Changchun normal university, Jilin Changchun 130031)Abstract: Carotenoids are a kind of important natural pigments, which play a very important role in human health. Moreover, human and animals can not synthesize carotenoids themselves and need to be absorbed from the outside world. There are many kinds of carotenoids. Different carotenoids have different physiological functions, and their application fields are also very extensive. This paper reviews the research progress of carotenoids in recent years. The origin, physicochemical properties and classification of carotenoids, the distribution and function of common carotenoids were described. It is important for people to choose and utilize carotenoids reasonably.Keywords: carotenoids; natural pigments; classification and distribution; antioxidant activity1831年,德国化学家Wachenreder从胡萝卜根中结晶分离得到一种碳水化合物类的色素并将其命名为“胡萝卜素(carotene)”[1]。

类胡萝卜素科技名词定义中文名称:类胡萝卜素英文名称:carotenoid 定义:链状或环状含有8个异戊间二烯单位、四萜烯类头尾连接而成的多异戊间二烯化合物。
是一类不溶于水的色素,存在于植物和有光合作用的细菌中,在光合作用过程中起辅助色素的作用。
应用学科:生物化学与分子生物学(一级学科);激素与维生素(二级学科)以上内容由全国科学技术名词审定委员会审定公布类胡萝卜素类胡萝卜素(carotenoid):不溶于水而溶于有机溶剂。
叶绿体中的类胡萝卜素含有两种色素,即胡萝卜素(carotene)和叶黄素(lutein),前者呈橙黄色,后者呈黄色。
功能为吸收和传递光能,保护叶绿素。
简介辅助色素(accessory pigment):在植物和光合细菌,像类胡萝卜素叶黄素和藻胆素中,吸收可见光的色素,这类色素是对叶绿素捕获光能的补充。
非皂化脂质。
是广泛地分布于动植物中的黄、橙、红或紫色的一组色素。
类胡萝卜素分子式构成发色原因的共轭二重键具有长链聚烯烃结构。
通常是几种混在一起生成。
具有C40的萜结构的较多,不含氮。
已知天然类胡萝卜素约有300种,其中不含氧的碳化氢类有胡萝卜素、菌脂素等;含氧的非常多,有醇、酮、醚、醛、环氧化物、羰酸和酯等。
它们之中大量存在的有岩藻黄质(fucoxanthin)、叶黄素(lutein)、堇菜黄质(violaxanthin)、新黄质(neoxanthin)等,均属于胡萝卜醇。
类胡萝卜素多数不溶于水,溶于脂溶剂,不稳定,易氧化。
类胡萝卜素(carotenoid):一类重要的天然色素的总称,属于化合物。
普遍存在于动物、高等植物、真菌、藻类和细菌中的黄色、橙红色或红色的色素,主要是β-胡萝卜素秋季黄叶中含类胡萝卜素和γ-胡萝卜素,因此而得名。
不溶于水,溶于脂肪和脂肪溶剂。
亦称脂色素。
自从19世纪初分离出胡萝卜素,至今已经发现近450种天然的类胡萝卜素;利用新的分离分析技术如薄层层析、高压液相层析以及质谱分析还不断发现新的类胡萝卜素。
The clinical and cost-effectiveness of Pharmalgen®for the treatment of bee and wasp venom allergy1 TITLE OF PROJECTThe clinical and cost effectiveness of Pharmalgen®for the treatment of bee and wasp venom allergy2 TAR TEAMLiverpool Reviews and Implementation Group (LR i G), University of Liverpool Correspondence to:Rumona Dickson, MsDirector, LR i GUniversity of LiverpoolRoom 2.12WhelanBuildingThe QuadrangleBrownlow HillLiverpoolL69 3GBTel: +44 (0) 151 794 5682Fax: +44 (0)151 794 5585Email: R.DicksonFor details of expertise within the TAR team, see section 7.3 PLAIN ENGLISH SUMMARYAllergic reactions to bee and wasp venom may occur in venom-sensitive patients immediately following a sting, and can vary in severity, with initially mild symptoms sometimes progressing to critical conditions within seconds. The most severe systemic allergic reactions (generalised reactions) are known as anaphylaxis, a reaction characterised by abnormally low blood pressure, fainting or collapse, and in extreme reactions these symptoms can cause death.Each year in the UK there are between two and nine deaths from anaphylaxis caused by bee and wasp venom. The immediate treatment for severe allergic reactions to bee and wasp venom consists of emergency treatment with drugs to decrease the patient’s response to the venom and support breathing, if required.To avoid further reactions, the use of sensitisation to bee and wasp venom, through a process known as venom immunotherapy (VIT), has been investigated. Venom immunotherapy consists of subcutaneous injections of increasing amounts of venom into patients with a history of anaphylaxis to bee and wasp venom. Pharmalgen®has had UK marketing authorisation for the diagnosis and treatment (using VIT) of allergy to bee venom (using Pharmalgen®Bee Venom) and wasp venom (using Pharmalgen®Wasp Venom) since March 1995, and it is used by more than 40 centres across the UK. This review aims to assess whether using Pharmalgen®in VIT is clinically useful when treating people with a history of severe reaction to bee and wasp stings. The review will compare preventative treatment withPharmalgen®to other treatment options, including high dose antihistamines, advice on the avoidance of bee and wasp stings and adrenaline auto-injector prescription and training. If suitable data are available, the review will also consider the cost effectiveness of using Pharmalgen®for VIT and other subgroups including children and people at high risk of future stings or severe allergic reactions to future stings.4 DECISION PROBLEM4.1 Clarification of research question and scopePharmalgen®is used for the diagnosis and treatment of immunoglobin E (IgE)-mediated allergy to bee and wasp venom. The aim of this report is to assess whether the use of Pharmalgen®is of clinical value when providing VIT to individuals with a history of severe reaction to bee and wasp venom and whether doing so would be considered cost effective compared with alternative treatment options available in the NHS.4.2 BackgroundBees and wasps form part of the order Hymenoptera (which also includes ants), and within this order the species that cause the most frequent allergic reactions are the Vespidae (wasps, yellow jackets and hornets), and the Apinae (honeybees).1Bee and wasp stings contain allergenic proteins. In wasps, these are predominantly phospholipase A1,2 hyaluronidase2 and antigen 5,3 and in bees are phospholipase A2 and hyaluronidase.4 Following an initial sting, a type 1 hypersensitivity reaction may occur in some individuals which produces the IgE antibody. This sensitises cells to the allergen, and any subsequent exposure to the allergen may cause the allergen to bind to the IgE molecules, which results in an allergic reaction.These allergens typically produce an intense, burning pain followed by erythema (redness) and a small area of oedema (swelling) at the site of the sting. The symptoms produced following a sting can be classified into non-allergic reactions, such as local reactions, and allergic reactions, such as extensive local reactions, anaphylactic systemic reactions and delayed systemic reactions.5-6 Systemic allergic reactions may occur in venom-sensitive patients immediately following a sting,7 and can vary in severity, with initially mild symptoms sometimes progressing to critical conditions within seconds.1The most severe systemic allergic reaction is known as anaphylaxis. Anaphylactic reactions are of rapid onset (typically up to 15 minutes post sting) and can manifest in different ways. Initial symptoms are usually cutaneous followed by hypotension, with light-headedness, fainting or collapse. Some people develop respiratory symptoms due to an asthma-like response or laryngeal oedema. In severe reactions, hypotension, circulatory disturbances, and breathing difficulty can progress to fatal cardio-respiratory arrest.Anaphylaxis occurs more commonly in males and in people under 20 years of ageand can be severe and potentially fatal.84.3 EpidemiologyIt is estimated that the prevalence of wasp and bee sting allergy is between 0.4% and 3.3%.9 The incidence of systemic reactions to wasp and bee venom is not reliably known, but estimates range from 0.15-3.3%,10-11 Systemic allergic reactions are reported by up to 3% of adults, and almost 1% of children have a medical history of severe sting reactions.9, 12 After a large local reaction, 5–15% of people will go on to develop a systemic reaction when next stung.13 In people with a mild systemic reaction, the risk of subsequent systemic reactions is thought to be about 18%.13 Hymenoptera venom are one of the three main causes of fatal anaphylaxis in the USA and UK.14-15 Insect stings are the second most frequent cause of anaphylaxis outside of medical settings.16 Between two and nine people in the UK die each year as a result of anaphylaxis due to reactions to wasp and bee stings.17 Once an individual has experienced an anaphylactic reaction, the risk of having a recurrent episode has been estimated to be between 60% and 79%.13In 2000, the register of fatal anaphylactic reactions in the UK from 1992 onwards was reported by Pumphrey to determine the frequency at which classic manifestations of fatal anaphylaxis are present.18 Of the 56 post-mortems carried out, 19 deaths were recorded as reactions to Hymenoptera venom (33.9%). A retrospective study in 2004 examined all deaths from anaphylaxis in the UK between 1992 and 2001, and estimated 22.19% to be reactions to Hymenoptera venom (47/212). This further breaks down into 29/212 (13.68%) as reactions to wasp stings, and 4/212 (1.89%) as reactions to bee stings. The remaining 14/212 were unidentified Hymenoptera stings (6.62%).194.4 Current diagnostic optionsCurrently, individuals can be tested to determine if they are at risk of systemic reactions to bee and wasp venom. The primary diagnostic method for systemic reactions to bee and/or wasp stings is venom skin testing.Skin testing involves intradermal injection with the five Hymenoptera venom protein extracts, with venom concentrati ons in the range of 0.001 to 1.0 μg/ml. This establishes the minimum concentration giving a positive result (a reaction occurring in the individual). As venom tests show unexplained variability over time,20 and as negative skin tests can occur following recent anaphylaxis, it is recommended that tests be repeated after 1 to 6 months.21Other methods of diagnosis in patients following an anaphylactic reaction include radioallergosorbent test (RAST), which detects allergen-specific IgE antibodies in serum. This test is less sensitive than skin testing but is useful when skin tests cannot be done, for example in patients with skin conditions.22-234.5 Current treatment optionsPreventative treatments include education on how to avoid bee and wasp venom,and prescription of high dose antihistamines. Patients with a history of moderate local reactions should be provided with an emergency kit,24 containing aH1-blocking antihistamine and a topical corticosteroid for immediate use following a sting. Patients with a history of anaphylaxis should be provided with an emergency kit containing a rapid-acting H1-blocking antihistamine, an oral corticosteroid and an auto-injector for self administration, containing epinephrine.Injected epinephrine (a sympathomimetic drug which acts on both alpha and beta receptors) is regarded as the emergency treatment of choice for cases of acute anaphylaxis as a result of Hymenoptera stings.25 For adults, the recommended dose is between 0.30 mg/ml and 0.50 mg/ml I.M, and 0.01 ml/kg I.M. for children. Individuals with a history of anaphylactic reactions are recommended to carry auto injectors containing epinephrine (commonly known as EpiPen®, Adrenaclick®, Anapen®or Twinject®). These are intended for immediate self-administration by individuals with a history of hypersensitivity to Hymenoptera stings and other allergens.Preventive measures following successful treatment of a systemic allergic reaction to Hymenoptera venom consists of either allergen avoidance or specific allergen immunotherapy, known as VIT. Venom immunotherapy is considered to be a safe and effective treatment.26 Currently, VIT can be used with several regimes, including Pharmalgen®(manufactured by ALK Abello, and licensed in the UK), Aquagen®and Alutard SQ®(both manufactured by ALK Abello and unlicensed in the UK but licensed in some parts of Europe), VENOMENHAL®(HAL Allergy, Leiden, Netherlands, unlicensed in the UK), Alyostal®(Stallergenes, Antony Cedex, France, unlicensed in the UK), and Venomil®(Hollister-Stier Laboratories LLC, unlicensed in the UK). Venom immunotherapy is recommended to prevent future systemic reactions. It is recommended that VIT is considered ‘when positive test results for specific IgE antibodies correlate with suspected triggers and pa tient exposure’.27 Venom immunotherapy consists of subcutaneous injections of increasing amounts of venom, and treatment is divided into two periods: the build up phase and maintenance phase. Venom immunotherapy is now the standard therapy for Hymenoptera sting allergy,28 and is a model for allergen-specific therapy,29-30 with success rates (patients who will remain anaphylaxis free) being reported as more than 98% in some studies.4, 31 There are now 44 centres across the UK which provide VIT to people for bee and wasp sting allergy. Venom immunotherapy is normally discontinued after 3 to 5 years, but modifications may be necessary when treating people with intense allergen exposure (such as beekeepers) or those with individual risk factors for severe reactions. There is no method of assessing which patients will be at risk of further anaphylactic reactions following administration of VIT and those who will remain anaphylaxis free in the long term following VIT.27Local or systemic adverse reactions may occur as a result of VIT. They normally develop within 30 minutes of the injection. Each patient is monitored closely following each injection to check for adverse reactions. Progression to anincreased dose only occurs if the previous dose is fully tolerated.4.6 The technologyPharmalgen®is produced by ALK Abello, and has had UK marketing authorisation for the diagnosis (using skin testing/intracutaneous testing) and treatment (using VIT) of IgE-mediated allergy to bee venom (Pharmalgen®Bee Venom) and wasp venom (Pharmalgen®Wasp Venom) since March 1995 (marketing authorisation number PL 10085/0004). The active ingredient is partially purified freeze dried Vespula spp. venom in Pharmalgen®Wasp Venom and freeze dried Apis mellifera venom in Pharmalgen®Bee Venom, each provided in powder form for solution for injection.Before treatment is considered, allergy to bee or wasp venom must be confirmed by case history and diagnosis. Treatment with Pharmalgen®Bee or Wasp Venom is performed by subcutaneous injections. The treatment is carried out in two phases: the initial phase and the maintenance phase.In the build up phase, the dose is increased stepwise until the maintenance dose (the maximum tolerable dose before an allergic reaction) is achieved. ALK Abello recommends the following dosage proposals: conventional, modified rush (clustered) and rush updosing. In conventional updosing, the patient receives one injection every 3-7 days. In modified rush (clustered) updosing, the patient receives 2-4 injections once a week. If necessary this interval may be extended up to two weeks. The 2-4 injections are given with an interval of 30 minutes. In rush updosing, while being hospitalised the patient receives injections with a 2-hour interval. A maximum of four injections per day may be given in the initial phase.The build up phase ends when the individual maintenance dose has been attained and the interval between the injections is increased to 2, 3 and 4 weeks. This is called the maintenance phase, and the maintenance dose is then given every 4 weeks for at least 3 years.Contra-indications to VIT treatment are immunological diseases (e. g. immune complex diseases and immune deficiencies); chronic heart/lung diseases; treatment with β-blockers; severe eczema. Side effects include superficial wheal and flare due to shallow injection; local swelling (which may be immediate or delayed up to 48 hours); mild general reactions such as urticaria, erythema, rhinitis or mild asthma; moderate or severe general reactions such as more severe asthma, angioedema or an anaphylactic reaction with hypotension and respiratory embarrassment; anaphylaxis (often starting with erythema and pruritus, followed by urticaria, angioedema, nasal or pharyngial congestion, wheezing, dyspnoea, nausea, hypotension, syncope, tachycardia or diarrhoea). 324.7 Objectives of the HTA projectThe aim of this review is to assess the clinical and cost effectiveness of Pharmalgen®in providing immunotherapy to individuals with a history of type 1 IgE-mediated systemic allergic reaction to bee and wasp venom. The review willconsider the effectiveness of Pharmalgen®when compared to alternative treatment options available in the NHS, including advice on the avoidance of bee and wasp stings, high dose antihistamines and adrenaline auto-injector prescription and training. The review will also examine the existing health economic evidence and identify the key economic issues related to the use of Pharmalgen®in UK clinical practice. If suitable data are available, an economic model will be developed and populated to evaluate if the use of Pharmalgen®for the treatment of bee and wasp venom allergy, within its licensed indication, would be a cost effective use of NHS resources.5 METHODS FOR SYNTHESISING CLINICAL EFFECTIVENESS EVIDENCE5.1 Search strategyThe major electronic databases including Medline, Embase and The Cochrane Library will be searched for relevant published literature. Information on studies in progress, unpublished research or research reported in the grey literature will be sought by searching a range of relevant databases including National Research Register and Controlled Clinical Trials. A sample of the search strategy to be used for MEDLINE is presented inAppendix 1.Bibliographies of previous systematic reviews, retrieved articles and the submissions provided by manufacturers will be searched for further studies.A database of published and unpublished literature will be assembled from systematic searches of electronic sources, hand searching, contacting manufacturers and consultation with experts in the field. The database will be held in the Endnote X4 software package.Inclusion criteriaThe inclusion criteria specified in Table 1 will be applied to all studies after screening. The inclusion criteria were selected to reflect the criteria described in the final scope issued by NICE for the review. However, as there is likely to be a limited amount of RCT data, the inclusion criteria of study design may be expanded to include comparative studies and descriptive cohorts. The clinical and cost effectiveness of Pharmalgen®for the treatment of bee and wasp venom allergy Page 11 of 21Table 1: Inclusion criteria Intervention(s) Pharmalgen®for the treatment of bee and wasp venom allergy,Population(s) People with a history of type 1 IgE-mediatedsystemic allergic reactions to:wasp venom and/or bee venomComparators Alternative treatment options available inthe NHS, without venom immunotherapyincluding:advice on the avoidance of bee and wasp venom,high-dose antihistamines,adrenaline auto-injector prescription andtrainingStudy design Randomised controlled trialsSystematic reviewsOutcomes Outcome measures to be considered include:number and severity of type 1 IgE-mediatedsystemic allergic reactionsmortalityanxiety related to the possibility of futureallergic reactionsadverse effects of treatmenthealth-related quality of lifeOther considerations If the evidence allows, considerations willbe given to subgroups of people, according totheir:risk of future stings (as determined, forexample, by occupational exposure)risk of severe allergic reactions to futurestings (as determined by such factors asbaseline tryptase levels and co-morbidities)If the evidence allows, the appraisal willconsider separately people who have acontraindication to adrenaline.If the evidence allows, the appraisal willconsider children separately.Two reviewers will independently screen all titles and abstracts of papers identified in the initial search. Discrepancies will be resolved by consensus and where necessary a third reviewer will be consulted. Studies deemed to be relevant will be obtained and assessed for inclusion. Where studies do not meet the inclusion criteria they will be excluded.Data extraction strategyData relating to study design, findings and quality will be extracted by one reviewer and independently checked for accuracy by a second reviewer. Study details will be extracted using a standardised data extraction form. If time permits, attempts will be made to contact authors for missing data. Data from studies presented in multiple publications will be extracted and reported as a single study with all relevant other publications listed.Quality assessment strategyThe quality of the clinical-effectiveness studies will be assessed accordingto criteria based on the CRD’s guidance for undertaking reviews in healthcare.33-34 The quality of the individual clinical-effectiveness studies will be assessed by one reviewer, and independently checked for agreement by a second. Disagreements will be resolved through consensus and if necessary a third reviewer will be consulted.Methods of analysis/synthesisThe results of the data extraction and quality assessment for each study will be presented in structured tables and as a narrative summary. The possible effects of study quality on the effectiveness data and review findings will be discussed. All summary statistics will be extracted for each outcome and where possible, data will be pooled using a standard meta-analysis.35 Heterogeneity between the studies will be assessed using the I2 test.34 Both fixed and random effects results will be presented as forest plots.6 METHODS FOR SYNTHESISING COST EFFECTIVENESS EVIDENCEThe economic section of the report will be presented in two parts. The first will include a standard review of relevant published economic evaluations. If appropriate and data are available, the second will include the development of an economic model. The model will be designed to estimate the cost effectiveness of Pharmalgen®for VIT in individuals with a history of anaphylaxis to bee and wasp venom. This section of the report will also consider budget impact and will take account of available information on current and anticipated patient numbers and service configuration for the treatment of this condition in the NHS.6.1 Systematic review of published economic literatureThe literature review of economic evidence will identify any relevant published cost-minimisation, cost-effectiveness, cost-utility and/or cost-benefit analyses. Economic evaluations/models included in the manufacturer submission(s) will be included in the review and critiqued as appropriate.Search strategyThe search strategies detailed in section 5 will be adapted accordingly to identify studies examining the cost effectiveness of using Pharmalgen®for VIT in patients with a history of allergic reactions to bee or wasp venom. Other searching activities, including electronic searching of online health economic journals and contacting experts in the field will also be undertaken. Full details of the search process will be presented in the final report. The search strategy will be designed to meet the primary objective of identifying economic evaluations for inclusion in the cost-effectiveness literature review. At the same time, the search strategy will be used to identify economic evaluations and other information sources which may include data that can be used to populate a de novo economic model where appropriate. Searching will be undertaken in MEDLINE and EMBASE as well as in the Cochrane Library, which includes the NHS Economic Evaluation Database (NHS EED).Inclusion and exclusionIn addition to the inclusion criteria outlined in Table 1, specific criteria required for the cost-effectiveness review are described in Table 2. In particular, only full economic evaluations that compare two or more options and consider both costs and consequences will be included in the review of published literature. Any economic evaluations/models included in the manufacturer submission(s) will be included as appropriate. Studies that do not meet all of the criteria will be excluded and their bibliographic details listed with reasons for exclusion.Table 2: Additional inclusion criteria (cost effectiveness) Study design Full economic evaluations that consider both costs and consequences (cost-effectiveness analysis,cost-utility analysis,cost-minimisation analysis and cost benefit analysis)Outcomes Incremental cost per life year gainedIncremental cost per quality adjustedlife year gainedData extraction strategyData relating to both study design and quality will be extracted by one reviewer and independently checked for accuracy by a second reviewer. Disagreement will be resolved through consensus and, if necessary, a third reviewer will be consulted. If time constraints allow, attempts will be made to contact authors for missing data. Data from multiple publications will be extracted and reported as a single study.Quality assessment strategyThe quality of the cost-effectiveness studies/models will be assessed according to a checklist updated from that developed by Drummond et al.36 This checklist will reflect the criteria for economic evaluation detailed in the methodological guidance developed by NICE.37 The quality of the individual cost-effectiveness studies/models will be assessed by one reviewer, and independently checked for agreement by a second. Disagreements will be resolved through consensus and, if necessary, a third reviewer will be consulted. The information will be tabulated and summarised within the text of the report.6.2 Methods of analysis/synthesisCost effectiveness review of published literatureIndividual study data and quality assessment will be summarised in structured tables and as a narrative description. Potential effects of study quality willbe discussed.To supplement findings from the economic literature review, additional cost and benefit information from other sources, including the manufacturer submission(s) to NICE, will be collated and presented as appropriate.Development of a de novo economic model by the AGa. Cost dataThe primary perspective for the analysis of cost information will be the NHS. Cost data will therefore focus on the marginal direct health service costs associated with the intervention.Quantities of resources used will be identified from consultation with experts, primary data from relevant sources and the reviewed literature. Where possible, unit cost data will be extracted from the literature or obtained from other relevant sources (drug price lists, NHS reference costs and Chartered Institute of Public Finance and Accounting cost databases).Where appropriate costs will be discounted at 3.5% per annum, the rate recommended in NICE guidance to manufacturers and sponsors of submissions. 37 b. Assessmentof benefitsA balance sheet will be constructed to list benefits and costs arising from alternative treatment options. LRiG anticipates that the main measures of benefit will be increased QALYs.Where appropriate, effectiveness and other measures of benefit will be discounted at 3.5%, the rate recommended in NICE guidance to manufacturers and sponsors of submissions. 37b. ModellingThe ability of LRiG to construct an economic model will depend on the data available. Where modelling is appropriate, a summary description of the model and a critical appraisal of key structures, assumptions, resources, data and sensitivity analysis (see Section d) will be presented. In addition, LRiG will provide an assessment of the model’s strengths and weaknesses and discuss the implications of using different assumptions in the model. Reasons for any major discrepancies between the results obtained from assessment group model and the manufacturer model(s) will be explored.The time horizon will be a patient’s lifetime in order to reflect the chronic nature of the disease.A formal combination of costs and benefits will also be performed, although the type of economic evaluation will only be chosen in light of the variations in outcome identified from the clinical- effectiveness review evidence.If data are available, the results will be presented as incremental cost per QALY ratios for each alternative considered. If sufficient data are not available to construct these measures with reasonable precision, incrementalcost-effectiveness analysis or cost-minimisation analysis will be undertaken. Any failure to meet the reference case will be clearly specified and justified, and the likely implications will, as far as possible, be quantified.d. Sensitivity analysisIf appropriate, sensitivity analysis will be applied to LRiG’s model in order to assess the robustness of the results to realistic variations in the levels of the underlying parameter values and key assumptions. Where the overall results are sensitive to a particular variable, the sensitivity analysis will explore the exact nature of the impact of variations.Imprecision inthe principal model cost-effectiveness results with respect to key parameter values will be assessed by use of techniques compatible with the modelling methodology deemed appropriate to the research question and to the potential impact on decision making for specific comparisons (e.g. multi-way sensitivity analysis, cost-effectiveness acceptability curves etc).7 HANDLING THE MANUFACTURER SUBMISSION(S)All data submitted by the drug manufacturers arriving before 22nd March 2011 and meeting the set inclusion criteria will be considered for inclusion in the review. Data arriving after this date will only be considered if time constraints allow. Any economic evaluations included in the manufacturer submission(s) will be assessed. This will include a detailed analysis of the appropriateness of the parametric and structural assumptions involved in any models in the submission and an assessment of how robust the models are to changes in key assumptions. Clarification on specific aspects of the model may be sought from the relevant manufacturer.Any 'commercial in confidence' data taken from a manufacturer submission will be clearly marked in the NICE report according to established NICE policy and removed from the subsequent submission to the HTA8 EXPERTISE IN THIS TAR TEAM AND COMPETING INTERESTS OF AUTHORSThis TAR team will be made up of the following individuals:Juliet HockenhullTeam lead /clinical systematicreviewerSenior economic modeller Professor Adrian BagustSystematic reviewer (clinical) Gemma CherrySystematic reviewer (economics) Dr Angela BolandEconomic modeller Dr Carlos Martin SaboridoInformation specialist Dr Yenal DundarMedical statistician James OyeeDirector Ms Rumona DicksonClinical advisor A team of clinical experts will beestablished to address clinicalquestions related to the technologyand to provide feedback on drafts ofthe final report9 REFERENCES1. Freeman T. Hypersensitivity to hymenoptera stings. NEJM. 2004;351:1978-84.。
生物学的基本概念和方法生物学是研究生命的科学,研究生物的结构、功能、繁殖、生物之间及其与周围非生命环境之间的相互影响。
我们能够确定生物学的几个基本概念。
1.生命是高度有序的。
在分子水平上,组成生命有机体的化学物质比构成大多数非生命系统的化学物质要复杂得多,而且更加高度有序。
反映在生物体有序的结构和功能的。
所有生物含有非常相似的化合物种类,而且构成生物机体的化合物与构成非生命环境的不同。
2.生物的基本单位是细胞。
大多数细胞如此的小,我们必须借助于显微镜才能看到。
诸如细菌、原生生物等许多小生物是由一个细胞组成的。
而禾本科植物和动物等较大的生物有多达数亿个细胞。
每个细胞里都有一些分离的、高度有序的生命物质组成的生化工厂。
细胞吸收养分和能量,并利用他们生存、生长、对环境的变化产生反应,最终繁殖,直至形成两个新的细胞。
因此,细胞是生物的结构、功能及繁殖单位。
3.生物利用从环境中获取能量来维持和提高有序性。
大多生物直接或间接地依赖于太阳的能量。
绿色植物利用太阳能制造养分,来满足植物自身的需要;植物随后被食用植物的动物所利用,最终又被吃这些动物的动物所利用。
所有的生物从他们的食物中获取能量,构建自身、生长、繁殖。
4.生物对环境作出积极反应。
大多动物通过采用某种行为,如探险、逃跑、甚至卷成球,对环境的变化作出迅速地反应。
植物的反应慢得多,但仍是主动(积极)的:茎和叶向光弯曲,根向下生长。
生物对环境刺激的反应是普遍的。
5.生物的发育。
万物都随着时间变化着,而生物的变化尤为复杂,称为发育。
非生命的晶体因添加了相同或相近的单位而增大,但植物或动物发育成新的结构,如叶片或牙齿,与长出他们的部位有着化学和结构的差异。
6.生物可自我繁殖。
新的生物——细菌、原生生物、动物、植物和真菌只能由其他相近生物繁殖而来的,新的细胞仅来源于其他细胞的分裂。
7.每个生物生存、发育和繁殖所需的信息在生物体内是分离的,并可传递给后代。
此信息包含在生物的遗传物质——染色体和基因中,从而限定了生物发育、结构、功能和对环境反应可能的范围。
REVISTA BOLIVIANA DE QUÍMICA VOLUMEN 25, No.1 - 2008DETERMINATION OF TOTAL PHENOLIC COMPOUNDSCONTENT AND THE ANTIOXIDANT CAPACITY OF ANDEAN TUBERS AND ROOTS (OCA, ULLUCO AND ARRACACHA)Trinidad G. Salluca abc, J. Mauricio Peñarrieta abc, J. Antonio Alvarado a* and Björn Bergenståhl ca Instituto de Investigaciones Químicas, Universidad Mayor de San Andrés, La Paz-Bolivia,b Biomedical Nutrition, LundUniversity, Lund-Sweden, c Food Technology, Lund University, Lund-SwedenKey Words: Andean tubers, oca, ulluco, roots of arracacha, Total Antioxidant Capacity, ABTS, FRAP,Total Phenolic Compounds.ABSTRACTFour species of Andean tubers, isaño (Tropaeolum tuberosum), oca (Oxalis tuberosa), ulluco (Ullucus tuberosus) and roots of arracacha (Arracacia xanthorrhiza), were studied for the quantification of the Total Antioxidant Capacity (TAC) and determination of Total Phenolic Compounds (TPH). The total antioxidant capacity was measured using ABTS and FRAP methods, and the total phenolics compounds were measured using the Folin & Ciocalteu reagent. The antioxidant capacity found in the tubers and root studied ranged from 0.35 to 11.8 μmol trolox equiv/g dry sample, and phenolics ranged from 0.002 to 0.02 μmol gallic acid equiv./g dry sample. In genera l black isaño tubers showed the highest values of antioxidant capacity and phenolic compounds compared with the other tubers.INTRODUCTIONThe interest in natural antioxidants has increased considerably in recent years because many antioxidants exhibit beneficial biological effects, including antibacterial, antiviral, antiallergic, antithrombotic and because they arelinked to lower incidence of cardiovascular disease and certain types of cancer disease [1]. The Andean habitantshave been using tubers and roots such as isaño, oca, ulluco and arracacha for their medicinal and nutritionalproperties since remote times. The diversity of tubers growing in the Andean region at altitudes between 2000 and4200 m above sea level shows a large variability in size, color, form, primary nutrient constituents and secondary metabolites [2, 3, 4]. Bolivia is well known for its ample diversity of genetic recourses of potential utility for the humanity. The traditions and the diversity of cultivation constitutes an important source of knowledge that must be systematized and utilized by means of different actions. Andean tubers have a big importance for the food supply and economy of the people living in the Andean region who eat isaño, oca, ulluco and arracacha both fresh and dry. The unfavorable climate at high altitudes only permits a limited number of cultivars. They are also used in folk medicine [5]. These mostly unproven medicinal properties could in part be attributed to the antioxidants present in these tubers. The objective of this study was to provide new data regarding Andean tubers and roots from Bolivia as asource of antioxidant compoundsRESULTS AND DISCUSSIONTotal Antioxidant Capacity of Andean tubersThe TAC values measured in the polar and non-polar extracts from seven samples by the ABTS and FRAP methodsare shown in Table 1and 2. The highest TAC value was observed in black isaño in the methanol extract.1esTScuthAPds meIntermediatte values were found in yellow isaño, yellow oca, arracach and dappled ulluco, and lowwer TAC value. were demonstrateed in pink oca and pink ulluuco. For black isaño higher TAC values were obtained in the polar fraactions (methanol and ethyl acetaate) than in the non-polar fractions (dichloroomethane and petroleum etheer) by the ABT and FRAP methhods. The TAC values of the calibration urves showed good reproducibbility (Figure 1,2) by both meethods. Data from FRAP displayyed a linear corrrelation with TPH data for the 28 extracts (r =0.96; Figuure 3). Similar linear correlations have also beeen observed in previous studie [6]. The TAC values obtainned for Andean tuber samples usingthe FRAP method were in most, but not in all cases, higgher than those obtained with the ABTS methhod. In black isaaño the highest valuues was found by the ABTS method in the methanol extract as well as in he total value of TAC.Figure 1: Calibration currve obtained by FRA method on diffeferent days for the measure of TAC xpressed as Trolox Equivalents/L (TE)Figure 2: Calibration currve obtained by ABBTS method on diffferent days for the measure of TAC xpressed as trolox equivalent s/L (TE)Figure 3:: Relation betweenn TAC-FRAP and TPH measuremennts in the 28 extraccts of 7 andean tubers.FRAP and ABTS method have been ussed for analysis of TAC in diffferent kinds of foods and som data on tubeers and roots are avvailable [7, 8]. Previous TAC values on tubeers were approxx. 0.27 – 3.03 µmol/g fresh ssample and 0.9 – 14.7 µmol/g dry sample using ABTS and 0.32 – 1.57 µmol/g fw and 1.0 - 7.6 µmol/g dw by FRAP.Total Phennolic Compounnds of Andeann tubers 2The content of Total Phenolic Compounds of the seven samples and twenty-eight extracts measured using the Folin& Ciocalteau method is shown in Table 3. The highest value was obtained in black isaño in both the methanol andethyl acetate extracts. In the present study the range of TPH determined in tuber pulp was 0.002-0.02 µmol GAE/gdm expressed as the sum of the polar and non polar fractions. The values of Total Phenolic Compounds of theextracts showed a good linear correlation (Figure 3) between TAC values obtained by FRAP (r =0.96) and by ABTS(r =0.78) methods.EXPERIMENTAL SECTIONChemicalsTrolox (6-hydroxy-2,5,7,8-tetramethyl-chroman-2-carboxylic acid, 97%.), TPTZ (2,4,6-tripyridyl-s-triazine), ABTS (2,2’-azinobis-3-ethyl benzotiazoline-6-sulphonic acid, 98%), potassium persulfate, sodium acetate, Folin-Ciocalteau reagent, gallic acid (98%) and sodium carbonate were purchased from Sigma-Aldrich (St. Louis, USA).The solvents used were: methanol, ethanol, dichloromethane, ethylacetate and petroleum ether.Plant materialSeven samples of andean tubers were purchased in the markets of La Paz, Bolivia in June 2006. The selected plants were ulluco (Ullucus tuberosus), arracacha (Arracacia xanthorrhiza), oca (Oxalis tuberosa) and isaño (Tropaeolum tuberosum). The seven varieties of samples were: two samples of oca (pink and yellow), two samples of Isaño (yellow with blach eyes and black), two samples of Ulluco (pink and dappled) and a sample of Arracha (yellow).Sample preparationThe collected tubers and root were washed and peeled and 800 g of fresh sample was dried at 30°C during 24 hours. The dry samples (only dry pulp) were ground and sequentially soaked with petroleum ether, dichloromethane, ethyl acetate and methanol during 24 hrs for each solvent. TAC and TPH were measured in the seventy-eight concentrated extracts.Measurement of TACTAC was assessed by using the ABTS [2,2’-azinobis (3-ethylbenzothiazoline-6-sulphonic acid)] method describedby Re et al. [9] and a modification of the FRAP (Ferric Reducing Antioxidant Power) method described by Benzie & Strain [10]. Both are spectrophotometric methods and the absorbance readings were performed on a double beamUV-Visible spectrophotometer Perkin Elmer model lambda 25 at 25°C. As a standard compound Trolox (6-hydroxy- 2,5,7,8–tetramethyl-chroman-2-carboxylic acid) was used, The stock solution contained 5 mmol/L of Trolox in ethanol, and was stored at 4°C.ABTS method. The ABTS method is based on the oxidation of ABTS to the green ABTS·+ radical cation after the addition of potassium persulphate (2.42 mmol/L) [11] for 12-16 hours at room temperature in the dark. On the day of analysis the ABTS·+ solution was diluted with acetate buffer pH 5.0 to an absorbance of 0.70 (±0.02) at 734 nm.After the addition of 1.0 of ABTS·+ solution to 100 µl of sample the mixture was stirred for 30 s and the absorbanceat 734 nm and 25°C was recorded for 6 min. The decrease in absorbance caused by the addition of sample was compared with that of a standard curve by use of Trolox (20-200 µmol/L).FRAP (ferric reducing/antioxidant power) method. The FRAP method was used for the determination of total antioxidant capacity, based on the reduction of yellow Fe3+-TPTZ complex to the blue Fe2+ -TPTZ complex by electron donating substance under acidic co ndition. The FRAP reagent (900 μl) containing TPTZ, FeCl3, and acetate buffer, was mixed with 90 μl of distilled water and 30 μl of the test sample or the blank (solvents used for extraction). Maximum absorbance values at 593 nm were recorded for 10 min at 25°C. The final absorbance was compared with the standard curve (100 –1000 μmol/L). The data were expressed as μmol trolox equivalents pergram of dry matter.Measurement of total phenolic compoundsThe phenolic compounds were determined using the Folin-Ciocalteu method, based on the reduction ofphosphor-wolframate-phosphomolybdate complex by phenolics to a blue reaction product [12, 13, 14]. TheFolin-Ciocalteu reagent, diluted 10 times (2.5 ml) was mixed with 2 ml of saturated sodium carbonate (75 g/L) and350 μl of sample (supernatant) and homogenized for 10 s and heated for 30 min at 45°C. The absorbance was measured at 765 nm after cooling at room temperature. The data were calculated by comparison between a standard curve (212-1062 μmol gallic acid /L) and the absorbance of each sample. The data were expressed as μmol gallic acid equivalents per gram of dry matter.Statistical Analysis.Results were expressed as mean values (standard deviation) of six replicates measured over three days of one extract. Linear correlation coefficient was calculated.ACKNOWLEDGEMENTSThe study was supported by the Swedish International Development Agency (SIDA/SAREC) in a collaborative project between Universidad Mayor de San Andrés (Bolivia) and Lund University (Sweden).REFERENCES[1] Nilsson J, Pillai D, Önning G, Persson C, Nilsson Å, Åkesson B. “Co mparison of the ABTS and FRAP methods to assess the total antioxidant capacity in extracts of fruit and vegetables.” Molecular Nutrition and Food Research, 2005, 49: 239-246[2] León, J. Botánica de los cultivos tropicales. Herbario Nacional de Bolivia, Bolivia 1997.[3] De Lucca, M. D.; Zalles, A. J. Flora Medicinal Boliviana Diccionario Enciclopédico. Los Amigos del Libro, Cochabamba - Bolivia 1992.[4] Vimos, C. N.; Nieto C.; Rivera M. El Melloco Características, técnicas de cultivo y potencial en Ecuador”. Centro Internacional de Investigación para el Desarrollo, CIID de Canadá. 1997.http://archive.idrc.ca/library/document/096951/index_s.html[5] Cárdenas M. Manual de Plantas Económicas de Bolivia, Segunda Edición, Los amigos del libro.La Paz - Cochabamba - Bolivia 1989.[6] Peñarrieta, M.; Alvarado, J. A.; Ǻkesson, B.; Bergenståhl, B. “Total Antioxidant Capacity In Andean Food Species From Bolivia”. Revista Boliviana de Química 2005, 22, 89-93.[7] Campos, D.; Noratto, G.; Chirinos,R.; Arbizu, C.; Roca, W.; Cisneros, L. “Antioxidant capacity and secondary metabolites in four species of Andean tuber crops: native potato (Solanum sp.), mashua (Tropaeolum tuberosum Ruiz & Pav ´ on), Oca (Oxalis tuberosa Molina) and ulluco (Ullucus tuberosus Caldas)”. Journal of the Science of Food and Agriculture 2006, 86, 1481–1488.[8] Halvorsen, B. L.; Holte, K.; Myhrstad, M.C.W.; Barikmo, I.; et al. “A systematic screening of total antioxidantsin dietary plants”. Journal of Nutrition 2002, 132, 461-471.[9] Re, R.; Pellegrini, N.; Proteggente, A.; Pannala, A.; Yang, M.; Rice-Evans, C. “Antioxidant activity applying an improved ABTS radical cation decolorization assay”. Free radical Biology & Medicine 1999, 26, 1231-1237. [10] Benzie, I.; Strain, J. J. “The Ferric Reduci ng Ability of Plasma (FRAP) as a Measure of Antioxidant Power: The FRAP Assay”. Analitycal Biochemestry 1996, 239, 70-76.[11] Scalzo, J.; Politi, A.; Pellegrini, N.; Mezzetti B.; Battino, M.“Plant genotype affects total antioxidant capacity and phenolic c ontents in fruit”. Nutrition 2005, 21, 207–213.[12] Kyoung, Ch. O.; Kim, D.; Smith, N.; Schroeder, D.; Taek, H. J.; Yong, L. Ch. “Daily consumption of phenolics and total antioxidant capacity from fruit and vegetables in the American diet”. Journal of the Science of Food and Agriculture 2005, 85, 1715–1724.[13] Bonoli, M.; Verardo, V.; Marconi, E.; Fiorenza, C. M. “Antioxidant Phenols in Barley (Hordeum vulgare L.) Flour: Comparative Spectrophotometric Study among Extraction Methods of Free and Bound Phen olic Compounds”. Journal of the Science Food Chemistry 2004, 84 5195- 5200.[14] Singleton, V.L.; Rossi, J. A. Jr. “Colorimetry of total phenolics with phosphomolybdic-phosphotungtic acid reagent”. American journal of Enology and Viticulture, 1965, 16, 144-158.4总酚类化合物含量测定以及南美洲根筋类植物的抗氧化能力Trinidad G. Salluca abc, J. Mauricio Peñarrieta abc, J. Antonio Alvarado a* and Björn Bergenståhl cInstituto de Investigaciones Químicas, Universidad Mayor de San Andrés, La Paz-Bolivia, b Biomedical Nutrition, LundUniversity, Lund-Sweden, c Food Technology,Lund University, Lund-Sweden关键词:南美洲根筋类植物,大洋洲,胡萝卜根部,总抗氧化能力,2,2′-连氮-二(3-乙基苯并噻唑啉-6-磺酸),三价铁降低抗氧化(剂)能力,总酚类化合物含量。
胡萝卜素代谢和生物学功能研究胡萝卜素是一类含有芳香结构的天然类黄酮化合物,它们的化学结构主要包括苯丙烷和吲哚环,具有强大的抗氧化作用,被广泛认为是预防代谢疾病和癌症的必要物质。
其中最常见的胡萝卜素是β-胡萝卜素和α-胡萝卜素,它们都属于维生素A家族,是动物生长和发育所必需的物质。
然而,人类无法自己合成这些物质,必须从膳食中获取。
胡萝卜素代谢和转化胡萝卜素被人体吸收后,需要经过一系列的生化反应才能够被有效利用。
首先,它们被油脂结合并进入腸道上皮细胞,然后由酯化酶水解出游离胡萝卜素。
在肝脏中,α-胡萝卜素和β-胡萝卜素被氧化成视黄醇,且在对甲酰四氢叶酸的转化中起到了重要的作用。
视黄醇是维生素A的前体,需要经过两个步骤才能够转化为维生素A。
其中第一步是视黄醇脱氢酶催化视黄醇转化为视黄酸,第二步则是由觉醛丢失酶催化将视黄酸还原成真正的维生素A。
在维生素A家族中,还有一类化合物叫做类视黄酮,它们是一类黄酮化合物,在人类和动物的膳食中广泛存在。
类视黄酮和维生素A的生物学功能非常相似,都具有重要的保健作用,但相较之下类视黄酮的生化代谢则相对简单。
类视黄酮在肠道和肝脏中未经代谢即可被人体吸收,然后在人体组织中发挥抗氧化和抗炎作用。
胡萝卜素的生物学功能维生素A和类视黄酮是膳食中的必需成分,它们在人体内发挥了多种生理功能。
首先,维生素A是一个广泛的功能蛋白修饰物,其中维生素A酸是一种按需生成的信号分子,能够干扰转录因子的活动从而影响一系列重要的生理过程。
维生素A在视觉功能方面也具有至关重要的作用。
视黄醛是视觉信号的传递物质,当视黄醛与视黄酸结合时则能够转化为维生素A,进而影响视网膜的光感受能力和视力调节。
除此之外,维生素A还参与了人体免疫系统和生殖系统的调节过程,对于细胞分化、增殖和凋亡等生命历程具有调控作用。
类视黄酮则能够通过抑制自由基的生成和氧化损伤来发挥保健作用,对于癌症、心血管疾病、老年痴呆等健康问题有一定的预防作用。
生物化学英文翻译nucleoside 英语翻译:核苷Okazaki fragment 英语翻译:冈崎片段oncogene英语翻译:癌基因,原癌基因one carbon unit 英语翻译:一碳单位operator 操纵基因operon 操纵子orotic acid 乳清酸ossification 成骨作用oxaloacetic acid 草酰乙酸oxidases 氧化酶类oxidative phosphorylation 氧化磷酸化oxidoreductase 氧化还原酶palindrome 回文结构pancreatic lipase 胰脂肪酶pantothenic acid 遍多酸pentose 戊糖pentose phosphate pathway 磷酸戊糖途径pepsin 胃蛋白酶pepsinogen 胃蛋白酶原peptide 肽peptide bond 肽键peptidyl site 肽基位或P位peroxidase 过氧化物酶phenylalanine 苯丙氨酸phosphatidic acid 磷脂酸phosphogluconate 磷酸葡萄糖酸phospholipase 磷脂酶plasmid 质粒polycistron 多作用子polypeptide 多肽porphyrin 卟啉precipitation 沉淀preproalbumin 前清蛋白原primary structure 一级结构primase 引发酶primer 引物glucogenic amino acid 生糖氨基酸 glucokinase 葡萄糖激酶 gluconeogenesis 糖(原)异生作用 glutamic acid 谷氨酸glutaminase 谷氨酰胺酶glutamine 谷氨酰胺glutathione 谷胱甘肽glycerol 甘油glycine 甘氨酸glycogen 糖原glycogen phosphorylase 糖原磷酸化酶 glycogen synthase 糖原合成酶 glycolysis 糖酵解guanosine 鸟苷helicase 解链酶(解旋酶)heme 血红素heteroduplex 杂化双链hexokinase 己糖激酶histamine 组胺histidine 组氨酸housekeeping gene 管家基因hybridization 杂交hydrogen bond 氢键hydrolase 水解酶类hydroperoxidases 氢过氧化酶类hydrophobic bond (hydrophobic interaction) 疏水键hydroxyapatite 羟磷灰石hydroxymethylglutaryl CoA cleavage enzyme HMG CoA裂解酶hydroxymethylglutaryl CoA synthetase HMG CoA合酶Hydroxyproline 羟脯氨酸acceptor site 受位acetone中文翻译:丙酮activator 中文翻译:激活蛋白,激活剂,活化物adenine (A) 腺嘌呤adenosine 腺苷aerobic dehydrogenase 需氧脱氢酶alanine 丙氨酸albumin 英语翻译:白蛋白,清蛋白allopurinol 别嘌呤醇allosteric effect 别构(位)效应allosteric enzyme 变构酶,别位酶allosteric regulation 别构调节amine 中文翻译:胺aminoacyl site A位,氨酰基位anticodon 反密码子arginine 精氨酸ascorbic acid 抗坏血酸 (维生素C)asparagine 天冬酰胺aspartic acid 天冬氨酸asymmetric transcription 不对称转录attenuator 衰减子base 中文名称:碱基base pairing 碱基配对bile pigment 胆色素biotin 生物素biotransformation 生物转化calcitriol 1,25二羟胆骨化醇(钙三醇)calcium dependent protein kinase Ca依赖性蛋白激酶,蛋白激酶C(C激酶) Calmodulincarbohydrate 糖carnitine 肉毒碱catalase 触酶,过氧化氢酶cephalin 脑磷脂de novo synthesis 从头合成degradation英文翻译:降解denaturation 变性deoxycholic acid 脱氧胆酸deoxyribonucleotide 脱氧核糖核苷酸dialysis 英语翻译:透析dihydroxyacetone phosphate 磷酸二羟丙酮 disulfide bond 二硫键DNA polymerase DNA聚合酶domain 域,结构域,功能区donor site 给位double helix 双螺旋effector 效应器,效应物elongation 英文翻译:延长 endopeptidase 内肽酶enhancer 增强子 enolphosphopyruvate 磷酸烯醇式丙酮酸 enzyme 酶essential amino acid 必需氨基酸 essential fatty acid 必需脂肪酸exon 外显子exopeptidase 外肽酶fat 脂肪feedback inhibition 反馈抑制作用feritin 铁蛋白ferrochelatase 亚铁螯合酶folic acid 叶酸free fatty acid 游离脂肪酸free radicals 英文翻译:自由基fructose diphosphatase 果糖二磷酸酶gene cloning 基因克隆gene expression 基因表达gene library 基因文库gene transfer 基因导入,转基因genetic code 遗传密码genetic engineering 基因工程genetic recombination 基因重组genome 染色体基因,基因组globin英语翻译:珠蛋白 hypocalcemia 英文翻译:低钙血症induction 诱导initiator codon 起动信号,起始密码子 intermediary metabolism 中间代谢ionic bond 离子键isocitrate dehydrogenase 异柠檬酸脱氢酶isoleucine 异亮氨酸isomerase 异构酶类isozyme 同工酶jaundice 黄疸ketogenic amino acid 生酮氨基酸key enzyme 关键酶kinase 激酶lactate 乳酸盐lecithin 卵磷脂leucine 亮氨酸ligase 连接酶linoleate 亚油酸linolenate 亚麻酸lipoic acid 硫辛酸lipoid 英语翻译:类脂lipoprotein 脂蛋白lithocholic acid 石胆酸lyases 裂合酶类malate 苹果酸malate aspartate shuttle 苹果酸天冬氨酸穿梭metabolic regulation 代谢调节mitogen activated protein kinase 分裂原活化蛋白激酶mixed function oxidase 混合功能氧化酶molecular cloning 分子克隆molecular disease 分子病monooxygenase 单加氧酶monooxygenase system 单加氧酶体系nicotinamide 烟酰胺,尼克酰胺nitrogen balance 氮平衡pyruvate carboxylase 丙酮酸羧化酶pyruvate dehydrogenase complex 丙酮酸脱氢酶复合体pyruvate kinase 丙酮酸激酶quaternary structure 四级结构recombinant DNA 重组DNAgenetic engineering英语翻译:基因工程 regulatory gene 调节基因renaturation 复性repair 修复replication 复制repression 阻遏residue 残基respiratory chain 呼吸链restriction endonuclease 限制性内切核酸酶retinol 视黄醇(维生素A)reverse transcriptase 逆转录酶reverse transcription 逆转录作用salting out 盐析salvage pathway 补救(重新利用)途径screening 筛选secondary structure 二级结构semiconservative replication 半保留复制sense strand 有意义链sequence 序列serine 丝氨酸signal recognition particle 信号肽识别颗粒silencer 抑制子simple protein 单纯蛋白质specificity 特异性splicing 剪接作用squalene 鲨烯stage specificity 阶段特异性stercobilinogen 粪胆素原stress 应激structural gene 结构基因substrate 英语翻译:作用物substrate level phosphorylation 作用物(底物)水平磷酸化subunit 亚单位,亚基succinate dehydrogenase 琥珀酸脱氢酶supersecondary structure 超二级结构Taurine 牛磺酸telomerase 端粒酶telomere 端区(端粒)template strand 模板链termination 终止terminator 终止子terminator codon 终止信号tertiary structure 三级结构thiamine 硫胺素(维生素B1) threonine 苏氨酸thymidine 胸苷,胸腺嘧啶核苷thymine (T) 胸腺嘧啶tocopherol 生育酚proalbumin 清蛋白原processing英语翻译:加工proenzyme 酶原proline 脯氨酸promoter 启动基因 (启动子),催化剂prosthetic group 辅基protease 蛋白酶pyridoxal 吡哆醛pyridoxamine英语翻译:吡哆胺。

生物合成英语
生物合成指的是生物体内通过生化反应合成有机分子的过程,包括蛋白质合成、核酸合成、脂类合成等。
以下是关于生物合成的英语词汇和表达:
1. Protein synthesis - 蛋白质合成
2. DNA synthesis - DNA合成
3. RNA synthesis - RNA合成
4. Lipid synthesis - 脂类合成
5. Enzyme synthesis - 酶合成
6. Metabolic pathways - 代谢通路
7. Biosynthesis - 生物合成
8. Synthetic biology - 合成生物学
9. Gene expression - 基因表达
10. Transcription - 转录
11. Translation - 翻译
12. Ribosome - 核糖体
13. Codon - 密码子
14. Anticodon - 反密码子
15. Amino acid - 氨基酸
16. Nucleotide - 核苷酸
17. Fatty acid - 脂肪酸
18. Coenzyme - 辅酶
19. Pathway intermediates - 代谢途径中间产物
20. Regulatory enzymes - 调节酶
以上是一些关于生物合成的英语词汇和表达,希望能对大家学习和掌握相关知识有所帮助。
原文题目:Concentration of flavonoids and phenolic compounds in aqueous and ethanolicpropolis extracts through nanofiltrationAbstractPropolis has a variable and complex chemical composition with high concentration of flavonoids andphenolic compounds present in the extract. The extract varies with the solvent used in extraction. Ethanol extracts more phenolic acid and polar compounds than water. Before their use in industry, extracts must be concentrated but the use of high temperatures can degrade some compounds. Membrane pro-cesses is an option that allows concentration at low temperatures. Nanofiltration was carried out withaqueous and ethanolic extracts and each extract results in two distinct fractions: permeate and retentate. The capacity of the membrane to retain the compounds was verified by spectrophotometric analysis: for aqueous solution, the membrane retained around 94% of the phenolic compounds and 99% of the flavonoids, while for the ethanolic solution these values were 53% and 90%, respectively. Ferulic acid retentionindex was 1.00 and 0.88 to aqueous and ethanolic solutions, respectively. Thus, the nanofiltration processshowed high efficiency in the concentration of propolis extracts.1 IntroductionOver the last few decades, interest in functional foods has beengrowing fast, leading to the discovery of new functional components or processes that can improve food processing, as well as products that may help to retard aging or avoid diseases. In this context, bee products have gained the attention of consumers and researchers, due to their chemical compositions and functional properties. Propolis is one of the bee products with functional properties, but it cannot be consumed as a food because it is a resinous substance. It is prepared from the buds and exudates of certain trees and plants. These substances are transformed by the addition of wax and the enzyme glucosidase present in the bee saliva in order to form propolis (Bankova et al., 2000; Park et al., 1998). The product obtained is used by honeybees to protect the hives against invaders and contamination, to seal holes and to maintain the temperature. Some important characteristics have been reported for thissubstance, such as anti-microbial and antioxidant effects, anesthetic properties and others. Due to these characteristics, which can bring health benefits, propolis is considered a functional ingredient and is used in food, beverages, cosmetics and medicine to improve health and prevent diseases (Burdock, 1998; IFIC, 2009). There are over 150 constituents in propolis, including polyphenols, terpenoids, steroids and amino acids. Flavonoids are one of the most important groups and can represent around 50% of the propolis contents,depending on the region where it is collected, since its characterist ics is influenced by plants and weather (Krell, 1996; Park et al., 1998). Kumazawa et al. (2004) tested the antioxidant activity of propolis from various geographic origins and showed different activities for each sample. Other studies indicated that the propolis from Europe and China contained many kinds of flavonoids and phenolic acids, whereas the Brazilian samples had more terpenoids and prenylated derivatives of p-cumaric acid (Bankova et al., 2000). Finally, each combination of compounds in the propolis of acertain origin can represent specific characteristics in the final product.The most common propolis extracting process uses ethanol as the solvent. However, this has some disadvantages such as the strong residual flavor, adverse reactions and intolerance to alcohol of some people (Konishi et al., 2004). Researchers and industry are interested in producing a new type of extract with the same compounds extracted by the ethanolic method, but without the disadvantages. Water has been tested as the solvent, but resulted in a product containing less extracted compounds (Park et al., 1998). Konishi et al. (2004) tested water with a combination of some tensoactive compounds to replace part of the alcohol used in propolis extraction and all the tests were efficient in extracting it, and the product showed good anti-microbial activity.Depending on the application, the solvent in propolis extracts must be reduced or eliminated. The processes that are used today, as lyophilization, vacuum distillation and evaporation, have some disadvantages like the use of high temperatures and high energy consumption. Lyophilization requires large amounts of energy, since the sample needs to be maintained at À20 °C for at least 24 h, and energy is also required for the sublimation of the solvent used during preparation of the extract. Moreover, the method often requires a previous stage of concentration, maintaining the product at 70 °C until part of the solvent is evaporated.Vacuum distillation requires great amounts of energy to generate the vacuum, and can lead to loss of compounds of low molecular weight, which can be removed together with the solvent evaporated in the system. Evaporation maintains the extract underheating at 70 °C, until all the solvent is removed. This process, in addition to the high demand for energy, can degrade the flavonoid and phenolic compounds in propolis, due to the temperature used. However, it is the process that gives greater ease of implementation in companies due to low cost on the equipment required compared with the previous cases. The use of membrane concentration processes has been growing due to certain advantages, such as: low temperatures, absence of phase transition and low energy consumption (Matta et al., 2004). This procedure is based on the principle of selective permeation of the solute molecules through semi-permeable, polymeric or inorganic membranes. The driving force for mass transfer across the membrane in most membrane processes, such as a microfiltration, ultrafiltration, nanofiltration and reverse osmosis is mechanical pressure (Maroulis and Saravacos, 2003). Nanofiltration is a unit operation that permits many applications, such as solvent recovery from filtered oil, exchange of solvents in the che mical industry (Geens et al., 2006), concentration and purification of ethanolic extracts of xantophylls, which is important in both the pharmaceutical and food industries (Tsui and Cheryan, 2007) and in wine concentration (Banvolgyi et al., 2006), as well as in juice concentration (Vincze et al., 2006) in the food industry.The objective of this study was to investigate the membrane concentration of propolis extracts using water and ethanol as the solvents, exclusively, verifying the quality of the concentrated products in terms of the retention of flavonoids and phenolic compounds during processing. The process was evaluated according to the permeate flux, influence of temperature and pressure and concentration factor. The results obtained for each solution were compared to verify the viability of developing a new propolis product, based on water as the solvent.2. Materials and methods2.1. PropolisRaw propolis was obtained from Apis mellifera beehives in the State of São Paulo, Brazil, and was acquired in a single batch, in order to minimize the variability associated with the vegetation used for its production and the weather conditions. It was stored underrefrigeration (4 °C) until use in the preparation of extracts.The propolis produced in this region is characterized as group 12 (Brazil has 12 different groups of propolis, with distinct characteristics) and presents a great amount of soluble substances, antimicrobial activity against Staphylococcus aureus and Streptococcus mutans and greater anti-inflammatory activity than samples from other parts of the country, which can be associated with the higher concentrations of flavonoids and phenolic compounds found in this group (Park et al., 2002).The ethanolic propolis solution was prepared from crude propolis previously comminuted in a bench blender with a 500 W motor, homogenized, weighed on a semi-analytical balance and mixed with 80% ethanol. The mixture was kept at room temperature for 7 days and manually stirred once a day. After this period, the sample was centrifuged (Beckman –Allegra 25-R, Beckman Coulter, German) at 8800 g for 20 min. The supernatant was filtered and refrigerated for 3 h at 4 °C and then filtered again for wax removal. Finally, the esulting extract was stored at room temperature in the dark.Preparation of the aqueous solutions followed the same procedures, using deionized water. Each solution was prepared in a proportion of 20% propolis and 80% solvent. Both extracts were evaluated with respect to their flavonoid and phenolic compounds contents, to be compared with the concentrated products.2.2. Determination of total flavonoidsThe total flav onoid content of the propolis solutions was determined by the aluminum complexation method (Marcucci et al., 1998). In this procedure, the extracted solutions were diluted in the proportion of 1:10 (0.5 mL) and mixed with 0.1 mL of 10% aluminum nitrate, 0.1 mL of 1 mol/L potassium acetate and 4.3 mL of 80% ethyl alcohol. The samples were kept at room temperature for 40 min and the absorbance read at 415 nm. Quercetin was used as the standard to produce the calibration curve. The mean of three readings was used and the total flavonoid content expressed in mg of quercetin equivalents (mg/g).2.3. Determination of the phenolic compoundsThe polyphenols in the propolis solutions were determined by the Folin–Ciocalteau colorimetric method (Kumazawa et al., 2004). According to this procedure, the extracted solution was previously diluted in the proportion of 1:10 (0.5 mL) and then mixed with 0.5 mL of the Folin–Ciocalteau reagent and 0.5 mL of 10% Na2CO3. The absorbance was readat 760 nm after 1 h of incubation at room temperature. Gallic acid was used as the standard to produce the calibration curve. The mean of three readings was used and the total phenolic content expressed in mg of gallic acid equivalents (mg/g).2.4. HPLC determinationThe compounds present in the initial extract, permeate and concentrated products, were determined by HPLC as described by Parket al. (1998). Three hundred microliters of each solution were injected into a liquid chromatograph (Shimadzu, Tokyo, Japan) connected to a diode-array detector at 260 nm. The mobile phase was water/acetic acid (19:1, v/v) (solvent A) and methanol (solvent B), with a constant flow rate of 1 mL/min. The gradient started at30% solvent B, passing to 60% at 45 min, 75% at 85 min, 90% at 95 min and back to 30% at 105 min. The column was maintained at a constant temperature of 30 °C and the chromatograms processed using the computer software Chromatography Workstation (Shimatzu Corporation, Tokyo, Japan). The initial and concentrated samples were diluted in 1.5 mL of distilled water and the permeate sample was injected without dilution. The following authentic standards of phenolic acids and flavonoids (Extrasynthese, Genay, France) were examined: q-cumaric acid, ferulic acid, cinnamicacid, gallic acid, quercetin, kaempferol, kaempferide, apigenin, isorhamnetin, rhamnetin, sakuranetin, isosakuranetin, hesperidin, hesperetin, pinocembrin, chrysin, acacetin, galangin, myricetin, tectochrysin and artepillin C, as they correspond to the most usual compounds present in propolis.2.5. Membrane concentrationIn this study, the propolis extracts were concentrated using a tangential filtration system on a pilot scale, with a nanofiltration membrane as seen in the schematic diagram shown in Fig. 1. The experiments were performed on pilot equipment that permits the batch circulation mode, which means that both permeate and concentrate could be carried back to the feed tank. The permeate was totally removed just in a single experiment, where it was necessaryto obtain the concentrated product of the process. The nanofiltra tion module is equipped with a NF90 membrane (Osmonics, Minnetonka, USA) which is composed of polyamide and polysulphone, with 0.6 m2 of filtration area and 98% rejection of MgSO4 ina test performed by manufacturing with a spiral module at 20 °C and 6.0 bar. Approximately5.0 L of each solution permeated through the membrane over 30 min, this being the time necessary to complete the concentration in an open system, which means that the permeatewas removed from the process. In the trials the permeate was removed and the retentate re-circulated until a concentration factor of around four. The concentration factor is calculated according to Eq. (1):Fig. 1. Schematic diagram of the nanofiltration unit where Vf is the total volume used in the feed, Vc is the volume collected in the concentrate fraction and Fc is the concentration factor. Other experiments were carried out at different temperatures (20–45 °C) and pressures (2.0–5.0 bar), in order to evaluate the influence of these parameters on the permeate flux and the concentrated product quality. In these experiments, both the permeate and retentate were maintained under re-circulation in closed systems. The permeate flux was calculated acco rding to the following equation: J=Vp/t*Ap (2)where Vp is the permeate volume collected during the time intervalt and Ap is the membrane surface area of permeation. The quality of the filtration process was measured according to the quantity of flavonoids and phenolic compounds present in permeate, evaluated as described in Sections 2.2–2.4, and the efficiency was measured according to the flux permeate rate and retention index. This index measures the relation between the amounts of the compound of interest in permeate and in the concentrated solution, which demonstrates the ability of the membrane to retain this compound under the experimentalconditions. The index is calculated according to Eq. (3), in which R is the retention index, Cp is the concentration of the compound of interest in the permeate, and Cr is the concentration of the same compound in the retentate:R=1-Cp/Cr (3)It is important to know the rate of fouling that occurs in the membrane process, and one way of measuring this is to compare the permeate flux of the solution under study with the permeate flux when water is used as feed solution, under different pressures. Usually a variation in system pressure will cause a change directly proportional to the perme ate flux. The fouling influence was measured by comparison of the permeate flux of the aqueous propolis extract with the flux of distilled water only, increasing the pressure from 1.0 to 5.0 bar.3. Results and discussionThe membrane process was carried out with the aqueous and ethanolic solutions in a closed system, in which the retentate and permeate streams being conducted back and mixed in a feed tank isolated from the environment, to evaluate the variation in permeate flux with time. The temperature was maintained at 20 °C and the pressure at 5.0 bar. The results are shown in Fig. 2.After stabilization of the process, the permeate flux began to decrease, after around 15 min of processing. The rate of decrease was higher for the alcoholic extract than for theaqueous extract, evidencing a greater rate of fouling with the alcohol solution. After 20 min of processing, the permeate flux tended to stabilize, that is, concentration polarization already occurred and fouling did not increase with time. The permeate flux in the stable region was about 12.0 L/h m2and 25.0 L/h m2for alcoholic and aqueous solutions, respectively. The difference between the permeate flux of these solutions can be explained by their different compositions: the alcohol extract contains more compounds of low molecular weight, thus its concentration is more difficult to achieve, and this reduces the flux rate. Some of these compounds form a kind of wax which can cause more fouling in membrane.Tsui and Cheryan (2007) used nanofiltration to puri fy alcoholic corn extracts in the production of xanthophylls, and obtained a permeate flux of around 10.0 L/h m2when working at 27 bar and 50 °C. Hossain (2003) studied the membrane concentration of anthocyanins from blackcurrant pomace extracts using ultr afiltration, obtaining a maximum permeate flux of 17.3 L/h m2 at 1.4 bar and 18 °C. Using nanofiltration a permeate flux of 20 L/h m2 was obtained at 20 bar and 50 °C in the concentration of red wine (Banvolgyi et al., 2006). The red wine concentration process is important since it can be considered a similar process to the concentration of alcoholic propolis, considering that they have similar compounds in solution and use alcohol as the solvent. The similarities between the processes allow a comparison between results. Low pressures (around 6 bar) were used in the propolis concentration process, when compared to other processes cited in the literature, but even so the values obtained for the permeate flux were similar to those obtained in the other processes. Therefore this process can be assumed to be viable, mainly because of the reduced energy requirements necessary to generate the lower pressure.The pressure adopted was not characteristic of nanofiltration processes, but was sufficient to carry out this concentration procedure.Fig. 3 shows the difference between the curve of the permeate flux for the aqueous propolis extract and the curve of the permeate flux for distilled water to measure the degree of fouling in the process with the aqueous propolis solution.The difference between the permeate fluxes of water and the propolis solution shows the amount of fouling in the process, under the same conditions of temperature and pressure. This parameter increased, reaching 32% at 5.0 bar. The procedure also provided information on how the flux wasaffected by a pressure variation, showing t hat the flux changed linearly with the pressure in the region studied. In this pressure range of operation, the concentrated products did not present significant variation among the experiments.By increasing the temperature from 20 to 45 °C and maintaining the pressure at 6.0 bar it was possible to determine the relation ship between the temperature and the permeability of the mem brane. Permeate flux increased proportionally, by around 8% per degree of temperature, as shown in Fig. 4. This result may be attributed to the effect of temperature on the viscosity of the solution. Also, the composition of the concentrated products obtained at different temperatures showed no significant difference among them, thus, a higher flux can be obtained by increasing the temperature.The initial solutions, permeates and concentrates obtained by nanofiltration in open system were all subjected to a spectrophotometric analysis as described in Sections 2.2 and 2.3. The results for the aqueous solution indicated that this permeate only contained small amounts of phenolic compounds and flavonoids, while the permeate from the ethanolic solution showed greater amounts, mostly of low molar weight phenolic compounds. Considering the losses in the compounds of interest in the resulting permeate, as compared to the initial solution, it can be seen that the aqueous solution of propolis retained almost 99% of the flavonoids and 84% of the phenolic compounds. However, for the ethanolicsolution, these values were 90% and 53% for the fla vonoids and phenolic compounds, respectively,as shown in Table 1. The lower retention obtained can be explained by the occurrence of plasticization in the case of ethanolic solution. This phenomenon can cause a membrane swelling or dilation, which in turn can increase the membrane diffusivity and solubility, causing loss of compounds in process.The results for the determination of flavonoids and phenolic compounds carried out by spectrophotometric methods were verified by HPLC analysis, as described in Secti on 2.4. The substances were identified by a comparison of their retention times and ultraviolet spectra with those of standards in the literature. Chromato grams were obtained from the initial aqueous extract, and from the concentrated and permeated products, which are represented in Fig. 5a–c, where the numbers 1–3 indicate the peaks identified in the HPLC analysis.Table 2 shows the results of the quantitative analysis for all samples from the aqueous propolis solution. Comparing these data, it can be seen that there were no losses of ferulic acid to the permeate and only 20% of the caffeic acid present in the initial solution was lost to the permeate, this compound thus being the most abundant in the concentrated extract, of the compounds identified. All the aqueous solutions showed peaks located in the region thatrepresents a retention time of up to 20 min. This occurred since the water, being a polar material, only extracts polar compounds. The last peak identified in the permeated solution, probably does not represent an isolated compound but interference in the system, since this compound was not present in the other chromatograms. Ferulic acid was not identified in the permeated solution, indicating that no losses to the permeate occurred. The other peaks in the chromatograms represented compounds that could not be identified according to the standards in the literature. The permeated solution showed a small amount of compounds in low con centration, allowing to verify the efficacy of the membrane concentration process.Park et al. (1998) analyzed an aqueous propolis solution prepared in the laboratory, using HPLC, and obtained similar results to those presented in Fig. 5a, reporting peaks with low retention times that represent polar substances, and identifying the compounds quercetin and pinocembrin. In their experiment, the proportions of water and alcohol in the solvents for propolis extraction were varied. Initial solutions contained 0–90% of alcohol, through which it was demonstrated that increasing the proportion of alcohol in the solution also increased the amount ofextracted flavonoids and phenolic compounds in the propolis.The chromatograms obtained for the ethanolic solutions are presented in Fig. 5d–f. It was possible to identify peaks in the ethanolic solution throughout the process. Compounds with a retention time greater than 20 min are apolar and were extracted by ethanol, this being an advantage of the use of this solvent as compared to water, which does not extract apolars. On analyzing the chromatogram it can be seen that a considerable amount of cumaric acid was lost to the permeate (peak number 2 in Fig. 5f). This acid belongs to the phenolic acid class and has a low molar weight, which could explain the low retention capacity of the membrane for this compound. The results of the spectrophotometric analysis shown in Table 1 indicate a loss of phenolic compounds to the permeate, accounting for the cumaric acid and other compounds not being identified by the HPLC method. Using the data given in Tables 2 and 3 the retention index could be calculated from Eq. (2). These results can be observed in Table 4. The retention indexes verified that the membrane process retained the compounds of interest better when using aqueous solutions, since this resulted in smaller losses of the compounds studied to the permeate, as compared to such losses when working with the alcoholic solution. Cumaric acid was an exception, since only 56% of this compound was not lost to permeate. Despite the loss of compounds, the values obtained represent a high retention index and verify that the nanofiltration process is appropriate for propolis extracts.During their study on the concentration of red wine by nanofiltration, Banvolgyi et al. (2006) obtained a retention index of 88% for total acids, 50% for free sulfuric acids and 93% for the total extracts. Tsui and Cheryan (2007), working with the purification of xantophylls by nanofiltration obtained a retention index of 90% for total solids, 88% for proteins and 98% for xanthophylls, the major compound of their study.In the present study, the values obtained for the retention indexes were very similar tothose cited in the literature for similar processes..4 ConclusionsThe results showed that nanofiltration can be considered as a good alternative for concentrating propolis extracts, since the membrane retained most of the flavonoids and phenolic compounds, which are of major importance to propolis quality. Particularly in the case of the aqueous extract, it could be considered that there was no loss of compounds to the permeate solution, since almost 100% of the major compounds were retained. In the experiments with alcoholic propolis, the losses were considerable but this is a consequence of the higher amount of compounds extracted by alcohol. However, the method can be used for alcoholic solution since almost 90% of the flavonoids were retained. Application of this technology could increase the use of propolis in many industrial applications, it being feasible to use the aqueous extract in new research projects and in the development of new products with functional properties. Furthermore, this process allows removal of the solvent from the extract, reducing the disadvantages associated with using alcoholic extractions. It should be noted that compared with other concentration methods, in the membrane process the product is not submitted to high temperatures and there is no change in the physical state of the solvent, which means that the functional properties of the compounds of interest are preserved and the process as a whole is energy saving.译文题目:黄酮类化合物和酚类化合物在水中和乙醇蜂胶中通过纳滤膜的提取率关键词:蜂胶膜浓度黄酮类化合物酚类化合物纳滤摘要:蜂胶具有可变的、复杂的化学成分,且蜂胶中黄酮类化合物的浓度较高,酚类化合物存在于蜂胶萃取物。
生物化学词汇VOL.1tabun塔崩,二甲氨基氰磷酸乙酯[有机磷毒物]tachyki nin 速激肽tachysterol 速固醇,速甾醇tacri ne 塔克林tag标记(物),标志;尾(端)tagatose 塔格糖tagg ing 标记tail 尾(部);[噬菌体]尾部tail growth 尾增长[如用于描述聚合酶作用机理]tail tube [噬菌体]尾管taili ng 加尾taili ng peak 拖尾峰tailpoxin 泰攀蛇毒素talin 踝蛋白[膜下的一种细胞骨架蛋白,见于粘着斑]talopeptide 端肽talose 塔罗糖tamoxife n 三苯氧胺tan dem en zyme串联酶[同一多肽具有不同的酶活性]tannase鞣酸酶tannin 鞣质,单宁tannin red 鞣红taq DNA ligase taq DNA 连接酶targeted 定向的targeted tox in 导向毒素targeti ng seque ncing 前导序列,导向序列targeti ng sig nal 弓丨导信号,导向信号tautomerism 互变异构tautomerizatio n 互变异构化tautomyc in 互变霉素taxis 趋(向)性taxol红豆杉醇,紫杉酚taxon分类单位,分类群tectivirus 复层病毒[一类噬菌体]tektin 筑丝蛋白[与中间丝相类似的一种可形成丝状聚体的蛋白]telecri ne 远距分泌,远程分泌teleocid in 杀鱼菌素teliospore 冬抱子telomerase 端粒(末端转移)酶telomere 端粒telopeptide 端肽telophase 末期telos yn apsis 对端联会tenascin 腱生蛋白,肌腱蛋白[由星形细胞合成并释放,可调节细胞的形态]tendo 腱tenericute 无壁(细)菌[缺乏胞壁的细菌]ten iposide 表鬼臼毒噻吩糖苷ten sin张力蛋白[可维持微丝锚着点的张力]tenuin细丝蛋白,细棒蛋白[一种肌肉蛋白]tenuivirus 细病毒组[一组植物病毒,模式成员是水稻条叶枯病毒]teratocarcinoma 畸胎癌[恶性的畸胎癌]teratoge n 致畸剂teratoma畸胎瘤[由来自内胚层,中胚层和外胚层的混合组织组成的良性肿瘤]termin alizati on (末)端化terminase 末端酶[如见于入噬菌体,可切除cos位点]term in ator 终止子;终止剂termi nus 末端terpe ne 萜terpe noid 类萜,萜类化合物terrace 平台testa 种皮testostero ne 睾酮teta nolysin 破伤风(菌)溶血(毒)素teta no spasmi n 破伤风(菌)痉挛(毒)素tetrads 四联球菌[四个球菌作正方形排列]tetraethylam monium 四乙铵tetrahydrobiopteri n 四氢生物蝶呤tetrahydrofolate 四氢叶酸;四氢叶酸盐、酯、根tetrahydrofura n四氢呋喃tetrahydroisoqui noli ne 四氢异喹啉tetrahyme na 四膜虫属tetraiodothyro nine 四碘甲状腺原氨酸,甲状腺素tetramer 四聚体tetramethylsila ne 四甲基硅烷tetraphe ny Iphosph onium 四苯金粦tetraploid 四倍体tetraploidy 四倍性tetrasaccharide 四糖tetrasome 四体(染色体)生物tetrasomy 四体性tetraspore 四分抱子tetravirus 四病毒tetrazole 四唑[在DNA合成反应作为缩合剂](河)豚毒素tetrodotox intexas Red [商]德克萨斯红[Molecular Probe 公司生物学燃料的商标,是磺基罗丹明101的两种单磺酰氯衍生物的混合物]thalassemia 地中海贫血,珠蛋白生成障碍性贫血thallophyte 原植体植物thallospore 体裂抱子,无梗抱子thallus [真菌]菌体thapsigargi n 毒胡萝卜素,毒胡萝卜内酯thaumat in奇(异果)甜蛋白[在热带灌木奇异果的果实中法线的一种甜蛋白]thelykary on 雌核thelyplasm 雌质thelytoky 产雌孤雌生殖theoflavin 茶黄素[茶中的多元酚氧化产物]theophylline 茶碱,1,3-二甲基黄嘌呤thermolysi n 嗜热菌蛋白酶thermophile 嗜热生物thermophilic 嗜热的,耐热的thermus aquaticus 粞热水生菌thevetin 黄花夹竹桃苷thiaole 噻唑thie namyc in 噻烯霉素thigmotaxis 趋触性thioesterase 硫酯酶thioglucosidase 硫葡糖苷酶thiok in ase 硫激酶thiolase 硫解酶thiolut in 硫藤黄素thionin 硫素[一类富含Cys的植物抗病蛋白]thio nine 硫堇thiophe ne 噻吩thiophe nol 苯硫酚thioredox in 硫氧还蛋白thiosemicarbazide 氨基硫脲thiosemicarbaz one 缩氨基硫脲thiostrept on 硫链丝菌肽thiouracil 硫尿嘧啶thoracic duct 胸导管thrombi n 凝血酶thrombocytasthe nia 血小板无力症thrombocytopathy 血小板病thrombocytope nia 血小板减少thrombocytosis 血小板增多thromboglobuli n 血小板球蛋白thrombolytics 溶栓剂thrombomodulin 凝血调节蛋白,(血)栓调(节)蛋白[内皮细胞的膜蛋白,凝血酶的受体]thromboplastin 促凝血酶原激酶thromboplast inogen 促凝血酶原激酶原thrombopoiesis 血小板生成thrombopoieti n 血小板生成素thrombospondin血小板反应蛋白[一种可接受促分裂原刺激的钙结合糖蛋白,对血栓块有稳thrombosthe nin 血栓收缩蛋白thromboxane凝血烷,血栓烷thurici n 苏云金菌素thylakoid 类囊体thymic胸腺的thymid ine 胸(腺嘧啶脱氧核)苷thymidylate 胸苷酸thymine胸苷嘧啶thymocresc in 胸苷促生长素thymocyte胸腺细胞thymolphthale in 百里酚酞,麝香草酚酞thymolsulfo nphthale in 百里酚蓝,麝香草酚蓝thymopoiet in 胸腺(细胞)生成素thymosin 胸腺素thymulin胸腺(九)肽[胸腺上皮细胞分泌的一种金属肽激素]thynnin 鲔精蛋白thyroglobuli n 甲状腺球蛋白thyroliberi促甲状腺素释放素nthyromodulin 促甲状腺素调节素[可调节促甲状腺素的释放]thyronine 甲状腺原氨酸thyrotrophin 促甲状腺素thyrotrop in 促甲状腺素thyrox ine 甲状腺素ti plasmid Ti 质粒,根瘤诱导质粒tit in 肌联蛋白,粗丝联接蛋白tobamovirus 烟草花叶病毒组tobramyc妥布拉霉素intobravirus 烟草脆裂病毒组tocopherol 生育酚toepri nti趾纹法ngtogavirus 披膜病毒tolerage n 耐受原tomatidi ne 番茄碱,番茄苷配基tomati ne 番茄苷tombusvirus 番茄丛矮病毒组tomography断层照相tomoscan断层扫描ton oplast 液泡形成体,液泡膜topoisomerase 拓扌卜异构酶totipotency [分化]全能性totipotent cell 全能细胞totivirus 全病毒toxemia 毒血症toxicosoz in 抗毒防卫素toxoid 类毒素toyocamyc in 丰加霉素trachea 气管tracheid 管胞[见于植物]track [电泳]泳道tract段,片,(序列)段,序列(片)trans effect 反位效应trans elim in ati on 反式消除tran sacetylase 转乙酰(基)酶tran sacetylation 转乙酰(基)作用tran sacylase 转酰(基)酶transacylati on 转酰基作用tran saldolase 转酰酶tran sam in ase 转氨酶tran sam in ati on 转氨基作用,氨基交换tran scarbamylase 转氨甲酰(基)酶tran scarbocylase 转羧(基)酶tran scobalamin 钻胺传递蛋白tran scortin 运皮质(激)素蛋白,皮质(激)素运载蛋白tran scribed spacer (可)转录间隔区tran script 转录物tran scriptase 转录酶tran scripti on 转录tran scytosed protein 胞转蛋白tran scytosis 胞(吞)转(运作用),转胞吞(作用)tran scytotic vesicle 胞转小泡tran sdeam in ati on 联合脱氨(基)作用tran sdetermi natio n 转决(定)tran sdiffere ntiati on 转分化tran sducer 转导物,转导器,转导蛋白transducin 转导素[一种可激活cGMP特异性磷酸二酯酶的G蛋tran sducta nt 转导子,转导体transduction 转导[以病毒为媒介的基因转移];[信号]转导,转换,传导tran sesterificati on 转酯(作用),酯基转移(作用),酯交换(作用)tran sfecta nt 转染子tran sfecti on 转染[通过病毒核酸进入细胞而实现的遗传转化]tran sfectoma 转染瘤transfer cell 传递细胞[见于植物]transfer DNA 转化DNA[Ti质粒上能转移至植物基因组的DNA]tran sferase 转移酶transferon 转移决定子[决定某一蛋白从一个区室转移到另一个区室的序列要素]transferrin 运铁蛋白tran sforma nt 转化体tran sformatio n 转化tran sframe protein 跨读框蛋白(质)transgene转基因[整合到转基因动植物基因组中的外源基因]tran sge nic 转基因的tran sge nics 转基因学transgenome转移基因组tran sglycosylase 转糖基酶,转糖苷酶tran sglycosylation 转糖基作用,转糖苷作用tran sgressive 超亲的tran shydroge nase 转氢酶transhydroxylation 转羟基(作用),羟基转移tran shydroxylmethylase 转羟甲基酶tran sillumi natio n 透照,透射tran sillu min ator 透照仪,透射仪tran siti on (碱基)转换;过度;跃迁tran sketolase 转酮酶tran slation 翻译;平移translation hop 翻译跳步[翻译时越过某些密码子]mRNA translational intron 翻译内含子[翻译过程中被绕过的部分编码序列]tran slocati on 运输,转运;易位,转位tran slocator 转运蛋白tran sloc on 易位子transmembrane 跨膜的tran smissible 可传递的(遗传)的tran smitter 递质tran speptidase 转肽基酶tran speptidati on 转肽作用tran speptidylase 转肽基酶tran speptidylati on 转肽基作用tran spirati on 蒸腾作用tran sporter 转运蛋白,运载蛋白tran sposable 转座的tran sposase 转座酶tran spositi on 转座(作用)tran spositi onal 转座的tran spos on 转座子tran ssulfatio n 转磺基作用,转硫磺酸基作用tran sthyretin 运甲状腺素蛋白,甲状腺素运载蛋白tran sversio n (碱基)颠换trasylol [商]胰Kunitz胰蛋白酶抑制剂[Bayer公司商标]traumat in 愈伤激素,创伤激素trehalase 海藻糖酶trehalose 海藻糖treponema密螺旋体属triacetin 三乙酰甘油酯trichoderma 木霉菌属trichodermin 木霉菌素trichome (细菌)毛状体trichomyc in 抗滴虫霉素,曲古霉素trichophyt on 毛癣菌属trichoplusia ni 粉纹夜蛾trichosa nthin 天花粉蛋白trichothec in 单端抱菌素trimethoprim 三甲氧苄二氨嘧啶[抗代谢物,二氢叶酸类似物]triskelion 三脚蛋白体,三脚蛋白复合体[网格蛋白由三条重链和三条轻链组成,在电镜下呈现特殊的三脚形]trisome 三体(染色体)生物trisomy 三体性tristearin 三硬脂酰甘油酯triterpe ne 三萜triton [商]曲通,非离子型去污剂tropa ne 托烷trophoblast 滋养层troph onu cleus 滋养核tropocollage n 原胶原tropoelast in 原弹性蛋白tropomoduli n 原肌球调节蛋白【可与原肌球蛋白结合】tropomyos in 原肌球蛋白troponin 肌钙蛋白truffles 块菌[一类真菌]trypa n blue 台盼蓝,锥虫蓝trypa no some 锥虫trypsin 胰蛋白酶tryps ini zati on 胰蛋白酶消化tryps inogen 胰蛋白酶原tryptami ne 色胺trypt one 胰(蛋白酶)化(酪)蛋白胨tryptophyllin 色氨肽tubercidin 杀结核菌素tuberculi n 结核菌素tubocurari ne 筒箭毒,管箭毒碱,箭毒块茎碱tubulin 微管蛋白tumoricidal 杀肿瘤的tumorige nesis 致瘤,肿瘤发生tumorige ni city 致瘤性tuni camyc in 衣霉素tuni cate 被囊动物turanose 松二糖tween [商]吐温[ICI Americas 公司商标,非离子型去污剂]twichin 颤搐蛋白[一种肌肉蛋白,具有调节肌肉收缩的功能]tygon [商]聚乙烯[Norton 公司商标]tylophora alkaloid 娃儿藤属生物碱tylophori ne 娃儿藤碱tylophori ne alkaloid 娃儿藤属生物碱tylosi n 泰乐菌素tymovirus 芜菁黄花叶病毒组tyn dallizati on 间歇灭菌(法)tyrami ne 酪胺tyrocidi ne 短杆菌酪肽tyros in ase 酪氨酸酶tyrothric in 短杆菌素,混合短杆菌肽tyrotoxin 酪毒素,氢氧化偶氮苯tyrphost in 酪氨酸磷酸化抑制剂tyvelose 泰威糖,3,6-二脱氧甘露糖。
生物化学(英文版)教学大纲第一篇:生物化学(英文版)教学大纲《生物化学》(英文版)教学大纲课程编号:15010003总学时数:86学时(另有实验教学33学时)学分:5学分一、课程性质、目的和要求生物化学是生物科学和生物技术专业的一门重要的必修专业基础课。
学习和掌握生物化学的基本理论和技术对于其它生物学科的学习及今后的相关工作都具有十分重要的意义。
开展生物化学双语教学的目的是使学生在系统学习和掌握生物化学的理论和和实践知识的同时,更好地掌握和应用专业外语,培养成具有国际合作意识、国际交流与竞争能力的外向型人才。
鉴于生物化学是一门知识涉及面广,复杂程度高的学科,所以,我们将生物化学双语教学分为不同层次开设,即基础生物化学和高级生物化学的双语教学。
在基础生物化学的双语教学中,着重要求学生学习和掌握生物化学的基本理论、基本知识和基本原理;同时也要求了解一些本学科发展前沿的新理论、新动向,使学生打下生物化学基本理论和知识的坚实基础,适应以后的高级生物化学双语教学及相关学科的学习。
同时,采用原版英文生化教材,有利于学生尽快接触生化发展的新知识,扩大知识面,提高学生阅读英文专业文献的能力,适应生物化学的高速发展。
不仅使学生获得较为广博的生物化学基本理论和基础知识,而且使学生初步树立科学的世界观和人生观,学会用辩证唯物主义的正确观点认识生命的现象和本质,从而使学生进一步学习和工作打下坚实的基础。
二、教学内容、要点和课时安排本课程的教学内容共分十三章。
Section A Cell organization5课时A1 ProkaryotesA2 EukaryotesA3 MicroscopyA4 Cellular fractionation Section BAmino acids and proteins9课时B1 Amino acidsB2 Acids and basesB3 Protein structureB4 Myoglobin and hemoglobinB5 CollagenB6 Protein purificationB7 Chromatography of proteinsB8 Electrophoresis of proteinsB9 Protein sequencing and peptide synthesis Section C Enzymes6课时C1 Introduction to enzymesC2 ThermodynamicsC3 Enzyme kineticsC4 Enzyme inhibitionC5 Regulation of enzyme activity Section D Antibodies6课时D1 The immune systemD2 Antibody structureD3 Polyclonal and monoclonal antibodiesD4 Antibody synthesisD5 Antibodies as tools Section E MembranesE1 Membrane lipidsE2 Membrane protein and carbohydrateE3 Membrane transport: small moleculesE4 Membrane transport: macromoleculesE5 Signal transudation Section F DNA structure and replicationF1 DNA structureF2 ChromosomesF3 DNA replication in bacteriaF4 DNA replication in eukaryotes Section GRNA synthesis and processingG1 RNA structureG2 Transcription in prokaryotesG3 The lac operonG4 The trp operonG5 Transcription in eukaryotes: an overview G6 Transcription of protein-coding genes in eukaryotesG7 Regulation of transcr iption by RNA Pol ⅡG8 Processing of eukaryotic Pre-mRNAG9 Ribosomal RNAG10 Transfer RNA Section HProtein synthesisH1 The genetic codeH2 Translation in prokaryotesH3 Translation in eukaryotesH4 Protein targetingH5 Protein glycosylation Section IRecombinant DNA technologyI1 Restriction enzymesI2 Nucleic acid hybridizationI3 DNA cloningI4 VirusesI5 DNA sequencing6课时 6课时 8课时 6课时 6课时I6 Polymerase chain reaction Section J Carbohydrate metabolism10课时J1 Monosaccharides and disaccharidesJ2 Polysaccharides and oligosaccharidesJ3 GlycolysisJ4 GluconeogenesisJ5 Pentose Phosphate PathwayJ6 Glycogen MetabolismJ7 Control of glycogen metabolism Section KLipid metabolism6课时K1 Structures and roles of fatty acidsK2 Fatty acid breakdownK3 Fatty acid synthesisK4 TriacylglycerolsK5 CholesterolK6 Lipoproteins Section LRespiration and energy6课时L1 Citric acid cycleL2 Electron transport and oxidative phosphorylation L3 Photosynthesis Section MNitrogen metabolism6课时M1 Nitrogen fixation and assimilationM2 Amino acid metabolismM3 The urea cycleM4 Hemes and chlorophylls三、教学方法采用英文原版教材,实行双语教学,制作PPT课件,利用多媒体技术和适当的板书辅助教学。
幻灯片1第十三章蛋白质的生物合成(翻译)(Protein Biosynthesis,Translation)蛋白质的生物合成,即翻译,就是将核酸中由4种核苷酸序列编码的遗传信息,通过遗传密码破译的方式解读为蛋白质一级结构中20种氨基酸的序列。
幻灯片2第一节蛋白质生物合成体系(Protein Biosynthesis System)一、蛋白质生物合成的原料和所需酶类(一)合成原料mRNA(信使RNA)rRNA(核糖体RNA)tRNA(转运RNA)1. 三种RNA2.20种编码氨基酸作为原料。
3.酶及众多蛋白因子,如I F、e I F。
4.A T P、G T P、无机离子。
幻灯片3(二)酶及蛋白因子1.氨基酰-tRNA合成酶ATP存在下合成氨基酰-tRNA,具有绝对特异性。
2.转肽酶催化核糖体“P位”上的肽酰基转移至“A位”的氨基酰-tRNA的氨基上,使酰基与氨基缩合形成肽键。
3.转位酶催化核糖体向mRNA的3′端移动定位于“A位”。
4.蛋白因子起始因子(initiation factor,IF);延长因子(elongation factor,EF);释放因子(releasing factor,RF)。
5.能量物质及离子能量物质为ATP和GTP;无机离子有Mg2+和K+等。
幻灯片4二、mRNA与遗传密码(一)顺反子(cistron)1.遗传学将编码一个多肽的遗传单位称为顺反子。
2.原核细胞中数个结构基因常串联为一个转录单位,转录生成的m R N A可编码几种功能相关的蛋白质,为多顺反子(p o l y c i s t r o n)。
3.真核m R N A只编码一种蛋白质,为单顺反子(s i n g l e c i s t r o n)。
幻灯片5原核生物的多顺反子3PPP5蛋白质真核生物的单顺反子3mG -5PPP蛋白质幻灯片6(二) 遗传密码及其特点1. 连续性(commaless)(1)mRNA分子上从5至3方向,由AUG开始,每3个核苷酸为一组,决定肽链上某一个氨基酸或蛋白质合成的起始、终止信号,称为三联体密码(triplet coden)。
1 中英文翻译译文一: 柑桔属类胡萝卜素生物合成途径中七个基因拷贝数目及遗传多样性的分析
摘要:本文的首要目标是分析类胡萝卜素生物合成相关等位基因在发生变异柑橘属类胡萝卜素组分种间差异的潜在作用;第二个目标是确定这些基因的拷贝数。本实验应用限制性片段长度多态性(RFLP)和简单序列重复(SSR)标记法对类胡萝卜素生物合成途径中的七个基因进行了分析。用[R-32P]dCTP标记PSY,PDS,ZDS,LCY-b,LCY-e,HY-b和ZEP cDNA片段作为作探针,使用若干限制性内切酶对来自25种柑桔基因型基因组DNA的限制性片段长度差异进行了分析。而对于SSR标记,设计两对引物分别扩增LCY-b和HY-b基因的表达序列标签(ESTs)。在这7个基因中,LCY-b只有1个拷贝,而ZDS存在3个拷贝。利用RFLP和SSR分析发现基因的遗传多样性与核心分子标记一致。RFLP和SSR对PSY1,PDS1,LCY-b和LCY-e14个基因的分析结果足以解释这几个主要的商业栽培种的系统树起源。此外,我们的分析结果表明,不同种类柑橘中类胡萝卜素积累的番茄红素环化酶LCY-b和LCY-e1等位基因存在种间差异。前人报道PSY,HY-b和ZEP基因与种间类胡萝卜素含量差异密切相关,但本实验发现这些等位基因并不起关键作用。
关键词:柑桔;类胡萝卜素;生物合成基因;基因变异;系统发育 前言 类胡萝卜素是植物光合组织中普遍存在的一类色素。在色素蛋白复合体中,它们作为光敏元件进行光合作用,并且防止过强光照强度引起的灼伤,并在园艺作物果实,根,或块茎色泽和营养品质上起着十分重要的作用。事实上,其中一些微量营养素是维生素A的前体,是人类和动物的饮食必不可少的组成部分。由于具有抗氧化性,类胡萝卜素在预防慢性疾病也发挥着重要的作用。类胡萝卜素生物合成途径现在已经明确。类胡萝卜素通过核酸编码的蛋白酶在质体中合成。其直接前体是牻牛儿基牻牛儿基焦磷酸(GGPP,该前体同时也是赤霉素,质体醌,叶绿素,维生素K,维生素E的前体)。在光合植物中,GGPP主要来源于2-C-甲基-D-赤藻糖醇-4-磷酸(MEP)途径,两分子的GGPP经八氢番茄红素合成酶(PSY)催化缩合形成一个八氢番茄红素—15-顺式-八氢番茄红素。八氢番茄红素经八氢番茄红素脱氢本科毕业设计(论文)外文翻译 2 酶(PDS)和ζ-胡萝卜素脱氢酶(ZDS)催化八氢番茄红素转换成红色的聚- 顺式-番茄红素。最近,Isaacson等和Park等分别从番茄和拟南芥中分离编码类胡萝卜素异构(CRTISO)基因,该基因催化异构化聚顺式-胡萝卜素进入全反式类胡萝卜素。CRTISO作用于番茄红素前体环化反应形成一种全反式番茄红素。植物番茄红素的环化有两条途径:一个分支合成-胡萝卜素,另一个分支合成α-胡萝卜素。番茄红素β环化酶(LCY-b)通过两个步骤转换成-胡萝卜素,而形成的-胡萝卜素的过程需要两种酶,番茄红素ε-环化酶(LCY-e)和番茄红素环化酶(LCY-b)。α-胡萝卜素经α-胡萝卜素羟化酶(HY-e)和-胡萝卜素羟化酶(HY-b)的羧基化催化作用转化为叶黄素。-胡萝卜素经HY-b的羟化反应催化和玉米黄质环氧化酶(ZEP)环氧化催化作用合成其他叶黄素。到目前为止,柑橘中大多数的类胡萝卜素生物合成的基因已被克隆和测序,但对柑橘类水果类胡萝卜素合成的复杂调控的认识仍然十分有限的,需要进一步了解柑橘中这些有差异的等位基因拷贝数,因为这些基因会影响柑橘类水果中最来源丰富的类胡萝卜素组成。 果实类胡萝卜素的结构较为复杂,在柑橘类水果中已查明有115种不同的类胡萝卜素。柑橘果肉类胡萝卜素丰富程度取决于环境条件,特别是生长条件和地理环境。但影响类胡萝卜素质量变化的主要因素是遗传的多样性。Kato等表明中国柑橘和橙汁积累高水平的β-隐黄质和紫黄质,成熟的柠檬积累低水平的类胡萝卜素。Goodnr等发现红西柚汁含有两个主要类胡萝卜素:番茄红素和胡萝卜素。最近,我们对栽培变异柑桔品种类胡萝卜素组分含量不同从生物合成途径上进行了广泛的研究。根据是否含有不同的化合物将其分成三类:(1)中国(普通)柑桔,甜柑,酸橘;(2)蜜饯,柠檬,和酸橙;(3)柚和葡萄柚。我们的研究也明确了致使类胡萝卜素结构的多样关键步骤。在酸柑橘中八氢番茄红素合成是一个限制步骤;番茄红素形成α-胡萝卜素和β-胡萝卜素是被酸式磷酸盐限制在第三个分类中(柚和葡萄柚);只有第1组品种能够合成紫黄质。在同一研究中,以是否存在的类胡萝卜素(以下这种分类也被称为类胡萝卜素组织多样性)和遗传多样性评价为基础,我们认为应通过生化或分子分子标记遗传多样行评估在种间一级组织中的多样性,类胡萝卜素的组成如同工酶或随机扩增多态性DNA(RAPD)对大量的柑桔品种进行分类。此外,我们还得出结论认为,在种间水平,类胡萝卜素结构多样性和柑橘属的进化过程有关系,而不是突变事件或人为的甄选过程。事实上,在种间水平,在柑桔栽培历史上,表型变异和遗传多样性的关系具有普遍性和一般性,这和不能适应环境的不平衡相关联。因此,从数值分类的基础上,或从形态性状的分子标记分析,所有的研究者均认为:存在着三种基本分类(宽皮桔类;中国柑桔;枸橼,蜜饯;文旦,柚),其差异是由于异域的演变。其他种植柑桔的品种(甜橙类,甜桔;酸橙类,酸桔;柑橘属葡萄柚,葡萄柚;柠檬类,柠檬)是杂交的结果,而酸橙类本科毕业设计(论文)外文翻译 3 则可能是佛手柚和薇甘菊的杂交种。先前研究柑桔演变的结果和数据使我们提出这样的假设:等位基因变异导致类胡萝卜素水平的结构差异,原因在于次级代谢产物的产生。这种分子变异可能有两种不同的影响:一方面,非沉默替换编码区影响生物合成途径相应酶的作用;另一方面,非编码区域的变化影响转录或转录后机制。 到目前为止,没有人研究过柑桔中类胡萝卜素生物合成途径的等位基因多样性。本实验的目的是为了研究基因变异是否部分决定种间水平表型变异性。为此,我们应用RFLP分析了类胡萝卜素生物合成途径中的7个基因(PSY,PDS,ZDS,LCY-b,LCY-e,HY-b,ZEP),以及两个SSR序列分析一批有代表性品种的LCY-b和HY-b基因,旨在解决下列问题:(a)这7个基因是单基因还是多基因位点;(b)RFLP法和SSR标记法显示的差异性与栽培柑桔的记录一致,从而可以推论次级产物基因系统发生的起源。(c)多样性与表型的(类胡萝卜素化合物)变化相关联。 结果与讨论 本实验应用RFLP分析法来观察基因型样本的整体差异。用类胡萝卜素生物合成途径中的7个主要基因的表达序列作为探针进行RFLP分析,每一个基因用一个或两个限制性内切酶,筛选内含序列及酶切位点的基因组序列,以基因组DNA为模板PCR扩增和酶切PCR产物。结果表明没有一个PDS和LCY-b片段的内含子序列。在这两个片段克隆和序列分析相应的基因组序列中没有检查出内含序列(数据未显示)。相反,我们发现PDS,ZDS,HY-b,ZEP和LCY-e基因组含有RFLP探针序列。EcoRV并没切断PDS,ZDS,HY-b,ZEP和LCY-e基因组序列。以同样的方式,没有发现PDS,ZDS和HY-b的基因组序列的BamHI酶切位点。表4是对于不同基因多样性观察有关的数据。总共58个片段被确定,它们中的六个是单一同态的(存在于个体中)。三个基本分类单元的有限样本中,58个之外只有8个条带不能被观察到。在基本分类单位,每个基因型遗传距离的平均数分别是,宽皮橘类24.7,中国柑橘24.7,柠檬类17这与次级物种的28(酸橙类)到36(橙类)不同。每个基本的分类单元个体RFLP条带的平均数均低于次级物种类群。结果表明次级物种比基于三个基因分类的基本物种更加杂合。这是合理的如果我们假设次级物种起源于三个基本分类,此外经RFLP围绕类胡萝卜素生物合成途径的基因分析柠檬类好像是最杂合程度最小的分类单元。如同功酶,RAPD,SSR标记法所示。 四种甜橘子的分析显示所有的基因同样的标记,三种酸橙类的代表和三种葡萄柚也是。在接下来的研究中,次级代谢产物仅有一个个体参加。基因多样性的机体组成显示相邻系统树以所有RFLP标记波带的有无的片段的不同指标为基础。区分出八个不同的标记。主要的线束被识别;第一个组是中国柑橘和甜橘,第二文旦和葡萄柚,第三柠檬和酸的柑橘属的多数。两种柠檬接近酸柑橘属的线束而三种酸橘子接近橘子或甜橙的线束。以RFLP标记为基础的遗传多样性的机体组成获得类胡本科毕业设计(论文)外文翻译 4 萝卜素合成途径的七个基因和通过不定性分子组成的时标获得的是相似的,通过定性分子组分获得的也是一样。所有这些结果表明观察RFLP和SSR片段是完好的系统标记。这和我们的基础假说相似,主要的区别在于涉及类胡萝卜素生物合成途径基因先于次级杂交物种的产生,因此在三类基础分类中等位基因的构成源于等位基因的重组。 PSY基因分析 因为PSY探针和EcoRV或BamHI限制性内切酶结合,所以可以把五个染色体条带看成是两种酶,观察两或三个染色体条带的基因型。这些条带中的一个出现在所有个体中。没有限制性酶切位点在探针序列中。这些结果使我们相信PSY在两个基因位点出现,一个用限制性内切酶发现没有多态性,另一个有多态性。用EcoRV和BamHI不同的标记观察分别是六或四,总共10个不同的标记在25个个体中。两种PSY基因也在番茄,烟草,玉米,水稻中被发现。相反地,在拟南芥和在胡椒中仅仅发现一个PSY基因,在它的果实中也积累胡萝卜素。根据Bartley和Scolnik的研究,PSY1表达在番茄果实的色素细胞中,PSY2特殊在它在叶片组织中表达。同样的方法,在禾本科(玉米,水稻)中,Gallagher等发现PSY基因是被复制出来的,在胚乳中PSY1而并非是PSY2转录产物与胚乳类胡萝卜素积累有关。这些结果强调基因复制的作用和特有组织的八氢番茄红色合酶在类胡萝卜素积累的调控中的重要性。 所有的多态性条带出现在基础分类群的基因组。假定该假说,在相同的基因位点为PSY基因所有的条带描述多态性,我们能断定我们发现等位基因的区别在三类基础分类,柑三个等位基因,中国柑橘四个等位基因,柠檬类一个等位基因。 观察三类基础分类的所有等位基因,然后我们能确定所有物种基因型。表七中给出PSY基因多态性位点推测的基因型。甜橘和葡萄柚是中国柑橘和甜橙的杂合。四种酸橙是杂合的;它们和中国柑橘共用相同的等位基因但和柚有一个不同的等位基因。克莱门氏小柑橘是两种中国柑橘(柑橘和酸柑)等位基因的杂合;一个与甜橙共用,而一个与柳橙共用。“Meyer”柠檬是杂合的,中国柑橘的等位基因也在甜橙和柠檬中被发现,“Eureka”柠檬也是柚四种酸橙等位基因和柠檬等位基因的杂合。其它的酸柑橘属是纯合的。 PDS基因 将EcoRV与PDS探针结合,观察到六个不同的片段。一个为所有个体所共有。每个个体的片段数量是两或三个。这些结果使我们相PSY在两个基因位点出现,用限制性内切酶发现一个没有多态性,另一个有多态性。相反地,对拟南芥,番茄,玉米和水稻的研究显示PDS是一个单独的拷贝基因。然而,前人对柑橘属的研究表明PDS基因作为一个低拷贝的基因家族在柑橘属基因组中,这与我们的发现相矛盾。 ZDS基因 ZDS标记是复合体。通过EcoRV和BamHI限制可以分别观察到九和五个片段。这两种酶中的一个片段是所有个体都有。对于EcoRV每个单独个体基因