
silo4_manual
- 格式:pdf
- 大小:3.01 MB
- 文档页数:71

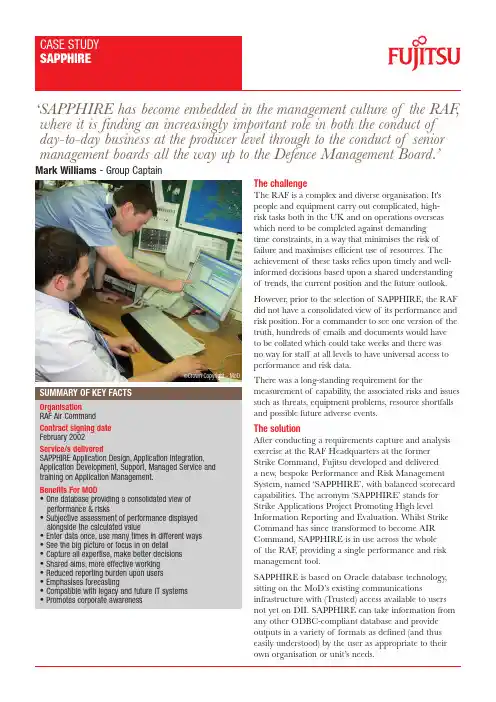
The challengeThe RAF is a complex and diverse organisation. It's people and equipment carry out complicated, high-risk tasks both in the UK and on operations overseas which need to be completed against demanding time constraints, in a way that minimises the risk of failure and maximises efficient use of resources. The achievement of these tasks relies upon timely and well-informed decisions based upon a shared understanding of trends, the current position and the future outlook.However, prior to the selection of SAPPHIRE, the RAF did not have a consolidated view of its performance and risk position. For a commander to see one version of the truth, hundreds of emails and documents would have to be collated which could take weeks and there was no way for staff at all levels to have universal access to performance and risk data.There was a long-standing requirement for themeasurement of capability , the associated risks and issues such as threats, equipment problems, resource shortfalls and possible future adverse events.The solutionAfter conducting a requirements capture and analysis exercise at the RAF Headquarters at the former Strike Command, Fujitsu developed and delivered a new , bespoke Performance and Risk Management System, named ‘SAPPHIRE’, with balanced scorecard capabilities. The acronym ‘SAPPHIRE’ stands for Strike Applications Project Promoting High level Information Reporting and Evaluation. Whilst Strike Command has since transformed to become AIR Command, SAPPHIRE is in use across the whole of the RAF , providing a single performance and riskmanagement tool.SAPPHIRE is based on Oracle database technology , sitting on the MoD’s existing communicationsinfrastructure with (Trusted) access available to users not yet on DII. SAPPHIRE can take information from any other ODBC-compliant database and provide outputs in a variety of formats as defined (and thus easily understood) by the user as appropriate to their own organisation or unit’s needs.‘SAPPHIRE has become embedded in the management culture of the RAF , where it is finding an increasingly important role in both the conduct of day-to-day business at the producer level through to the conduct of senior management boards all the way up to the Defence Management Board.’Mark Williams - Group CaptainSUMMARY OF KEY FACTSOrganisation RAF Air Command Contract signing date February 2002Service/s deliveredSAPPHIRE Application Design, Application Integration, Application Development, Support, Managed Service and training on Application Management.Benefits For MOD• One database providing a consolidated view of performance & risks• Subjective assessment of performance displayed alongside the calculated value• Enter data once, use many times in different ways • See the big picture or focus in on detail • Capture all expertise, make better decisions • Shared aims, more effective working • Reduced reporting burden upon users • Emphasises forecasting• Compatible with legacy and future IT systems • Promotes corporate awarenessEmphasises forecasting SAPPHIRE providesimmediate access to history and trend information but focus is now on forecasting and managing the future. The application allows managers to enter performance and risk forecasts to any future time period based upon proposed management and mitigation strategies detailed in report narratives.Compatible with legacy and future systems, adding value to existing data Data from other sources can be imported without the need for manual transcription, saving time and improving consistency which adds value to that data.Promotes corporate awareness Training for users of the application and its subsequent use in everyday management has helped to remove silo thinking.Future DevelopmentsThe system will continue to be developed to reflect the unique business needs of new users and toenhance core functionality to existing users, including investigation of alternate user interfaces and automated data feeds from extant applications.An increasing user community as DII(F) rolls out across Defence, enabling business areas the opportunity to adopt SAPPHIRE as their preferred performance, risk and business management tool.Our ApproachSAPPHIRE was delivered in phases by Fujitsu, allowing early benefits as well as quick response to requirements for changes and enhancements. The SAPPHIRE training has contributed to the cultural and mind-set changes which were critical to achieving optimum ROI.The ExpertiseFujitsu were chosen because of their proven expertise in project management, application development, implementation, support and managed services.Wing Commander Nicky Mellings, the SAPPHIRE User Champion, stated: ‘SAPPHIRE continues to provide key benefits to (not just) AIR Command (but the RAF as a whole), enabling senior management at all levels to view, understand and manage their outputs effectively and efficiently. The ability to view the present position, married against risks, allows senior managers to make (better) informed decisions to mitigate future risks and improve future performance.’Fujitsu implements changes and additions to SAPPHIRE functionality as user needs evolve, and provides on-line support to users and system administrators as well as managed support services and training for instructors and those performing application management roles.Although it was the RAF’s requirements that drove SAPPHIRE’s development, it has been successfully adopted by other MoD departments as theperformance and risk management tool of choice. The system design is generic and because the user defines the business rules, it can be applied to any organisation.SAPPHIRE operates at SECRET and RESTRICTED data classifications, with user definable rules that allow access to pre-determined individuals whilst still promoting information sharing on a ‘need-to-know’ or ‘duty-to-share’ basis.Benefits for our CustomerOne version of the truth One database providing a consolidated view of operational performance, risks and issues giving a single version of the truth available in one place, transforming decision-making and operational management.Subjective assessment of performance displayed alongside the calculated value Subjective military assessment of performance can be added without overriding calculated, objective assessments so that the extent of the judgement applied is always apparent.Enter once, use many times in different ways Data is entered only once but can be used again and again, categorised in a variety of ways (for example, Defence Lines of Development, user-defined structures and keywords) and viewed or manipulated to suit user output needs through the generation of reports.See the big picture or focus on detail Huge amounts of information are consolidated into simple summaries by users, who can drill down to the supporting data if required.Capture all expertise, make better decisions Accurate information entered by experts in their area gives senior management a clearer understanding of the factors and impacts which lead to better, faster decisions.Shared aims, more effective working Senior officers are equally aware of a consistent big picture, which helps them work together more effectively .Reduced reporting burden upon users Previous reporting systems were labour intensive. WithSAPPHIRE, comprehensive reports are viewed easily on-screen and information can be selected then presented in various formats.。

vSAN ™Networking Done RightIncrease vSAN Efficiency with Mellanox Ethernet InterconnectsHigher EfficiencyEfficient Hardware OffloadsA variety of new workloads and technologies are increasing the load on CPU utilization. Overlay networks protocols, OVS processing, access tostorage and others are placing a strain on VMware environments. High performance workloads require intensive processing which can waste CPU cycles, and choke networks. The end result is that application efficiency is limited and virtual environments as a whole becomes inefficient. Because of thesechallenges, data center administrators now look to alleviate CPU loads by implementing, intelligent, network components that can ease CPU strain, increase networkbandwidth and enable scale and efficiency in virtual environments.Mellanox interconnects can reduce the burden byoffloading many networking tasks, thereby freeing CPU resources to serve more VMs and process more data. Side-by-side comparison shows over a 70% reduction in CPU resources and a 40% improvement in bandwidth.Without OffloadsWith Mellanox OffloadsvSphere 6.5, introduced Remote Direct MemoryAccess over Converged Ethernet (RoCE). RoCE allows direct memory access from one computer to another without involving the operating system or CPU. The transfer of data is offloaded to a RoCE-capable adapter, freeing the CPU from the data transferprocess and reducing latencies. For virtual machines a PVRDMA (para-virtualized RDMA) network adapter is used to communicate with other virtual machines. Mellanox adapters are certified for both in vSphere.RoCE dramatically accelerates communication between two network endpoints but also requires a switch that is configured for lossless traffic. RoCE v1 operates over lossless layer 2 and RoCE v2 supports layer 2 and layer 3. To ensure a lossless environment, you must be able to control the traffic flows. Mellanox Spectrum switches support Priority Flow Control (PFC) and Explicit Congestion Notification (ECN) whichenables a global pause across the network to support RDMA. Once RoCE is setup on vSphere close-to-local, predictable latency can be gained from networked storage along with line-rate throughput and linear scalability. This helps to accommodate dynamic, agile data movement between nodes.RoCE CertifiedReduce CPU OverheadWith RDMAWithout RDMA VMware Virtual SANVMware's Virtual SAN (vSAN) brings performance, low cost and scalability to virtual cloud deployments. An issue that cloud deployment model raises is the problem of adequate storage performance to virtualinstances. Spinning disks and limited bandwidth networks lower IO rates over local drives. VMware’s solution to this is vSAN which adds a temporary local storage “instance” in the form of a solid -state drive to each server. vSAN extends the concept of local instance storage to a shareable storage unit in each server, where additionally, the data can be accessed by other servers over a LAN. vSAN brings. The benefits of VSAN include:•Increased performance due to local server access to Flash storage•Lower infrastructure cost by removing the need for networked storage appliances •Highly scalable --simply add more servers to increase storage •Eliminate boot storms since data is stored locally•Unified management --no storage silo versus server silo separation problemsMellanox 10/25G Ethernet interconnect solutions enable unmatched competitive advantages in VMwareenvironments by increase efficiency of overall server utilization and eliminating I/O bottleneck to enable more virtual machines per server, faster migrations and speed access to storage. Explore this reference guide to learn more about how Mellanox key technologies can help improve efficiencies in your vSAN environment.Scalable from a half rack to multiple racksHalf Rack 12 nodesFull Rack 24 nodesPay As You Grow Switching10 Racks up to 240 nodesDeployment Config134411GbE link: 1GbE Transceiver125/10GbE link: QSFP to SFP+324100GbE link: QSFP to QSFP 100/40GbE link: QSFP to QSFP Provisioning & Orchestration▪Zero-touch provisioning ▪VLAN auto-provisioning▪Migrate VMs without manual configuration▪VXLAN/DCI support for VM migration across multiple datacenters for DRMonitoring▪Performance monitoring ▪Health monitoring ▪Detailed telemetry▪Alerts and notificationsAutomated Network▪½ 19” width, 1U height ▪18x10/25GbE + 4x40/100GbE ▪57W typical (ATIS)2Mellanox InterconnectsiSERStorage virtualization requires an agile and responsive network. iSER accelerates workloads by using an iSCSI extensions for RDMA. Using the iSER extension lowers latencies and CPU utilization to help keep pace with I/O requirements and provides a 70% improvement in throughput and 70% reduction in latencies through Mellanox Ethernet interconnects.Deliver 3X EfficiencyHyper-ConvergedReduce CapEx ExpenseHyper-Converged Infrastructure (HCI) is a demanding environment for networking interconnects. HCI consists of three software components: compute virtualization, storage virtualization and management, in which all three require an agile andresponsive network. Deploying on 10, or better, 25G network pipes assists as does network adapters and switches with offload capabilities to optimizeperformance and availability of synchronization and replication of virtualized workloads.CapEx Analysis: 10G vs. 25GMellanox adapters and switches accelerate VM resources toimprove performance, enhance efficiency and provide high-availability and are a must-have feature for any VMware environment. Ethernet AdaptersMellanox Connect-X adapters:▪Enable near-native performance for VMs thru Stateless offloads ▪Extend hardware resources to 64 PF, 512 VF w/ SR-IOV & ROCE ▪Accelerate virtualized networks with VXLAN, GENEVE & NVGRE ▪Align network services withcompute services for multitenant network supportIncreasing vSAN EfficiencyIncrease vSAN Efficiency with Mellanox Ethernet Interconnects。
IMAQCS:Design and implementation of an intelligent multi-agent system for monitoring and controlling quality of cement production processesIraj Mahdavi a,*,Babak Shirazi a,Narges Ghorbani a,Navid Sahebjamnia ba Mazandaran University of Science and Technology,Babol,Iranb Department of Industrial Engineering,College of Engineering,University of Tehran,Tehran,Iran1.IntroductionThe importance of process control in quality products is clear.Most manufacturing process such as chemical and industriesprocess have automated process control systems.The majority ofautomated quality control systems are used to detect out-of-control conditions[1].Also they focused on the process output andcontrol actions.Tsung to detect changes in a process,providedfunctions of the process output and control actions[1].Wu in[2]with the help of probabilistic neural network(PNN)proposed amethod for pattern recognition of control chart in cellularmanufacturing.Yu et ed a genetic algorithm based ruleextraction approach to recognize the relationship betweenmanufacturing parameters and product quality.They integrateda knowledge-based artificial neural network and a geneticalgorithm rule extraction to improve the product quality in ajapanning-line[3].Moreover,intelligent systems for monitoring,control,and diagnosis of industries process are based on threemain approaches:knowledge-base,analytical and data-driven asmentioned in[4].Uraikul et al.provided an overview on intelligentsystems for control and diagnosis of process[4].Among several systems for process control and fault detectionhave been proposed,depending on the type of process,the qualitycontrol is different.The process control is more difficult inchemical process because of their irreversible nature.The productis completely wasted,if the process is out of control.Manytechnological methods in cement process quality control auto-mation have been proposed in recent years.Most of thesemethods are about X-ray analysis at the different departments ofcement production line.They focused on the control of thechemistry of cement production[5–7].Apart from chemistry ofthe cement,Tsamatsoulis provided a reliable model of thedynamics among the chemical modules in the outlet of raw mealgrinding systems in[8].Also,he has developed a dynamical modelof cement milling process in[9].In these two works,eachdepartment is assessed separately.The whole plant has not beenconsidered.In cement process,an integrated system for control-ling the quality of process has received less attention.Along withthe nature of the cement process,monitoring and interactionamong departments are important too.A quality control systemthat monitors the process,controls the input and output ofdifferent departments,and detects fault conditions in cementindustries complex is an issue.Computers in Industry64(2013)290–298A R T I C L E I N F OArticle history:Received29April2011Received in revised form12October2012Accepted28November2012Available online3January2013Keywords:Multi-agent systemIntelligent monitoring and controlCement processA B S T R A C TIn cement plant,since all processes are chemical and irreversible,monitoring and control is a criticalfactor.If the process is not controlled at any stage,thefinal product can be damaged or lost.Thus,in suchenvironments,considering the quality of the product at each state is essential.Also,to control theprocess,communication among different parts of production line is essential.The wasted time inproduction line has a direct effect on process correction time and cement production performance.Here,a model of a new intelligent multi-agent quality control system(IMAQCS)for controlling the quality ofcement production processes is suggested.This model,using of rule-based artificial intelligencetechnique,concentrates on relationship between departments in cement production line to monitormulti-attribute quality factors.With the presence of agents for controlling the quality of cementprocesses,real-time analyzing and decision making in a fault condition will be provided.In order tovalidate the proposed model,IMAQCS is deployed in real plants of a cement industries complex in Iran.The ability of the system in the process production environment is assessed.The effectiveness andefficiency of the system are demonstrated by reducing the process correction time and increasing thecement production performance.Finally,this system can effectively impact on factory resources and costsaving.ß2012Elsevier B.V.All rights reserved.*Corresponding author.E-mail address:irajarash@(I.Mahdavi).Contents lists available at SciVerse ScienceDirectComputers in Industryj o ur n a l ho m e p a g e:w w w.e l s e vi e r.c om/l o c a t e/c o mp i n d0166-3615/$–see front matterß2012Elsevier B.V.All rights reserved./10.1016/pind.2012.11.005The control of plants that are spatially distributed has been considered recently.Chan presented a system that monitors operations at the plant based on the input data.Then it detected abnormalities in the data and suggested some actions to the operator.It was an expert decision support system for monitoring, control and diagnosis of a petroleum production and separation plant[10].Mahdavi et al.suggested a real-time quality control information system that improves control of the quality of products through an integrated monitoring of distributed shops [11].Van Brussel et al.presented the architecture consists of three types of basic holons:order holons,product holons,and resource holons to reduce the complexity of the system and enable easy reconfiguration[12].However,multi-agent systems(MASs)can be used to control the plant,and especially the control of process in distributed manufacturing.Seilonen et al.utilized MAS to design a process automation system.They applied agents to run supervi-sory control and make decisions[13].A large number of researches on distributed manufacturing and MAS in industries focus on scheduling and planning tasks among different machines for optimizing their throughput[14–18].Some other works on MAS are done in the area of supply chain management(SCM)systems [19].A review of all related work to agent-based systems in manufacturing is provided in[20].In addition,some other researchers have proposed different models of MAS and deployed them in manufacturing[18,21–24].Finally,Behdani et al.in[25] proposed an agent-based system for modeling a complex network of a chemical manufacturing enterprise which can capture the interactions among the various constituents including the plants, functional departments,and external entities.Among the researches that have been referred to,the use of MAS to cope with the control of chemical process quality among different parts of plants has been less noticed.In this paper,we proposed an automated process quality control system for cement process that is designed based on multi-agent system.In our proposed model,we try to concentrate on the communication between sampling station,laboratory and differ-ent departments of the cement production process which are not extensively described in previous researches.Also,we transform statistical quality control into a new communication method for cement production.We found MAS technology to cope with sophisticated interaction among departments.Besides,we com-pare a manual system with our system in a part of cement plant to evaluate the model.With this method,we were able to reduce the time of correcting the process.This reduction in process correction time is lead to reduce wasted raw materials and has thefinancial impact for the factory.The other parts of this paper are organized as follows:Section2 gives an overview of problem domain.Our proposed model is presented in Section3.In this section,agents in the system,their interaction and coordination approach,analysis and design method and implementation technique are explained.Next,in Section4the proposed system has been tested and evaluated. Finally,conclusions and future work are provided in Section5.2.Problem statementThe quality of processes and products has become a major decision factor in most businesses,because consumers expect quality to be considered of equal importance as cost and schedule. Online statistical process control is a powerful tool for achieving process stability and improving quality.Monitoring the conditions of the processes and investigating their capability in the shortest time,can result in optimal use of resources.Therefore,for inspecting process quality in shortest time,an intelligent distributed quality control system,which is deployed at the whole factory,is an essential necessity.In this research,we focused on chemical process control, because of its nature and special properties.These kinds of processes are chemical,and in such environments,the monitoring and control are important issues.Similarly,in a cement industries complex,the control of cement processes is a critical factor.Our studies on the problem show that in cement production,there should be quick ways of communication among various depart-ments and continuous monitoring on output of each state.As shown in Fig.1,cement production has several inner departments.At the end of each department,there is a sampling station.Conveyor transports samples,which are taken from sampling stations,to the laboratory.These samples are analyzed to test process quality.Then,tests on samples determine the values of quality indicators.Afterwards,quality control engineersCrasCement mil lFig.1.Cement production process.I.Mahdavi et al./Computers in Industry64(2013)290–298291investigate these values and send them to the production experts.Next,the production experts decide on the acceptability of the output of the ter,if necessary,the production experts dispatch essential instructions to the departments.Finally,according to instruction and conditions of each department,crashed materials are put into the stock pile or raw mill department or kiln settings are changed in controlling room.Thus,the next iteration of cement production process is improved as possible.By reviewing all stages in controlling cement processes,we realize that there is a delay in the communication among quality control unit (laboratory and engineers)and departments.Conse-quently,in emergency conditions there will be a delay in process correction of departments.This delay may lead to some problems such as sever fluctuations in production process,unstable state of production conditions,and finally an increase in the rate of undesirable products.Three important measures including lime saturation factor (LSF),silica modulus (SIM),and alumina modulus (ALM)are considered to control the quality of cement process.The larger value of SIM,LSF and ALM in the clinker indicates that cement production has insufficient quality.These measures would be obtained by Eqs.(1)–(3).SIM ¼SiO 2Al 2O 3þFe 2O 3(1)ALM ¼Al 2O 3Fe 2O 3(2)LSF ¼100CaO2:8SiO 2þ1:1Al 2O 3þ0:7Fe 2O 3(3)3.The proposed IMAQCS architectureThe proposed model of the current study is based on three-layer architecture.As shown in Fig.2,in the presentation layer,users,with little knowledge about the mechanism of the system,can access application via the designed user interfaces.In fact,this layer is an interface for executing quality tools that are designed by experts.In addition,in the presentation layer all subsystems in the plant are covered by designing interfaces to execute quality control tools and receive essential instructions.This is the outer layer that is used by workers in the production line.In the business logic layer,analysis of quality test results and decision-makings are done.This layer,receives the result of quality tests from presentation layer via messages,and then analyzes them for control processes.In this layer,the control of raw data and quality of process,quality analysis and decision making for improving process are done.Finally,in database access layer,there are database and knowledgebase.In database some data such as raw data (values of measurements that are sampled from stations);messages information,test and analysis result,and other information are stored.In knowledgebase quality control rules,domain ontology,data acceptance rules and decision rules are stored.3.1.Agents in IMAQCSAgents used in this system are software agents,which are developed as software applications.In this architecture,we define six types of agents:Quality Control Tools Executor Agent (QCTEA),Process Quality Control Analyzer Agent (PQCA),Internal Decision Maker Agent (IDMA),External Decision Maker Agent (EDMA),Data Base Manager Agent (DBMA)and Knowledge Base Manager Agent (KBMA).The duties of each agent are expressed in details in the following:Quality Control Tools Executor Agent (QCTEA):this agent can be deployed in different departments of a plant.QCTEA,including its departments,is responsible for executing quality control tools such as capability six-pack,capability analysis,control charts (X-bar and R,X-bar chart,S-bar chart and etc.)and symmetry plot.Quality experts determine quality control tools suitable for each department according to the condition of departments,input data type,and importance of checking quality.These tools are used in the design ofQCTEAs.Fig.2.Architecture of IMAQCS based on three layer architecture.Table 1Some data acceptance rules.Rule #Data acceptance ruleRule #Data acceptance rule1(88.6 LSF 92.6)5(s (LSF) 0.1)2(2.5 SIM 2.75)6(s (SIM) 0.1)3(1.3 ALM 2.5)7(s (ALM) 0.1)4(s (CaCo 3) 0.2)8(s (CaO) 0.1)I.Mahdavi et al./Computers in Industry 64(2013)290–298292Process Quality Control Analyzer Agent (PQCA):these agents have a one to one relation with QCTEAs.Each PQCA receives quality results from the related QCTEA.At first,experts define some available rules of control conditions.PQCA receives required rules and knowledge from KBMA.Then PQCA analyzes data according to its knowledge.This data comes from two main categories:the first group of data is raw data,and the second group is results of running quality tools.In the first step,PQCA evaluates all raw data limitations.This way,it checks some data acceptance rules that are actually constraints.Some samples of these rules are shown in Table 1.After that,if raw data is correct,PQCA allows QCTEA to run the required quality control graphs such as capability six-pack and X-bar and R charts.Otherwise PQCA informs IDMA.The second task of PQCA is assessing the results of running charts.Rules that have been received from KBMA here are used.For instance Table 2shows some quality control rules.In both situations,if the rules or constraints are been violated,PQCA informs IDMA.Internal Decision Maker Agent (IDMA):for each department,there is one IDMA.At first PQCAs check the control conditions or quality rules of the processes and send results to IDMA if they are not valid.Then,IDMA searches decision rules according to results received from PQCAs,quality standards priorities,input data types,rules that are used by PQCA and other conditions.IDMA completes its knowledge of decision rules with the help of KBMA.After that,if the decision rule is covered,IDMA sets instructions based on the rule.Finally,IDMA sends the instructions as messages to IDMA,which is deployed in the previous department.We show the internal activity of IDMA in Fig.3.As we show in this figure,if IDMA does not find associated rule,the system will declare state of emergency.In such a case,the experts will decide then add this circumstance to the knowledge base.We generate 42decision rules that are related to stock pile,raw mill,raw material silo and clinker cooler departments.Examples of these rules are expressed in Table 3.External Decision Maker Agent (EDMA):there is one EDMA for all departments in a plant.This agent receives all decisions of IDMAs and certain conditions in which the decision has been taken.In addition EDMA considers the functionality of each department.Then according to the conditions and control limitations,which are determined for each department,EDMA analyzes these measurements and plans a long term solution.To do this,EDMA gets help from KBMA.After that,EDMA sends required instructions to the departments.EDMA uses TOPSIS algorithm as a base of making a long term plan for departments.Each department also has a technical characteristic matrix.These matrices and the attributes of the output of each department are used in TOPSIS algorithm [26]for making decision.Data Base Manager Agent (DBMA):in the proposed IMAQCS,there is one DBMA for each department.To maintain the security of access to the database,we define DBMA.Only DBMA has direct access to the database.In fact,this agent is a mediator between database and other agents.This agent is responsible to manage the database and serves other agents’requests.In the database,there are tables that store raw data,test results,messages and some other information;DBMAs manage these tables.Other agents in IMAQCS access these data through DBMAs.Knowledge Base Manager Agent (KBMA):in our proposed IMAQCS,there is one KBMA in a department.At first experts,define required rules,knowledge,and standards in knowl-edgebase.KBMAs manage tables that exist in the knowledge-base.Other agents in IMAQCS access knowledgebase through KBMAs.Table 2Examples of quality control rules.Rule #Quality control rules1If there are K points more than 3standard deviations from center line then data is not valid2If K points out of k +1points greater than 2standard deviations from center line then data is notvalidFig.3.The internal activity of IDMA.Table 3Some decision rules.Rule #Decision rules1IF NOT between(LSF,88.6,92.6)AND greater than(LSF,92.6)THEN DecCaO2IF NOT between (SigLSF,0,0.1)AND greater than (SigLSF,0.1)THEN SamplesNotOk,resample3IF greater than (BrnFct,120)THEN IncKilnTemperatureTable 4Value rules elements.Elements ValueP {p 1,...,p n }is a set of value rules S {s 1,...,s n }is a set of statesA{a 1,...,a k }is a set of joint actions of k agentsI.Mahdavi et al./Computers in Industry 64(2013)290–2982933.2.Agents coordinationAccording to cement production process,IMAQCS should monitor and control production processes quality through different departments.Thereby,agents need to interact with each other among department.To control the interactions between departments and perform the optimal action,it should be considered a coordination mechanism.We use a context-specific coordination graph to represent the coordination and dependen-cies among agents [27].We define set of value rules.Each value rule has a current state and some joint actions which have value.In fact a value rule p =h s ^a :v i shows that rule value is equal to v when the current state is s and the agents perform the joint action a .We define value rule elements that are shown in Table 4.In addition we use role-based context-specific Q-learning method according to [28]to learn the optimal policy.A role is a tuple h m ,P m ,r i ,m i ,where m 2M is the identity of a rule;P m is a set of value rules associated with the role m and r i ,m is a potential function which determines how appropriate the agent i is for the role m in the current state.Based on this method we first definevalue rules for each role then we assign roles to the agents [28].In IMAQCS we define roles,actions and states as reported in Table 5.We generate value rules in the coordination graph.Table 6shows our generated value rules.Fig.4shows a part of the coordination graph in IMAQCS.Some of rules that are expressed above are shown on the coordination graph.The coordination algorithm is applied for each iteration or run.The coordination structure between agents depends on the current state of the system and a set of actions that is defined.So in each iteration,agents use predefined actions to interact with others.More,when the number of agents increases,the joint action space grows exponentially.We use Role-based context-specific Q-learning (RQ-learning)algorithm that is introduced in [28]to reduce the joint action space.With the help of this algorithm role assignment is performed first,and then variable elimination (VE)is used to determine the optimal joint action.In this way,we could run IMAQCS in the shortest possible time without doing any extra action.3.3.Analysis and design IMAQCSThere are some methodologies for the development of multi-agent systems including [29–34].Also,methodologies that are mentioned above are based on agent oriented methodologies and their analysis phase is generic in nature,they attempt to adapt object-oriented analysis and design methodologies to agent-basedTable 5Value rules elements.ValueRoles M ={executor,analyzer,decision maker,data manager}ActionsA ={run-charts,check-limitations,check-result,get-data,get-constraint,analyze-data,run-decision-algorithm,set-instructions}StatesS ={stable,invalid data,unstable,emergency}Table 6Some value rules.#Value rules1h (P 1)analyzer ;stable ^a 1=check-limitations(raw-data)^a 2=get-data(data-id):v 1i2h (P 2)analyzer ;stable ^a 1=check-result(results)^a 3=get-constraint():v 2i3h (P 3)analyzer ;stable ^a 1=analyze-data()^a 4=run-charts():v 3i4h (P 4)executor ;stable ^a 4=run-charts():v 4i5h (P 5)decision maker ;unstable ^a 3=get-constraint()^a 5=run-decision-algorithm():v 5i6h (P 6)decision maker ;emergency ^a 5=set-instructions():v 6ia 3:v 2)a 5:v 5)(a 5:v 6)(a 1∧(a 1∧ a 4:v 3)(a 4:v 4)Fig.4.A part of the coordination graph for five agents in IMAQCS.Fig.5.Agent diagram.I.Mahdavi et al./Computers in Industry 64(2013)290–298294design[34].So,we use the methodology that proposed in[34].The selected methodology is formalized for the analysis and design phases of the agent-based software development life cycle using JADE platform.This methodology focuses on agents specifically and the abstractions provided by the agent paradigm.It combines a top-down and bottom-up approach so that both existing system capabilities and the applications overall needs can be accounted for [34].We model agent diagram for IMAQCS as shown in Fig.5.In this diagram the actual agent types are represented by circles.People that must interact with the system are represented by the UML actor symbol.External systems that must interact with the system under development are represented by rectangles.It can be observed that in this model there are two external systems associated with the IMAQCS;sampling system that samples the output of each department and laboratory system which identifies the chemical compositions of materials.In order to clarify the responsibilities of each agent,we provide the responsibility table for all agents in IMAQCS.Table7shows the responsibility table for PQCA as an example.3.4.Agent communicationAgent communication is a form of interaction which expresses relationship among agents.Here we consider the role of communication as sending messages from sender to receiver. The content of message is encoded by sender with the help of languages which will be decoded by receiver.In this paper we use FIPA Agent Communication specifications1that deal with Agent Communication Language(ACL)messages,2message exchange interaction protocols and content language representations.We use FIPA SL content language3which is a human-readable string-encoded content language.To continue our design,we determine the interaction protocols for all responsibilities of each agent that are related to another agent.Table8shows how the interaction table might look for the PQCA.AS we have mentioned above,we use FIPA interaction protocols4for the relation among agents in the IMAQCS.3.5.Agents implementationIn this paper we use JADE(Java Agent Development frame work)as an agent design platform.JADE is a software framework that simplifies the implementation of multi-agent systems.In addition to the design of ontology,we use Prote´ge´[35].This tool is suitable for constructing ontology.Moreover,we use Jess Tab which is a rule engine for the Java platform to produce our rules in the knowledge base.Fig.6is a sample of rule in the Prote´ge´with the help of Jess Tab.To create and use ontology,we use Bean Generator on Prote´ge´environment.With this plug-in,domain ontology is exported to Java Class.As mentioned previously,in this research,we use ACL message format and FIPA SL content language.Fig.7is a sample of our message content.In this example,PQCA sends a message to QCTEA using‘‘CEMENT_ONTOLOGY’’that run process capability chart and set the results into variables.4.Experiment and validation IMAQCSIn this study,an agent-based model for controlling quality of process is proposed.We generate42rules for the stock pile,raw mill,raw material silo and clinker cooler departments.These rules are produced according to DAG(Directed Acyclic Graph).In these departments,the product has not yet formed in cement.The quality rules for the cement are different from the quality rules of cement process and it is not the scope of our work.The rule-base coverage measures[36]were applied to check that defined rules are covered any situation.So,we have not observed any uncovered condition during tests.To evaluate the performance of IMAQCS,we have deployed IMAQCS in real plants and assessed the effectiveness and efficiency of our model on the cement process.Experimentally,IMAQCS hasTable7The responsibility table for PQCA.Agent type#ResponsibilitiesPQCA1Receives notification of fetching rawdata from QCTEA.2Requests data from DBMA.3Tests the control limitation of data associatedwith its embedded knowledge.4Orders QCTEA to execute charts if the rawdata is within an acceptable region.5Receives notification of executing qualitycontrol charts from QCTEA.6Evaluates results of quality control charts basedon its embedded knowledge.7Requests additional rules from KBMA if are required.8Receives notification of instructions from IDMA.9Orders QCTEA to do new instruction.Table8The interaction protocols for PQCA.Responsibility#IP(interactionprotocol)Role(responder/initiator)With1FIPA Request IP R QCTEA 2FIPA Query IP(Query-ref)I DBMA 4FIPA Request IP I QCTEA 7FIPA Query IP(Query-ref)I KBMA 8FIPA Request IP R IDMA9FIPA Request IP I QCTEA(request :sender(agent-identifier :name PQCA@192.168.1.2:1099):receiver(set(agent-identifier :name QCTEA@192.168.1.3:1099)):comm unicative act request:cont ent""((action(agent-identifier :name QCTEA@192.168.1.2:1099)( (run_charts(data_id));(set-result(PROCESS-CAPABILITY_TEST_REQ : LSL ?lsl: SAMPLE_MEAN ?sample_mean:S TDEV ?stdev)) ))"":language FI PA-SL:ont ology CEMENT_ON TOLOGY:pr otocol FIPA Request:reply-with query2)Fig.7.An example of message exchange between PQCA and QCTEA.(De frule CHECK_BURNING_TE MPERATURE(Obj ect (is-a CLINK ER)(BURNING_FACTOR_VA LUE? BF& :(< =? BF 120)| (>=? BF 126))) ?f<-(obj ect (is-a CEMENT_EMERGENCY_CONDITION))=> (slot-set? f EMERGENCY_TYPE_NAME "burning factor"))Fig.6.Rule definition in the Jess Tab.1Foundation for Intelligent Physical Agents.2FIPA ACL message structure specification,Document number:XC00061D.3FIPA SL content language specification,Document number:XC00008G.4FIPA modeling,interaction diagrams,Document number:TBA.I.Mahdavi et al./Computers in Industry64(2013)290–298295。

Technical Information TI 079F/00/en Operating Instructions 017293-1000ApplicationsThe HAA 420 Z isolator allows sensors to be mounted in explosion hazardous areas, Zone 0, if a transmitter •Silometer FMC 420,•Silometer FMC 423 or •Silometer FMC 425is used to evaluate the signal.The input is electrically isolated from all other circuits.Sensors and transmitters for connecting are:•Capacitive probes with the electronic insert EC 37 Z or EC 47 Z•Deltapilot DB pressure transmitters with the electronic insert EB 17 Z or EB 27 Z.Features and Benefits•In compact Minipac housing ideal for mounting in the control cabinet •Transmitters can be row-mounted on a 35 mm standard rail•Removable terminal blocks make wiring easy•For mounting in the open with protective housing IP 55•Adjusters behind the fold-down front panel. Easily accessible but protected against unauthorised use.•Symbols showing calibration steps on the rear of the front panel allow set-up without operating manual.System Components Isolator HAA 420 ZElectrical isolation between intrinsically safe electronic inserts with PFM output and transmitters with analogue signal inputIsolator HAA 420 Z in Minipac row housing for snap-on mounting on a 35 mm standard rail.Hauser+EndressNothing beats know-howOperating PrincipleElectrical ConnectionOperating PrincipleThe HAA 420 Z supplies DC power to the EC … Z or EB … Z electronic insert,which returns a pulse frequencymodulated (PFM) signal proportional to level along the same line.The pulses are converted by a current generator into a level proportional DC current which is available at the input of the FMC … transmitter.The HAA 420 Z provides greater safety •Pulse width detection to eliminate interference pulses in the PFM signal,•Error message to indicate fault in the PFM signal •Standby signalElectrical IsolationThe input is electrically isolated from all other circuits:•Power via the isolation transformer •Pulse signal via the optocoupler Its EEx ia IIC intrinsic safety enables the connected sensor to be used in explosion hazardous area Zone 0.Isolation of CircuitsThe terminal block for the power supply and Silometer FMC connection issituated in the lower section of the front panel.The terminal block for connecting intrinsically safe cables to thesensor/transmitter is situated in the upper section of the front panel. This maintains the minimum distance required between intrinsically and non-intrinsically safe circuits.Safe areaItPFMItAnalogue It Analogue standardisedPower supplyPower supplyHAA 420 ZFMC153642Explosion hazardous area Ex Zone 0Measuring system Capacitive probe with electronic insert EC 37 Z or EC 47 Z or the Deltapilot DB pressure sensorwith electronic insert EB 17 Z or EB 27 Z Interference-immune PFM signaltransmission along two-wire cabling,intrinsically safe,EEx ia IICIsolator HAA 420 Z Analogue signal transmissionapprox. 0 … 4 mA to transmitterLevel measurement transmitterFMC 420, FMC 423 or FMC 425Standard analogue 0/4 ... 20 mA, 0 ... 10 V output signalss32Sensor/electronic insert:electronic insert EB 17 Z,EB 27 Z in a Deltapilot pressure transmitter orelectronic insertEC 37 Z or EC 47 Z in a capacitive probeExplosion hazardous area Safe areaPower supplySilometer transmitters FMC 420, FMC 423FMC 425Isolator HAA 420 Z20 VElectrical connection to sensors/electronicinserts, transmitters and power supply2AdjustmentsConstructionHousing: Row housing (Minipac format)in light grey plastic, front panel blue Mounting: on standard rail to EN 500022-35 x 7.5 or EN 50022-35 x 15Weight: approx. 0.3 kg Protection to DIN 40050:Housing IP 40, Terminals IP 20Permissible Ambient Temperatures Single mounting:– 20°C … +60°C ( 0...140°F )Row mounting (no gap):– 20°C ... +40°C ( 0...100°F )Storage temperature: – 25°C …+85°CElectrical ConnectionTerminals: removable terminal blocks,non-interchangeable, black, 6-pole,7-poleMax. terminal diameter: (fine-wire)1 x 0.5 mm 2 to 1 x 2.5 mm 2 or 2 x 0.5 mm 2 to 2 x 1.5 mm 2Power supply, AC:220 V , – 10% ... 230 V + 10%,240 V , 127 V , 115 V , 110 V , 48 V , 42 V , 24 V , each +15%, – 10%, 50/60 Hz 100 V , ±10%, 50/60 HzPower consumption max. 3.5 W (4.4 VA)Connecting cable to sensor:2-wire, max. 25 Ω per wire Connecting cable transmitter:3-wire, max. 25 Ω per wireInput signals: PFMPulse width: approx. 100 µs Frequency:approx. 550 Hz to 2.8 kHz in Range I,approx. 55 Hz ... 2.8 kHz in Range II Current: approx. 5 mA, superimposed on base currentOutput signals: analogueCurrent approx. 0.04 … 1.5 mA(= approx. 30 pF … 350 pF) in Range I;approx. 0.04 … 4.0 mA(= approx. 30 pF … 4350 pF) in Range IISubject to modificationTechnical Data100 mm = 3.94 in 1 in = 25.4 mmDimensions in mm of the HAA 420 Z isolator in Minipac formatWidth of housing: 50 mm Rail mounting 35 x 7.5 or 35 x 15Maintain minimum distance from above and below to next row of instruments: min. 50 mm distance when using probes in explosion hazardous areasmin. 25 mm distance when using probes in safe areas.screwdriverOpen front panelIndication•The green ,,standby“ LED lights up when a power supply is present.•The red ,,fault“ LED lights up if no PFM signal is received.The ,,fault“ mode can be simulated by short-circuiting Terminals 7 and 8.Select hook switch position,,Pulse width detection“Red LED ,,Fault“,,Electronic insert“Green LED ,,standby“,,On“whenconnected to EC 37 Z,EC 47 Z,,Off“whenconnected to EB 17 Z,EB 27 ZEC 37 Z, EC 47 Z, Range I withoutJumper 4/5 in insert EC 37 Z, EC 47 Z, Range II with Jumper 4/5and with EB 17/27 Z3Mounting accessory for Minipac transmitters,Technical Information TI 009F/00/eProduct designation for HAA 420 Z Accessories, e.g. standard rail or protective housingProduct StructureDetailsWhen OrderingAccessories:protective housing in plastic for Minipac transmitters.Protection IP 55.HAA 420 Z IsolatorCertificates, ApprovalsA [EEx ia] IICVersion0Minipac housing 50 mm (2 in), with terminal strip 9OthersPower SupplyJ AC 240 V , 50/60 HzA AC 220 V (230 V), 50/60 Hz G AC 127 V , 50/60 Hz F AC 115 V , 50/60 HzB AC 110 V , 50/60 Hz L AC 100 V , 50/60 Hz C AC 48 V , 50/60 Hz K AC 42 V , 50/60 HzD AC 24 V , 50/60 Hz Y OthersHAA 420 Z –Product designationSupplementary DocumentationA TI 079 F/00/en/09.94a 017293-1000EHF/CV4.208.93/MTMEndress +Hauser GmbH+Co.Instruments International P .O. Box 2222D-79574 Weil am Rhein GermanyTel. (07621) 975-02Tx 773926Fax (07621) 975345Hauser+Endress Nothing beats know-how。