Tunnelling of topological line defects in strongly coupled superfluids
- 格式:pdf
- 大小:663.29 KB
- 文档页数:51
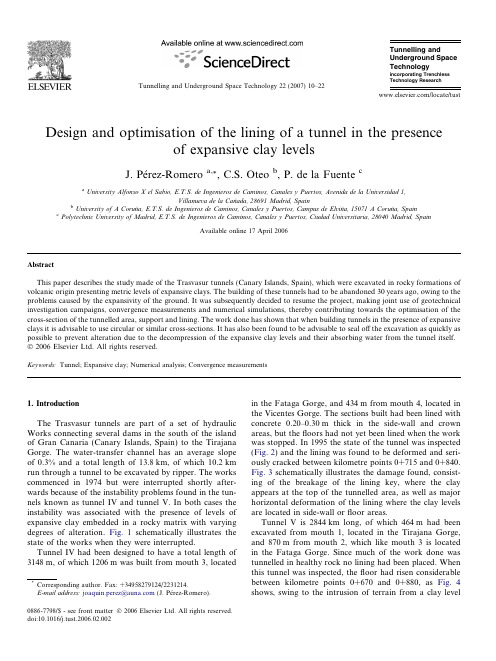
Design and optimisation of the lining of a tunnel in the presenceof expansive clay levelsJ.Pe´rez-Romero a,*,C.S.Oteo b ,P.de la FuentecaUniversity Alfonso X el Sabio,E.T.S.de Ingenieros de Caminos,Canales y Puertos,Avenida de la Universidad 1,Villanueva de la Can ˜ada,28691Madrid,SpainbUniversity of A Corun ˜a,E.T.S.de Ingenieros de Caminos,Canales y Puertos,Campus de Elvin ˜a,15071A Corun ˜a,SpaincPolytechnic University of Madrid,E.T.S.de Ingenieros de Caminos,Canales y Puertos,Ciudad Universitaria,28040Madrid,SpainAvailable online 17April 2006AbstractThis paper describes the study made of the Trasvasur tunnels (Canary Islands,Spain),which were excavated in rocky formations of volcanic origin presenting metric levels of expansive clays.The building of these tunnels had to be abandoned 30years ago,owing to the problems caused by the expansivity of the ground.It was subsequently decided to resume the project,making joint use of geotechnical investigation campaigns,convergence measurements and numerical simulations,thereby contributing towards the optimisation of the cross-section of the tunnelled area,support and lining.The work done has shown that when building tunnels in the presence of expansive clays it is advisable to use circular or similar cross-sections.It has also been found to be advisable to seal offthe excavation as quickly as possible to prevent alteration due to the decompression of the expansive clay levels and their absorbing water from the tunnel itself.Ó2006Elsevier Ltd.All rights reserved.Keywords:Tunnel;Expansive clay;Numerical analysis;Convergence measurements1.IntroductionThe Trasvasur tunnels are part of a set of hydraulic Works connecting several dams in the south of the island of Gran Canaria (Canary Islands,Spain)to the Tirajana Gorge.The water-transfer channel has an average slope of 0.3%and a total length of 13.8km,of which 10.2km run through a tunnel to be excavated by ripper.The works commenced in 1974but were interrupted shortly after-wards because of the instability problems found in the tun-nels known as tunnel IV and tunnel V.In both cases the instability was associated with the presence of levels of expansive clay embedded in a rocky matrix with varying degrees of alteration.Fig.1schematically illustrates the state of the works when they were interrupted.Tunnel IV had been designed to have a total length of 3148m,of which 1206m was built from mouth 3,locatedin the Fataga Gorge,and 434m from mouth 4,located inthe Vicentes Gorge.The sections built had been lined with concrete 0.20–0.30m thick in the side-wall and crown areas,but the floors had not yet been lined when the work was stopped.In 1995the state of the tunnel was inspected (Fig.2)and the lining was found to be deformed and seri-ously cracked between kilometre points 0+715and 0+840.Fig.3schematically illustrates the damage found,consist-ing of the breakage of the lining key,where the clay appears at the top of the tunnelled area,as well as major horizontal deformation of the lining where the clay levels are located in side-wall or floor areas.Tunnel V is 2844km long,of which 464m had been excavated from mouth 1,located in the Tirajana Gorge,and 870m from mouth 2,which like mouth 3is located in the Fataga Gorge.Since much of the work done was tunnelled in healthy rock no lining had been placed.When this tunnel was inspected,the floor had risen considerable between kilometre points 0+670and 0+880,as Fig.4shows,swing to the intrusion of terrain from a clay level0886-7798/$-see front matter Ó2006Elsevier Ltd.All rights reserved.doi:10.1016/j.tust.2006.02.002*Corresponding author.Fax:+34958279124/2231214.E-mail address:joaquin.perez@ (J.Pe´rez-Romero)./locate/tustTunnelling and Underground Space Technology 22(2007)10–22Tunnelling andUnderground Space Technologyincorporating Trenchless Technology Researchthat was located in the lower part of the tunnelled section (Fig.5).The project was resumed about 25years later,with a view to completing these tunnels.A total of six different sections were designed,to be supported by grout 0.05–0.20m thick,bolts injected with resin and arcwelded mesh.The interior housed a ‘‘U’’-shaped reinforcedconcretechannel,as shown in Fig.6.2.Geological framingFig.7shows the geological profile of tunnels IV and V,indicating the sections tunnelled before the Works were abandoned in 1974.The base level in the area consists of sub-horizontal lay-ers of ignimbrites composed of pyroclastic fragments of sand and silt embedded in a clay matrix (Fig.8c).In some levels the clay fraction is clearly dominant,and smectite concentrations of over 90%have been detected (mainly montmorillonite and Na-montmorillonite).Above the ignimbrites phonolitic lava flows are found (Astudillo et al.,1994),consisting of latites and quartzla-tites with the usual hypocrystalline,phaneritic,porphyritic and vesicular flow structure (Fig.8b).Expansive clay levels of volcanic tuffs have been identified,of decimetric and even metric thickness,located between the phonolitic (Fig.8a).Finally,in the more superficial areascolluvialFig.2.State of tunnel IV in1995.J.Pe ´rez-Romero et al./Tunnelling and Underground Space Technology 22(2007)10–2211and eluvial levels appear,resulting from the disturbance ofthe underlying formations.The route of tunnels IV and V passes through all the materials mentioned above.Specifically,the route of tunnel V is located in a thick formation of ignimbrites containing a highly plastic and expansive clay level located both in the side-wall area and beneath the floor of the tunnel section,whereas tunnel IV mostly passes through phonolites with the presence of a significant subhorizontal level of volcanic tuffs,which are also expansive and highly plastic,up to2.50m thick,appearing above the tunnel crown and descending below the floor.There is a clear link between the presence of these highly plastic expansive clay levels and the pathologies described above that forced the works to beabandoned.Fig.4.State of tunnel V in1995.12J.Pe´rez-Romero et al./Tunnelling and Underground Space Technology 22(2007)10–223.Geotechnical characterisation of the materialsIn 1995a new construction firm (Dragados)began towork on the completion of tunnels IV and V.A number of geotechnical research studies were commissioned from the consulting firm Intensa-Inarsa,in order to design solu-tions for the expansive clay areas.In this section the prospecting work and laboratory tests that were carried out,mostly to characterise the compress-ibility properties,expansive potential and structure of the clay levels that had affected and damaged tunnels IV and V,are described.In areas presenting the most serious expansivity problems,six rotating boreholes with continu-ous core-sample recovery were drilled in the interior of tun-nels IV and V.The clay levels were found to be 0.10–2.50m thick.Laboratory tests were performed on nine paraffin sam-ples extracted form the boreholes,and on six samples obtained with a thin-wall sampler in superficial parts of the tunnelled areas.It should be clarified that by the time the sampling was done the tunnels had been abandoned for nearly 20years after they were first excavated,and they had sometimes been used as water-storage tanks,so the properties of the ground close to the tunnelling perimeter were affected by the consequent decompression and mois-ture changes.Table 1shows the results of the laboratory tests carried out on these samples.As can be seen,the samples taken near to the tunnelling perimeter (samples MA-1to MA-6)have a higher relative water content,generally presenting higher liquidity indices (LI),and a considerable lower dry density (c d );the degrees of saturation (Sr)of these samples are very high,sometimes approaching 100%.This demon-strates the intense alteration of the clay near the tunnelled areas,where it has undergone major tensional relaxation and an increase in moisture from the excavation itself.A further indication of the alteration that the clay had undergone can be found in the values for resistance to unconfined compression in the interior of the boreholes ranged between 400and 1200kPa,whereas the decom-pressed clay close to the tunnelled area presented values of around 30kPa.With regard to the expansive potential of the clay,swell-ing-pressure values were zero to highly variable,betweenJ.Pe ´rez-Romero et al./Tunnelling and Underground Space Technology 22(2007)10–2213180and 1600kPa,depending on the moisture content,while the values for free volumetric swelling during soaking exceeded 15%.In situations of semiconfinement,the volu-metric-swelling values ranged between 4.5%and 12.5%,which gives some idea of the major expansive potential of the clay levels.Six X-ray diffraction tests were performed,with very high smectite percentages being found,in general close to 90%,which are clearly related to the expansive nature of the formation.Finally,five oedometric tests were carried out,the results of which allow the structure of the clay and the manner in which it is altered by the decompression andswelling processes to be studied (Pe´rez-Romero et al.,2002).In Fig.9the deformation curves are presented in a representation plane with the standardised voids index (Iv,Burland,1990)compared with the effective vertical pressure (at logarithmic scale).The intrinsic compression line (ICL)and sedimentation compression line (SCL)pro-posed by Burland (1990)for clays have been indicated on this plane,as has the value for the effective vertical yield stress (r vy 0)for each test performed.Samples B ,C and D were taken from the interior of the boreholes,while the remaining two samples (F and H )are disturbed,having been taken from the tunnelling perimeter.As it can be seen,the behaviour of the samples largely depends on the site where they were taken.Thus,the samples from the tunnel-ling perimeter present a higher value for the standardised voids index (Iv),while for vertical-stress range applied,the samples from the interior of the boreholes are highly overconsolidated and also present somewhat higher values for effective vertical yield stress.In short,the evidence is clear that the conditions of depo-sition of these clays,possibly at high temperatures,have provided their structure with a fabric of particle bonds that play a decisive role in their mechanical behaviour.Considering all the data available,geotechnical parame-ters have been assigned for the clay levels and for the solid rock (Table 2).4.Results from the building of an experimental tunnel Once the properties of the expansive clays had been determined,the possibility of altering the cross-section of the project was studied,as shown in Fig.6,to which end a numerical analysis was performed on the interaction between the tunnel excavation and lining (Oteo et al.,1999).An elastic model of the terrain and two hypotheses for its expansivity were considered:the first with volumet-ric expansion of up to 2%throughout the tunnelling perim-eter,and the other incorporating the presence of an expansive horizontal layer 1.50m thick centred on the axis of the tunnel.The laws of bending moments and maximum stresses forecast were compared for three different cross-sections:the project crosssection (horseshoe/with a semi-Table 1Index properties for samples from tunnels IV and V Sample Prospect Tunnel Kilometre point Dry specificweight c d (kN/m 3)Percentage of fines (%)Water content in situ (%)LL (%)PL (%)PI (%)LI (%)Sr (%)USCS MI-1S2IV 0+82515.5999000–35ML MI-2S4IV 0+76012.097–1144470––CH MI-3S4IV 0+76012.910041374790À0.58CH MI-4S4IV 0+76013.299341295673À0.391MH MI-5S4IV 0+76015.5100241154867À0.492MH MI-6S6V 0+645–100–844836––MH MI-7S6V 0+645–100–864541––MH MI-8S6V 0+645–99–854837––MH MI-9S5V 0+67519.692–542331––CH MA-1–IV 0+82010.09164208441640.1100CH MA-2–IV 0+81410.29060198491490.1100CH MA-3–IV 0+80513.33621793841À0.457MH MA-4–V 0+68513.664277829490.077CH MA-5–V 0+69810.5945110345580.190MH MA-6–V0+70515.83025792851À0.198GC14J.Pe´rez-Romero et al./Tunnelling and Underground Space Technology 22(2007)10–22circular arch),a circular cross-section and an oval cross-section(Fig.10).The numerical analysis revealed that the project cross-section was not ideal,since it had to bear the highest bending moments,while the optimal possible behaviour was offered by the circular cross-section.It was not considered advisable to use the tunnel sec-tions that had been previously damaged,since working inside them would be too dangerous.The building of a bypass was proposed to avoid the affected sections,the axis of would lie at a distance of15m.This change in the hor-izontal route would not create any problems because the purpose of the tunnels was to house a water channel.It was decided to build an experimental tunnel that would provide enough information to allow the remainder of the Project to be undertaken with the necessary safe-guards.Fig.11shows the cross-section considered(‘‘SC’’) for the sections suffering from the presence of expansive clays.This cross-section has a circular inner perimeter,sup-ported by steel frames,Bernold sheets and a layer of sprayed concrete0.07m thick.The support base would be made of concrete that was reinforced immediately,inTable2Geotechnical parameters of the expansive clay levels and solid rockMaterial Symbol Parameter Units Value Expansive clay G s Specific weight of solid particles kN/m326.7K Permeability coefficient m/s1·10À8S3r /0Angle of shearing resistance°220K0Coefficient of earth pressure at rest–0.8LL Liquid limit%80e L Void ratio at liquid limit– 2.18CÃc Intrinsic compression index–0.5181C c Compression index–0.4CÃcC s Swelling index–0.1CÃc Solid rock c Unit weight of rock kN/m320E Young’s modulus MPa1500m Poisson’s coefficient–0.2ucs Unconfined compression strength MPa50J.Pe´rez-Romero et al./Tunnelling and Underground Space Technology22(2007)10–2215order to increase its horizontal rigidity.Finally,a concretelining would be fitted,working backwards,to obtain a sec-tion with a total thickness of un 0.30m.For part of the route (SC 0)it was decided not to place the final concrete lining,in order to enable the influence of the lining on the behaviour of the tunnelling area to be studied.Fig.12shows an alternative,less reinforced cross-section,which would be used for the first sections of the experimental tunnel to compare its behaviour with that of the previous ones (sections SC and SC 0).At the beginning of the experimental galleria two different cross-sections were used:cross-section IV,with a sprayed-concrete lining,and cross-section V,which was furtherreinforced with steel frames and Bernold sheets.Fig.13shows a plan of the experimental gallery,indicating the cross-sections used for each tunnel section (two new SC and SC 0cross-sections and two that were the same as those in project IV and V).Convergence measurements were taken in the experi-mental gallery,the results of which are presented in Fig.14.The behaviour of the complete section (SC)was satisfactory,since any deformation was stabilised as soon as the floor was reinforced,and the convergence values recorded were lower than 0.01m.However,in the other sections (IV,V and SC 0)deformation that increased over time was recorded,reaching 0.08m,which meant that the base had to be reinforced as the final stabilisation measure.5.Numerical and parametric analysis of the interaction between the tunnel excavation and the support 5.1.Description of the numerical analysisThe building of the experimental galleries demonstrated the feasibility of the solution and highlighted the difference between the behaviour of sections that had been reinforced to greater or lesser degrees.For these reasons a parametric study was carried out,based on numerical analysis,to determine the relative influence between the various differ-ent factors present in the project (Pe´rez-Romero,2000).The following variables were taken into account:A.Excavation cross-section:semicircular (Fig.15a),cir-cular (Fig.15b)and round arch (horseshoe –Fig.15c).B.Position of the expansive clay level:crown,side walls and floor.C.Thickness of the expansive clay level:1and 2m thick.D.Free volumetric swelling of the clay:0%(nonexpan-sive),2.5%and5.0%.16J.Pe´rez-Romero et al./Tunnelling and Underground Space Technology 22(2007)10–22E.Depth of the tunnel axis:18,30and50m.F.Lining:concrete perimeter lining0.30m thick(simi-lar to section SC in the experimental gallery),con-crete lining0.30m thick on the crown and side walls but not in thefloor area(similar to section SC0in the experimental gallery),andfinally concrete lining0.30m thick on thefloor and sprayed-concrete lining0.05m thick on the side walls and crown(sim-ilar to Section5of the experimental gallery).These variables were combined to generate a total of28 different scenarios,named according to the nomenclature given in Table3.Fig.16shows thefinite-element mesh used for the calculations.The constitutive model used for the calculation was that of a partially saturated soil.The clay levels were described by a critical-state model(modified Cam-clay)and the solid rock was simulated by means of an elastic model.For both materials the parameters deduced from the laboratory tests shown in Table2were used.Once a geostatic stress state in equilibrium had been obtained,the elements corresponding to the excavation cross-section were eliminated,such that the normal pressure at the limit of the excavation was can-celled.A boundary condition was later imposed for zero suction on the perimeter of the excavation,starting a pro-cess of saturation on the ground that progressed inwards.A certain time after the excavation the lining was placed, at which time an impermeable perimeter of the tunnelled area was obtained.5.2.Behaviour of the tunnelled areaIt is interesting to note the tenso-deformational behav-iour of the ground near the tunnelled area.A good case in point is the one called‘‘cs28t’’,consisting of a circular excavation with an expansive level(tuffs)2m thick located at the level of the axis(Fig.17).The lining corresponds to a thickness of0.30m of concrete for the entire perimeter of the tunnelled area(Fig.15b).J.Pe´rez-Romero et al./Tunnelling and Underground Space Technology22(2007)10–2217Fig.18shows the changes in the voids ratio (e )and the angular deformation (de )one hour,one day and one week after the excavation.The combined effect of the decom-pression of the material,the swelling because of expansivity and the proximity of the clay to a critical state generatesvolume increases of up to 4.5%and angular deformations of over 3%.Fig.19shows the stress–strain path of a point located in the expansive clay level (point A in Fig.17).The initial site conditions have been marked with a white dot.Owing to the excavation of the tunnel,point A describes an stress decompression path (using the Cambridge variables:p 0mean pressure,q deviatoric stress)that approaches the crit-ical-state line (Fig.19a),which explains the angular defor-mations estimated in the calculation and the creeping processes observed in 1995in the unsupported sections (Figs.4and 5).The volumetric change estimated (Fig.19b)has two parts:an initial section where the volume increases,associ-ated with the decompression of the clay,and another sec-tion where the volume also increases but as a result solely of its expansive potential.The first section is the result of the mechanical interaction between the excavation,the support and the lining,such that fewer deformations will occur in sections where the support is closed and thicker.The second section mentioned is related to the supply of moisture from inside the tunnelled area (which houses a water channel)and the expansive potential of the clay.These factors are favoured if the perimeter of the tunnelled area is not sealed off.Finally,the influence of the clay structure on its mechanical behaviour has been described above,with dia-genetic bonds between particles.The undisturbed samples were found to have a lower expansive potential than the samples taken from where the ground intrudes into the tun-nelled area,which are extremely disturbed and partially remoulded,affecting their diagenetic bonds.Thus,the decompression and swelling phenomena have a positive synergy effect,since the alteration of the clay implies greater expansive potential,which in turn leads to greater deformation of the clay structure,with the consequent destruction of bonds between particles.5.3.Parametric analysis of resultsTable 4shows the results of the 28cases analysed:max-imum stresses in the lining and estimated displacements on the crown,side walls and floor.Table 3Nomenclature of cases studied in parametric analysis 1st LetterTunnel sectiono ovoidal c circularh horseshoe –round arch 2nd LetterPosition of the swelling layer v vertex (crown)s sidewall f floor3rd LetterThickness and change in volume of the swelling layer11m thick –2.5%volume increase upon soaking 22m –2.5%n 2m –0%d 2m –5%4th LetterDepth of the tunnel axis 818m 330m 550m5th LetterLiningtconcrete perimeter lining 0.30m thick (similar to section SC in the experimental gallery)pconcrete lining 0.30m thick on the crown and side walls but not in the floor area (similar to section SC 0)gconcrete lining 0.30m thick on the floor and sprayed-concrete lining 0.05m thick on the side walls and crown (similar to sectionV)18J.Pe´rez-Romero et al./Tunnelling and Underground Space Technology 22(2007)10–22It is found that the most damaging position for a claylevel harmful is on the side walls,at the same height as the axis of the tunnel,since this is where the highest stresses in the lining are generated.Fig.20shows the bending moments estimated for the three sections of the tunnelled area.It is clear that the excavation planned in the building project (Fig.6)is the one that works the worst,while the section tested in the experimental gallery seems to be opti-mal (Fig.11),being subjected to the smallest bending moments.According to the results of the numerical analysis,the linings with grout 0.05m thick are subjected to veryhighFig.18.Deformations estimated in the proximity of the tunnelled area.J.Pe ´rez-Romero et al./Tunnelling and Underground Space Technology 22(2007)10–2219stresses,which is consistent with the behaviour observedin section SC 0of the experimental gallery,which had to be reinforced with 0.30m of concrete lining.It is advis-able for the lining to be applied to the entire perimeter of the tunnelled area in order to make the section water-tight and prevent the clay from continuing to absorb water.Finally,the results of the numerical analysis of sec-tions with concrete linings 0.30m thick enables conver-gences of 0.01–0.03m to be estimated,i.e.similar values to those for the convergences measured in the experimen-tal tunnel.Table 5summarises the relative importance of the fac-tors considered,among which the position of the expansive layer and its swelling potential,the cross-section of the tun-nelled area and the support and lining thickness particu-larly stand out.6.Optimisation of the lining during the course of the works Once the studies reported above had been carried out,the works commenced,using the cross-section design shown in Fig.11,with the following construction phases.Phase 1:1.1.Excavation in 1.40m advance sections.1.2.Fitting TH-21trusses.1.3.Fitting Bernold sheets welded to the trusswings.Table 4Summary of results for a series of different cases CASE Maximum stresses in the lining Estimated displacements Tensile (MPa)Compression (MPa)Downwards at crown (mm)Inwards at side walls (mm)Upwards at floor (mm)hv28t 0.38À0.56À23.4À4.0 2.0hs28t 12.33À10.97À6.2À22.7 2.3hf28t 2.68À3.70À1.4À2.618.7cvn8t 0.55À0.81À17.0À2.5 2.0cv28t 0.79À2.14À18.4À2.3 1.5cvd8t 1.42À3.63À20.0À2.0 1.3cv23t 0.86À2.18À13.4À2.2 2.0cv25t 1.33À2.55À13.7À2.2 2.8cs18t 6.95À4.78À6.0À23.6 2.7csn8t 1.10À1.03À12.3À19.9 2.8cs28t 11.99À11.13À6.3À25.3 2.2csd8t 18.73À17.76À1.8À29.8 1.7cs23t 16.97À15.54À6.2À20.2 2.6cfn8t 0.24À0.53À6.4À2.412.8cf28t 1.31À2.430.2À2.618.8cfd8t 1.98À4.01 5.0À2.723.9cf23t 2.94À4.559.0À2.423.3cf25t 4.35À6.0811.5À1.726.2ov28t 0.84À2.07À19.3À2.5 1.7os28t 11.61À9.92À7.6À26.9 2.5of28t 0.31À1.32À0.4À2.421.1cv28p 0.69À1.99À18.4À2.3 1.6cs28p 8.81À10.08À5.0À30.1 2.4cf28p 3.02À3.59 1.7À3.621.5hs28g 114.4À118.28À3.5À38.3 2.0cs18g 38.69À31.39À4.6À29.5 2.4cs28g 44.60À50.92À4.1À34.6 1.7os28g61.17À66.227.6À26.92.520J.Pe´rez-Romero et al./Tunnelling and Underground Space Technology 22(2007)10–221.4.Sprayed concrete on the batter side of the Bernoldsheets,0.07m thick.1.5.Fitting bolts,1.50m long,to the resin at the base ofthe trusses.1.6.Sprayed concrete with metal fibres on the Bernoldsheets,0.05cm thick.Phase 2:2.1.Fitting curved floor trusses between the verticaltrusses.2.2.Fitting the reinforcement grid for the batter and soffitof the inverted arch (5B 20/m as main reinforcement and 5B 12/m as distribution reinforcement).2.3.Backfilling with sprayed concrete until the desiredshape for the inverted arch is achieved,approxi-mately 0.30m thick.2.4.Concrete backfilling and track laying.Phase 3(working backwards):3.1.Fitting reinforcement to the soffit of the vertical walls(5B 20/m as main reinforcement and 5B 12/m as dis-tribution reinforcement).3.2.Formwork and concrete pouring for the vertical wallup to the theoretical thickness of 30cm,having previ-ously smoothed the joint between the inverted arch and vertical wall.Phase 4:4.1.Removal of the track.4.2.Concrete pouring for the channel slab.Once phases 1and 2had been completed a convergence measurement campaign was begun,from which the follow-ing results were obtained:in 40sections,the convergence measurement was between 0.6and 1mm,whereas in the remaining four sections the convergence measurements lay between 3and 4mm.Since these convergence measurements are lower than those obtained in the experimental gallery (Fig.14)and also lower than those deduced from the numerical calcula-tion (Table 4),a final numerical analysis was performed to optimise the cross-section of the lining that remained to be built.A retrospective analysis was carried out using an elas-tic model and assuming the presence of an expansive clay level up to 2.5m thick.The position of the clay level was made to coincide for each section with the observations made during the excavation of the tunnels,i.e.above the crown,at the height of the side walls or beneath the inverted arch.The convergence results of the numer-ical model matched the convergence values recorded on the site for a value for the maximum volumetric swelling of the clay of between 1.13%and 0.28%.These values are much lower than those recorded in the laboratory during the course of the preliminary research.This differ-ence shows that the latest execution procedure was opti-mal,principally because of the geometry of the tunnelled area,which was almost circular,and because the support was sealed immediately over the entire perimeter of the tunnelled area,which impeded the decompression of the clay levels and the absorption of water from the tun-nelitself.Table 5Relative importance of the factors considered FactorInfluence on the lining stresses Influence on the liningdisplacements Position of expansive clay layer Very high Very high Cross-section of the tunnelled area HighLow Thickness of expansive clay layer Moderate LowDepth of axisModerate Moderate Potential swelling of clay layer Extreme Moderate Support and lining thicknessExtremeLowJ.Pe ´rez-Romero et al./Tunnelling and Underground Space Technology 22(2007)10–2221。


第50卷第5期中南大学学报(自然科学版) V ol.50No.5 2019年5月Journal of Central South University (Science and Technology)May 2019 DOI: 10.11817/j.issn.1672−7207.2019.05.026渗透力对新奥法隧道掌子面稳定性的影响黄戡1,安永林2,3,岳健2,3,曾贤臣3,李佳豪3,张艺杰1,王栋1(1. 长沙理工大学土木工程学院,湖南长沙,410114;2. 湖南科技大学岩土工程稳定控制与健康监测湖南省重点实验室,湖南湘潭,411201;3. 湖南科技大学土木工程学院,湖南湘潭,411201)摘要:因实际掌子面没有支护力,用支护力反映新奥法隧道掌子面稳定性存在缺陷,为此,提出用虚拟支护力表示。
在分析渗流场基础上,结合强度折减法和极限分析上限法,推导存在渗透力的掌子面稳定安全系数公式,并应用于实际隧道工程;分析水位高度、帷幕注浆长度等参数对渗透力与掌子面稳定性影响的规律;最后对孔隙水压力与渗透力进行计算。
研究结果表明:随着水位升高,单位平均渗透力增大,掌子面安全系数呈负指数降低;若仅考虑水平渗透力而忽略竖向渗透力,则所得结果偏不安全;帷幕注浆的安全系数比无注浆时的高,但渗透力比无注浆的大;随着掌子面前方帷幕注浆长度增加,水平渗透力减小,而竖向渗透力增加,安全系数略微减小;减小台阶开挖高度,可以提高掌子面的稳定性;随着黏聚力和内摩擦角增大,掌子面稳定安全系数提高,但增加梯度减小。
关键词:隧道工程;掌子面稳定性;渗透力;极限分析法;强度折减法;帷幕注浆中图分类号:U495.2 文献标志码:A 文章编号:1672−7207(2019)05−1221−08Influence of seepage force on tunnel face stability bynew Austria tunneling methodHUANG Kan1, AN Yonglin2,3, YUE Jian2,3, ZENG Xianchen3, LI Jiahao3, ZHANG Yijie1, WANG Dong1(1. School of Civil Engineering, Changsha University of Science & Technology, Changsha 410114, China;2. Key Laboratory of Geotechnical Engineering for Stability Control and Health Monitoring of Hunan Province,Hunan University of Science and Technology, Xiangtan 411201, China;3. School of Civil Engineering, Hunan University of Science and Technology, Xiangtan 411201, China)Abstract: Because the actual tunnel face is unsupported, there is a defect of using the support pressure to evaluate tunnel face stability by new Austria tunneling method, so virtual support pressure was used to express it. On the basis of the analysis of seepage field and combining the strength reduction method and the upper bound limit method, the formula of the stability safety factor containing the tunnel face of the seepage force was derived and applied in the actual tunnel engineering. The influence of water level and curtain grouting length on permeability and face stability were analyzed.收稿日期:2018−12−11;修回日期:2019−03−12基金项目(Foundation item):国家自然科学基金资助项目(51408216, 51308209); 中国国家留学基金资助资助(201908430109); 湖南省教育厅科学研究重点项目(18A127);长沙理工大学“双一流”科学研究国际合作拓展项目(2018IC19);长沙理工大学土木工程优势特色重点学科创新性项目(18ZDXK05)(Projects(51408216,51308209) supported by the National Natural Science Foundation of China; Project(201908430109) supported by China Scholarship Council; Project(18A127) supported by the Key Foundation of Education Department of Hunan Province;Project(2018IC19) supported by the International Cooperation and Development Program of Double-First-Class Scientific Research in Changsha University of Science & Technology; Project(18ZDXK05) supported by Innovative Program of Key Disciplines with Advantages and Characteristics of Civil Engineering of Changsha University of Science & Technology)通信作者:黄戡,博士(后),副教授,从事隧道工程、岩土工程和城市轨道交通工程研究;E-mail:***************中南大学学报(自然科学版) 第50卷 1222Finally, some calculation methods of pore water pressure and permeability were discussed. The results show that when the water level increases, the average seepage force increases, and the safety factor of the tunnel face decreases as a negative index. If only the horizontal seepage force is considered and the vertical permeability is ignored, the result is not safe. The safety factor of curtain grouting is higher than that without grouting, but the seepage force is greater than that without grouting. With the increase of curtain grouting length in the front of the tunnel face, the horizontal seepage force decreases, while the vertical seepage force increases, and the safety factor decreases slightly. The stability of the tunnel face can be improved by reducing the excavation height. With the increase of cohesion and internal friction angle, the safety factor of tunnel face increases, but the increasing gradient decreases.Key words: tunnel engineering; face stability; seepage force; limit analysis method; strength reduced method; curtain grouting因掌子面不稳定而发生塌方的案例很多,特别是富水地段,由于水的弱化与渗流等作用,更是加剧了掌子面的失稳塌方。
REVIEW ARTICLEAdvances in discrete element modelling of underground excavationsCarlos Labra ÆJerzy Rojek ÆEugenio On˜ate ÆFrancisco ZarateReceived:5November 2007/Accepted:6May 2008/Published online:17July 2008ÓSpringer-Verlag 2008Abstract The paper presents advances in the discrete element modelling of underground excavation processes extending modelling possibilities as well as increasing computational efficiency.Efficient numerical models have been obtained using techniques of parallel computing and coupling the discrete element method with finite element method.The discrete element algorithm has been applied to simulation of different excavation processes,using dif-ferent tools,TBMs and roadheaders.Numerical examples of tunnelling process are included in the paper,showing results in the form of rock failure,damage in the material,cutting forces and tool wear.Efficiency of the code for solving large scale geomechanical problems is also shown.Keywords Coupling ÁDiscrete element method ÁFinite element method ÁParallel computation ÁTunnelling1IntroductionA discrete element algorithm is a numerical technique which solves engineering problems that are modelled as a large system of distinct interacting bodies or particles that are subject to gross motion.The discrete element method (DEM)is widely recognized as a suitable tool to model geomaterials [1,2,4,8].The method presents important advantages in simulation of strong discontinuities such as rock fracturing during an underground excavation or rock failure induced by a tunnel excavation.It is difficult to solve such problems using conventional continuum-based procedures such as the finite element method (FEM).The DEM makes possible the simulation of different excavation processes [5,7]allowing the determination of the damage of the rock or soil,or evaluation of cutting forces in rock excavation with roadheaders or TBMs.Different possibil-ities of DEM applications in simulation of tunnelling process are shown in the paper.Examples include new developments like evaluation of tool wear in rock cutting processes.The main problem in a wider use of this method is the high computational cost required by the simulations first of all due to large number of discrete elements usually required.Different strategies are possible in addressing this problem.This paper will present two approaches:parall-elization and coupling the DEM and FEM.Parallelization techniques are useful for the simulation of large-scale problems,where the number of particles involved does not allow the use of a single processor,or where the single processor calculation would require an extremely long time.A shared memory parallelization of the DEM algorithm is presented in the paper.A high per-formance code for the simulation of tunnel construction problems is described and examples of the efficiency of thebra ÁE.On˜ate ÁF.Zarate International Center for Numerical Methods in Engineering,Technical University of Catalonia,Gran Capitan s/n,08034Barcelona,Spaine-mail:clabra@ E.On˜ate e-mail:onate@ F.Zaratee-mail:zarate@J.Rojek (&)Institute of Fundamental Technological Research,PolishAcademy of Sciences,Swietokrzyska 21,00049Warsaw,Poland e-mail:jrojek@.plActa Geotechnica (2008)3:317–322DOI 10.1007/s11440-008-0071-2code for solving large-scale geomechanical problems are shown in the paper.In many cases discontinuous material failure is localized in a portion of the domain,the rest of it can be treated as continuum.Continuous material is usually modelled more efficiently using the FEM.In such problems coupling of the discrete element method with the FEM can provide an optimum solution.Discrete elements are used only in a portion of the analysed domain where material fracture occurs,while outside the DEM subdomainfinite elements can be bining these two methods in one model of rock cutting allows us to take advantages of each method. The paper presents a coupled discrete/finite element tech-nique to model underground excavation employing the theoretical formulation initiated in[5]and further devel-oped in[6].2Discrete element method formulationThe discrete element model assumes that material can be represented by an assembly of distinct particles or bodies interacting among themselves.Generally,discrete elements can have arbitrary shape.In this work the formulation employing cylindrical(in2D)or spherical(in3D)rigid particles is used.Basic formulation of the discrete element formulation using spherical or cylindrical particles wasfirst proposed by Cundall and Strack[1].Similar formulation has been developed by the authors[5,7]and implemented in the explicit dynamic code Simpact.The code has a lot of original features like modelling of tool wear in rock cut-ting,thermomechanical coupling and other capabilities not present in commercial discrete element codes.Translational and rotational motion of rigid spherical or cylindrical elements is described by means of the Newton–Euler equations of rigid body dynamics:M D€r D¼F D;J D_X D¼T Dð1Þwhere r D is the position vector of the element centroid in a fixed(inertial)coordinate frame,X D is the angular veloc-ity,M D is the diagonal matrix with the element mass on the diagonal,J D is the diagonal matrix with the element moment of inertia on the diagonal,F D is the vector of resultant forces,and T D is the vector of resultant moments about the element central axes.Vectors F D and T D are sums of all forces and moments applied to the element due to external load,contact interactions with neighbouring spheres and other obstacles,as well as forces resulting from damping in the system.Equations of motion(1)are inte-grated in time using the central difference scheme.The overall behaviour of the system is determined by the cohesive/frictional contact laws assumed for the inter-action between contacting rigid spheres(or discs in2D).The contact law can be seen as the formulation of the material model on the microscopic level.Modelling of rock or cohesive zones requires contact models with cohesion allowing tensile interaction force between particle.In the present work the simplest of the cohesive models,the elastic perfectly brittle model is used.This model is char-acterized by linear elastic behaviour when cohesive bonds are active:r¼k n u n;s¼k t u tð2Þwhere r and s are the normal and tangential contact force, respectively,k n and k t are the interface stiffness in the normal and tangential directions and u n and u t the normal and tangential relative displacements,respectively. Cohesive bonds are broken instantaneously when the interface strength is exceeded in the tangential direction by the tangential contact force or in the normal direction by the tensile contact force.The failure(decohesion)criterion is written as:r R n;j s j R t;ð3Þwhere R n and R t are the interface strengths in the normal and tangential directions,respectively.Breakage of cohe-sive bonds allows us to simulate fracture of material and its propagation.In the absence of cohesion the frictional contact is assumed with the Coulomb friction model.3Coupling the DEM and FEMIn the present work the so-called explicit dynamic formu-lation of the FEM is used.The explicit FEM is based on the solution of discretized equations of motion written in the current configuration in the following form:M F€r F¼F ext FÀF int Fð4Þwhere M F is the mass matrix,r F is the vector of nodal displacements,F F ext and F F int are the vectors of external loads and internal forces,respectively.Similarly to the DEM algorithm,the central difference scheme is used for time integration of(4).It is assumed that the DEM and FEM can be applied in different subdomains of the same body.The DEM and FEM subdomains,however,do not need to be disjoint—they can overlap each other.The common part of the subdomains is the part where both discretization types are used with gradually varying contribution of each modelling method.This idea follows that used for molecular dynamics coupling with a continuous model in[9].The coupling of DEM and FEM subdomains is provided by additional kinematical constraints.Interface discrete elements are constrained by the displacementfield of overlapping interfacefinite elements.Making use of thesplit of the global vector of displacements of discrete ele-ments,r D ,into the unconstrained part,r DU ,and the constrained one,r DC ,r D ={r DU ,r DC }T ,additional kine-matic relationships can be written jointly in the matrix notation as follows:v ¼r DC ÀNr F ¼0;ð5Þwhere N is the matrix containing adequate shape functions.Additional kinematic constraints (5)can be imposed by the Lagrange multiplier or penalty method.The set of equations of motion for the coupled DEM/FEM system with the penalty coupling is as follows"M F 0000"M DU 0000"M DC 0000"J D26643775€r F €r DU €r DC _X D 8>><>>:9>>=>>;¼"F ext F À"F int F þN T k DF v "F DU"F DC Àk DF v "T D 8>><>>:9>>=>>;ð6Þwhere k DF is the diagonal matrix containing on its diagonal the values of the discrete penalty function,and globalmatrices "M F ;"M DU ;"M DC and "J D ;and global vectors"F int F ;"F ext F ;"F DU ;"F DC and "T D are obtained by aggregation of adequate elemental matrices and vectors taking into account appropriate contributions from the discrete and finite element parts.Equation (6)can be integrated in time using the standard central difference scheme.4Application of DEM to simulation of tunnelling process Fracture of rock or soil as well as interaction between a tunnelling machine and rock during an excavation process can be simulated by means of the DEM.This kind of analysis enables the comparison of the excavation process under different conditions.4.1Simulation of tunnelling with a TBMSimplified models of a tunnelling process must be used due to a high computational cost of a full-scale simulation in this case.We assume that the TBM is modelled as a cylinder with a special contact model for the tunnel face is adopted.Figure 1presents a simplified tunnelling process.The rock sample,with a diameter of 10m and a length of 7m,is discretized with randomly generated and densely com-pacted 40,988spheres.Discretization of the TBM geometry employs 1,193rigid triangular elements.Tunnelling pro-cess has been carried out with prescribed horizontal velocity 5m/h and rotational velocity of 10rev/min.Rock properties of granite are used,and the microscopic DEM parameters corresponding to the macroscopic granite properties are obtained using the methodology described in [10].A special condition is adopted to eliminate the spherical particles in the face of the tunnel.Each particle,which is in contact with the TBM and lacks cohesive contacts with other particles,is removed from the model.Thus,the advance of the TBM and the absorption of the material in the shield of the TBM is modelled.Figure 1a,c presents the displacement of the TBM and the elimination of the rock material.The area affected by the loss of cohesive contacts,resulting in material failure is shown in Fig.2.This loss of cohesion can be considered as damage ,because it produces the change of the equivalent Young modulus.4.2Simulation of linear cutting test of single disccutter Simulation of the linear cutting test was performed.A rock sample with dimensions of 13591095cm is repre-sented by an assembly of randomly generated and densely compacted 40,449spherical elements of radii ranging from 0.08to 0.60cm.The granite properties are assumed in the simulation and appropriate DEM parameters are evaluated.The disc cutter is treated as a rigid body and the parameters describing its interaction with the rock are as follows:contact stiffness modulus k n =10GPa,Coulomb friction coefficient l =0.8.The velocity of the disc cutter is assumed to be 10m/s.Fig.1Simulation of TBM excavation:Evolution and elimination ofmaterialFig.2Simulation of TBM excavation:Damage over tunnel surfaceFigure 3a shows the discretization of the disc cutter.Only the area of the cutter ring in direct interaction with the rock is discretized with discrete elements due to the com-putational cost reasons.The whole model is presented in Fig.3b.The evolution of the normal cutting force during the process is depicted in Fig.4a.The values of the forces should be validated,because the boundary condition can affect the results.The evolution of the wear,using the for-mulation presented in [5],can be seen in Fig.4b.The elimination of the discrete elements,where the wear exceed the prescribed limit,permit the modification of the disc cutter shape,which leads to a change of the interaction forces.In the present case,a low value of the wear constant is considered,in order to maintain the initial tool shape.Accumulated wear indicates the areas where the removal of the tool material is most intensive.An acceleration of the wear process using higher values of the wear constant is required in order to obtain in a short time considered in the analysis the amount of wear equivalent to real working time.5High performance simulationsOne of the main problems with the DEM simulation is the computational cost.The contact search,the force calcula-tion for each contact,and the large number of elements necessary to resolve a real life problem requires a high computational effort.High performance computation,and parallel implementation could be necessary to run simu-lations with large number of time steps.The advances of the computer capabilities during last years and the use of multiprocessors techniques enable the use of parallel computing methods for the discrete element analysis of large scale real problems.A shared memory parallel version of the code is tested.The main idea is to make a partition of the mesh of particles and use each processor for the contact calculation at different parts of the mesh.The partition process is performed using a special-ized library [3].The calculation of the cohesive contacts requires most of the computational cost.A special structure for the database,and the dynamic load balance is used in order to obtain a good performance for the simulations.Two different structures for the contact data are used in order to have a good management of the information.The first data structure is created for the initial cohesive contacts,where a static array can be used.The other data structureisFig.3Linear cutting test simulation:a cutter ring with partial discretization;b full discretized model0.014Table 1Times for different number of processors Time (s)versus processors 124Total404.31272.93156.85Static contacts (per step)0.12790.06920.0351Dynamic contacts (per step)0.00590.00570.0055Time integration (per step)0.04260.03570.0344Speed up1.001.842.58designed for the dynamic contacts,occurring in the process of rock fragmentation,and the interaction between differ-ent bodies.The management of this kind of contact is completely dynamic,and it is not necessary to store vari-ables with the history information.Table 1presents the times of parallel simulations of a tunnelling process,which was described earlier.The main computational cost is due to the cohesive contacts evalu-ation.The results shown in the table confirm that a good speed-up has been achieved.6DEM and DEM/FEM simulation of rock cutting A process of rock cutting with a single pick of a roadheader cutter-head has been simulated using discrete and hybrid discrete/finite element models.In the hybrid DEM/FEM model discrete elements have been used in the part of rock mass subjected to fracture,while the other part have been discretized with finite elements.In both models the tool is considered rigid,assuming the elasticity of the tool is irrelevant for the purpose of modelling of rock fracture.Figure 5presents results of DEM and DEM/FEM sim-ulation.Both models produce similar failures of rock during cutting.Cutting forces obtained using these two models are compared in Fig.6.Both curves show oscilla-tions typical for cutting of brittle rock.In both cases similar values of amplitudes are observed.Mean values of cutting forces agree very well.This shows that combined DEM/FEM simulation gives similar results to a DEM analysis,while being more efficient numerically—computation time has been reduced by half.7Conclusions •Discrete element method using spherical or cylindrical rigid particles is a suitable tool in modelling of underground excavation processes.•Use of the model in a particular case requires calibra-tion of the discrete element model using available experimental results.•Discrete element simulations of real engineering prob-lems require large computation time and memory resources.•Efficiency of discrete element computation can be improved using technique of parallel computations.Parallelization makes possible the simulation of large problems.•The combination of discrete and finite elements is an effective approach for simulation of underground rock excavation.Acknowledgments The work has been sponsored by the EU project TUNCONSTRUCT (contract no.IP 011817-2)coordinated by Prof.G.Beer (TU Graz,Austria).References1.Cundall PA,Strack ODL (1979)A discrete numerical method for granular assemblies.Geotechnique29:47–65Fig.5Simulation of rock cutting:a DEM model,b DEM/FEM model2.Campbell CS(1990)Rapid granularflows.Annu Rev Fluid Mech2:57–923.Karypis G,Kumar V(1998)A fast and high quality multilevelscheme for partitioning irregular graphs.SIAM J Sci Comput 20:359–3924.Mustoe G(ed)(1992)Eng Comput9(2).Special issue5.On˜ate E,Rojek J(2004)Combination of discrete element andfinite element methods for dynamic analysis of geomechanics put Methods Appl Mech Eng193:3087–3128 6.Rojek J(2007)Modelling and simulation of complex problems ofnonlinear mechanics using thefinite and discrete element meth-ods(in Polish).Habilitiation Thesis,Institute of Fundamental Technological Research Polish Academy of Sciences,Warsaw7.Rojek J,On˜ate E,Zarate F,Miquel J(2001)Modelling of rock,soil and granular materials using spherical elements.In:2nd European conference on computational mechanics ECCM-2001, Cracow,26–29June8.Williams JR,O’Connor R(1999)Discrete element simulationand the contact problem.Arch Comp Meth Eng6(4):279–304 9.Xiao SP,Belytschko T(2004)A bridging domain method forcoupling continua with molecular put Methods Appl Mech Eng193:1645–166910.Zarate F,Rojek J,On˜ate E,Labra C(2007)A methodology todetermine the particle properties in2d and3d dem simulations.In:ECCOMAS thematic conference on computational methods in tunnelling EURO:TUN-2007,Vienna,Austria,27–29August。
A 高分子化学和高分子物理UNIT 1 What are Polymer?第一单元什么是高聚物?What are polymers? For one thing, they are complex and giant molecules and are different from low molecular weight compounds like, say, common salt. To contrast the difference, the molecular weight of common salt is only 58.5, while that of a polymer can be as high as several hundred thousand, even more than thousand thousands. These big molecules or ‘macro-molecules’ are made up of much smaller molecules, can be of one or more chemical compounds. To illustrate, imagine that a set of rings has the same size and is made of the same material. When these things are interlinked, the chain formed can be considered as representing a polymer from molecules of the same compound. Alternatively, individual rings could be of different sizes and materials, and interlinked to represent a polymer from molecules of different compounds.什么是高聚物?首先,他们是合成物和大分子,而且不同于低分子化合物,譬如说普通的盐。
四、邊界層內外域實驗第一部分:邊界層實驗目的:在定壓及變壓之情況下,量測平滑及粗糙兩平板之邊界層速度分布,以明瞭邊界層之現象。
器具:空氣動力實驗測定台、邊界層儀。
照1 邊界層實驗儀理論:1.當流體流經一固體表面時,沒有滑移的現象,其速度剖面由零增至自由流線之速度,此速度變化之層稱為邊界層。
2.當一等速均勻流V 流經一平板時,邊界層厚度隨著距離而增加,先為層流,若平板夠長則將經一轉換區而發展成為亂流。
3.若令轉換區之雷諾數為x R 則νVxR x =(1)x R 之範圍通常為55105101⨯⨯ɩ。
4.定義位移厚度(displacement thickness )*δ:如圖1所示。
圖1 位移厚度示意圖()⎰-=∆dy v V Q(2) *δ=∆V Q(3)()⎰⎰∞∞*⎪⎭⎫ ⎝⎛-=-=δ∴00dy V v 1dy v V V1 ⎩⎨⎧==δ>0V v -1Vv y 當 ⎰δ*⎪⎭⎫⎝⎛-=δ∴0dy V v 1(4)因此由邊界層之速度分布可求得*δ值。
5.圖2中:圖2 質量和動量通量示意圖x dx m d V M x dx M d M x -w δ--δ+=δτ ()M mV dxd dx M d dx m d -=-=V w τ (5) 而 ⎰δρ=0vdy m(6) ⎰δρ=02dy v M (7)代入(5)式,得⎥⎦⎤⎢⎣⎡⎪⎭⎫ ⎝⎛-⋅ρ=τ⎰δ02w dy V v 1V v dx d V (8) =τ=ρ2V wf 2C local skin friction coeff.(9)(8)式變為⎭⎬⎫⎩⎨⎧⎪⎭⎫ ⎝⎛-=⎰δdy V v 1V v dx d 2C 0f (10)6.定義動量厚度(momentum thickness )θ:⎰δ⎪⎭⎫ ⎝⎛-=θ0dy V v 1V v (11)(10)式變為dxd 2C f θ= (12)作用於一L 長,單位寬度平板表面之總摩擦力(total skin friction force per unit width on a plate of length)⎰=Lw dx D 0f τ(13)與(9)式比較得⎰=L f dx C V D 02f 2ρ由(12)(13)式,⎰⨯=Ldx dxd V D 02f 22θρ 當x =0時,θ=0若L θ表從邊緣至L 距離時之動量厚度L V D θρ222f ⨯=(14) ==ρ2L V ff 2D C Overall skin friction coeff.代入(14)式L C L f /2θ=(15)定義形狀因子(shape factor )H :動量厚度位移厚度=θδ=*H (16)(一)層流邊界層沿一平板之速度剖面可得x R x 721.1=δ* (17) x R x664.0=θ(18) 59.2H =(19)(二)亂流邊界層n1y V v ⎪⎭⎫ ⎝⎛δ= (20) 95101085ɩǩɩ==x R n 當2.0x R x 046.0=δ* (21) 2.0x R x 036.0=θ (22) 29.1H =(23)上述為壓力無變化時之情況,若壓力沿著流線變化,如加入Liners ,則 伯努利方程式:dxdV V dx dp ρ-= (24)(1) 流線加速、減壓使得動量增加,則邊界層成長較慢。
龚昌德教授简历1953年毕业于复旦大学物理系,1953年9月至1955年1月在华东水利学院任教。
1955年1月以后至今在南京大学物理系工作,1978 – 1981 年任副教授, 1981年任南京大学物理系教授,同年获国务院学位委员会通过我国首批博士生导师,1986-1993 年任南京大学物理系系主任,1994年至今任南京大学理学院院长,理论物理研究中心主任。
2005年当选为中国科学院数理学部院士。
从事的研究领域主要有:强关联电子系,超导物理,低维物理,光与低维固体相互作用,介观物理等。
主持项目和获奖情况:1978年因“超导物理研究”获“全国科学大会奖”;1982年,因“超导体临界温度”的研究成果获得国家自然科学奖;1984年获得首批“国家级有突出贡献中青年专家”;1985年主持国家基金项目“低维系统相变及元激发研究”;1987年主持国家重点基金项目“量子超细微粒的物理研究”1988年所著“热力学与统计物理学”获得国家教委高等学校优秀教材一等奖;1990年因“光与低维固体相互作用”的研究成果获得国家教委科技进步二等奖;1990年享受国务院政府特殊津贴;1992年因“低维系统中的相变元激发”的研究成果获得国家教委科技进步二等奖;1992年任理论物理攀登项目“九十年代理论物理重大前沿课题”专家组成员,强关联电子系统子课题组组长;1993年主持国家“863”超导项目中基础研究部分;1996年获得江苏省高等学校“红杉树”园丁奖金奖;1997年因“凝聚态物理学高层次人才培养与实践”获得国家级教学成果一等奖;1997年获得“宝钢优秀教师奖”。
1998年合作项目“介观环的持续电流及其电子输运性质”被广东省科技委列为1998年广东省重大科技研究成果。
曾任学术职务:1982年被推选为全国凝聚态理论及统计物理专业委员会领导小组成员;1985年起历任二、三、四届国务院学位委员会学科组成员1986年受聘为李政道中国高科技中心首批特别成员;1986年任江苏省物理学会理事长;1987年受聘为意大利国际理论物理中心(ICTP)协联教授;1990年任国家教委首届“物理学教学指导委员会”委员;1992年江苏省自然科学基金委员会首届委员;1992年受聘为国际核心期刊“J. Low. Temp. Phys.” 编委;1993年任国家普通高校优秀教学成果评审委员会委员;1995-1999中国物理学会常务理事1995年任江苏省青年科技奖专家评审委员会副主任;1995年任国家教委第二届“高等学校理科物理学与天文学教学指导委员会”副主任委员;1997年度香港中文大学杨振宁访问教授位置。
专利名称:Tunnelling field effect transistor发明人:Haijun Lou,Xinnan Lin,Dan Li,Jin He申请号:US14916976申请日:20140901公开号:US09793351B2公开日:20171017专利内容由知识产权出版社提供专利附图:摘要:A tunneling field effect transistor, comprising a gate electrode layer, a gate dielectric layer, a source region, a connected region and a drain region, wherein the source region comprises a first source region and a second source region, the second source region comprising an inner layer source region and an outer layer source region.The connected region comprises an expansion region and a high-resistance region. The doping types of materials of the inner layer source and the outer layer source region are opposite, and the forbidden bandwidth of the material of the inner layer source region is less than that of the outer layer source region. The contact surface formed by way of covering the inner layer source region by the outer layer source region is a curved surface. Since a contact surface of an outer layer source region and an inner layer source region of a tunneling field effect transistor is of a curved surface structure, the contact area of the outer layer source region and the inner layer source region is increased, and the probability of tunneling of a carrier through the contact surface is increased. Therefore, the On-state current is increased, thereby having a good current drive capability.申请人:PEKING UNIVERSITY SHENZHEN GRADUATE SCHOOL地址:Shenzhen CN国籍:CN代理机构:Ladas & Parry, LLP更多信息请下载全文后查看。
a r X i v :c o n d -m a t /9909166v 2 23 F eb 2001Ann.Phys.(Leipzig)9(2000)1,1–52Ann.Phys.(Leipzig)9(2000)1Tunnelling of defects in superfluids34Ann.Phys.(Leipzig)9(2000)1Tunnelling of defects in superfluids5.(1) In this relation,S e(E)is the Legendre transform of the Euclidean action S e(T e)≫ as a function of T e,the Euclidean period of motion[2]:∂S eS e(E)=S e(T e)−6Ann.Phys.(Leipzig)9(2000)1γ M0c2s+12γQ′2 +q dσ 1γdσ,and the vector Q is a perturbation of some equilibrium string configuration perpendicular to the tangent vector X′of the line.The rest frame mass M0is given by M0=E0/c2sTunnelling of defects in superfluids 7γ˙X .(7)It consists of a contribution P inc ,which is related to the Magnus force acting on the vortex,and a second contribution P kin related to the existence of a nonzero vortexmass,that is,to a finite compressibility and thus finite c s .It follows by integration of(5)that the ratio of the momentum contributions P kin ,P inc is in order of magnitude ≈(N v κ)/(c s |X |)(|˙X|/c s )(neglecting the vortex energy logarithm).Hence for large scales (large curvature radii),and small velocities,that is in the hydrodynamic limit,P kin is dominated by P inc .The Euclidean action is given byS e (T e )= T e 0dt e dσ 2c 2s ˙Q 2+1bIn pair-correlated Fermi superfluids,q =N v h/2,where the number density in (5)and (6)is understood to refer to the “elementary”particles constituting the superfluid,and not to the Cooper pairs.8Ann.Phys.(Leipzig)9(2000)1γ˙X .(9)The Euclidean action splits into a part S inc e ,due to the interaction of the vortex with an (approximately)incompressible background superfluid,and a part S kin e which canbe ascribed to the kinetic (‘vortex matter’)term in the vortex momentum.We will now show that S inc e (E )is given by a volume associated with the path the vortex line traces out in configuration space,whereas S kin e is connected with an area associated with that path.To demonstrate this,we integrate relation (5),multiplied with q ,to obtain (ρ=ρ0)− P inc a dX a dσ=N v hρ0 √g dX 1dX 2dσtracedout by the line on its path.Further,using the gauge freedom for the momentum,we can express the action S inc e (E )by the volume integralS inc e (E )g dZ 1dZ 2dσ,(11)wherein the co-ordinate differentials are defined to be dZ 1=cos αdK 1+sin αdK 2=−i cos αdX 1+sin αdX 2 ,dZ 2=−sin αdX 1+cos αdX 2.(12)The angle α(σ)parameterizes in these differentials the local (co-ordinate)gauge free-dom for the momentum,of rotations about the line tangent X ′.It expresses the fact that one degree of freedom is still available,namely that for the direction of the local gauge dependent momentum P inc (σ),even after a local basis on the string has been chosen.For the components of P inc in the two Q -directions e 1and e 2the relation∂2P inc 1−∂1P inc 2=N v hρ0√g dX 1dX 2dσ,(14)Tunnelling of defects in superfluids9γ˙Q a dX a dσ=N v hρ0c sln(···)(˙Q a/c s)√2πξ (˙Q a/c s)√=ρ0 2πΩ(d)+ln(···)ξΣ(d)[∂X/(c s∂t)] .(17) The volumeΩ(d)=−i √γdX a dσ(18)obtained by integrating over the surface enclosingΩ(d)is a functional of the vortex velocity scaled by the speed of sound(d indicates the spatial dimension).To summarize,in a dense,strongly coupled superfluid,thefirst term dominates the second term in(17)for the following reasons:10Ann.Phys.(Leipzig)9(2000)1R ln 8R2uR2 .(20)4πIf we normalize the energy by4πm˜HV≡ln 8R/ξ2πuln 8κ/(2πuξ)2πu2 R20−β2K2 =hρ02π2ψC+ψu=Rκ2uR2 1− a R2+Z2 3 ,(26)with w≡1+(1/2)[(Z2+R2−a2)/(aR)]2.The function Q1/2is a Legendre function ofthe second kind([23],No.8.821),a solution of the Poisson equation∆ψ=κδ(2)(x−X) for the combined spherical-cylindrical symmetry of the problem at hand.The problem of a undeformed,massless half-ring situated at a half-sphere,with their axes coinciding,is actually the only nontrivial problem in three spatial dimensions solvable with reasonable effort analytically.It has just the maximal symmetry in three dimensions.It does not,however,contain the crucial ingredient for a full geometrical analysis of quantum tunnelling:The curvature of theflow obstacle is constant.The result that,for the sphere,the vortex half-ring follows exactly the surface(up to a constant distance of orderξ),has led in[25]to the assumption that it is admissible to continue this result to the ellipsoid case,in the manner of(24).We will showd 2−X 2(for |Y |≤d )is astreamline of constant ψ≡0.Such a requirement can be met by using the technique of image charges quite familiar from electrostatics:Our vortex problem is completely equivalent to that for a ‘charge’situated near a perfectly conducting surface,with no tangential ‘electric’field.The complex potential generated by the image vortices and acting on the vortex at Z 1is then given byw i (Z 1)=−i κd 2/Z 1−Z 1.(27)The first factor in the numerator stems from the image vortex at the plane Y =0with complex potential w (Z )=−i (κ/2π)ln[Z −¯Z1](which has tobe present even without the circle),the second one is obtained by the circle theorem [27]as the image of the original vortex at the circle.Finally,the potential of the remaining +κ-circulation2 z+ 2(sinhζ+coshζ)=l−x2l2sinh2χ+y2l2sin2ηexp(χ1−χ0)|sinη1|sinh(χ1−χ0)ξsinh(χ1−χ0)|sinη1|,(36)κ2bv L,(37)such that the velocity at the top is well below the critical velocityv L≡κgχχ(χ0)δχ=(a2sin2η+b2cos2η)1/2δχ. We define a quantity s bys=aδχc≡aδχ(η=π/2).(39)At the ellipse top,s=δs(η=π/2),provided thatδχc≡χ1(η=π/2)−χ0≪χ0. The actual distance of the vortex to the top is somewhat different if this inequality does not hold.We do not further dwell on this difference here for the sake of simple argument and take(39)as a definition of the quantity of distance s.Evaluating(36)atη=π/2for small velocities,and assuming that˜E0is small enough forδχc≪1to hold,we getδχc≃ξexp[˜E0]/(a+b)and therefores≃abexp[˜E0]ξ(η=π/2,u small).(40)On the other hand,far away from the half-ellipse,at theflat boundary,the distance is,in the low velocity limit,given byδs≃(1/2)ξexp[˜E0].We observe that the vortex comes closer to the ellipse by a ratio2a/b(for b≫a)than it was far away from the ellipse.If a=b,that is,in the case of the circle,the distance remains the same.ξexp δχc tanh δχc −4πu (a +b )a s v L 1+b ξ.(43)the last line valid provided that we can approximate,with reasonable accuracy,e.g ,tanh δχc ≃δχc .The energy ˜E0is the energy needed by the vortex to remain com-pletely describable in termsof a collective co-ordinate on its way along the ellipse.The quantity s is defined in (39),and has a lower bound related to the prescription(41).We have depicted the normalised potentials corresponding to different velocities in units of v L and ratios s/a in Figs.2and 3.The potentials in these figures correspond to the real space ellipse shown in 5which has b/a ≃5.7and where s/a ≈2.For clarity,we have additionally displayed the shape of the barriers in the direction of the y -axis (i.e.the e χ-axis at η=π/2)in Fig.4.Whereas for u =0.04the semiclassical approximation is still applicable,for u =0.08this is no longer the case.It is approx-imately for this velocity that the barrier tends to zero and the tunnelling distance approaches ξ.One can see here explicitly that v L indeed represents a sensible measure for a critical velocity,because the local velocity at the top is ≃v L ,if the velocity at infinity takes the value u ≃0.088.The situation we encounter in real space is shown in Figure 5.We visualize the quantum core size as the shaded area around the vortex center,having the O (ξ)-radius used in (41).The vortex on path 1is not able to pass the ellipse without some part of this shaded area covering the ellipse,but the vortex on path 2with energy ˜Eh =ρ0Ω(d)=ρ0βV(d)N.(52)Here,the effective sharpnessβ=tanh(χ0+δχc)is a measure of the maximal ec-centricityǫ=e We refer to the contribution of S ince as a volume contribution in general,according to(17).Intwo dimensions,of course,a volume is an area and an area is a length in conventional terms.ξ (˙Q a/c s)dX a2π≪2hρ0ln(···)cK msπξc sS inc e(E).(53)The contribution of the vortex mass is thus at least suppressed by two small factors:ξ/Y0and v max/c s,contributing both in equal measure to the fact that S kine is negligibleas compared to S inc e.2.6.6SummaryWe now summarize this extended investigation of the analytically soluble2d problem, emphasising in particular its crucial outcome.Starting from the‘electrostatic’problem of a single point vortex situated near a half-circle at a boundary,we derived the vortex energy by conformally transforming via the(inverse)Joukowski transformation to the half-ellipse solution.We concluded from the general expression for the vortex energy(36),that it is necessary to introduce the geometric constraint(41),expressing the limits of the hydrodynamic collective co-ordinate formalism under consideration.Calculating the tunnelling volume(area),we have seen that it assumes the general form(52).The tunnelling volume(area)Ω(2) cannot be reduced to a lower bound given by the sharpness of the ellipse,tanhχ0,but has to be larger,β=tanh(χ0+δχc),if we are bound to remain within the domain of the approach which has been employed.It is to be noted that we expressed the energy of the vortex in units of the energy h2ρ0/(4πm)=mρ0κ2/4π≃0.82K/˚A(at p≃1bar and in three dimensions).For realistic values of the parameters in(42),the values of˜E0cover the same range as the phonon-maxon-roton spectrum.Energywise,the trapped small scale vortex thus cannot be distinguished from an elementary excitation of the superfluid.It could have been excited thermally and remained trapped at a pinning center during the cool-down of the superfluid to very low temperatures.From the above analysis it thus follows that it is semantically in general not quite appropriate to employ the widely used term‘vortex nucleation’for vortex tunnelling investigated within a hydrodynamic,collective co-ordinate theory.If we define‘nucle-ation’to mean creation from the zero of energy,we have seen that nucleation is not amenable to such a description under general circumstances.Experimentally,it will be impossible to distinguish the tunnelling of a small energy vortex at a rough boundary from the true nucleation event of a nascent vortex there,if no direct means to control the microscopic dynamics can be provided.It remains,of course,to be explained how a vortex of such small energy and size(i.e.one with small distance of O(ξ)to the boundary),can be defined and described quantitatively.The present approach can onlyfix the tunnelling rates of a vortex if one presupposes that the vortex can be de-scribed by a collective co-ordinate along its whole path.This,however,will be true if the size of the vortex is sufficiently larger than O(ξ).Then,the dissipation-free motion of the vortex with constant energy and the purely geometric nature of the problem lead to strict bounds for the possible values of the semiclassical tunnelling exponent, directly related to geometrical quantities.=4.87·1011sec−1ξ−2[σ−2LJ](helium II),(55)πξ2which is the cyclotron frequency of vortex motion[30].We scaledξwith the Lennard-Jones parameterσLJ=2.556˚A of the4He atomic interaction.The frequencyω0is the natural vortex frequency associated with the scaleξalone.If we wish to connectωa with the quantity relating the strength of interatomic forces and compressibility,namely the speed of sound c s,which is involved in the vortex kinetic term,the following phenomenological treatment is of use.The expression for the vortex self energy is logarithmically divergent.If we considerξ-scales,this may be cured in a heuristic manner by regularizing the logarithm under the condition that2 (˙X/c s)2+ln 1+(Y/ξ)2 −8πuY/κ .(56) The minima of the potential,existing for low enough velocity,are situated atY min=κ1−16(u/v L)2 ≃κv L 2=2ξuξ=9.4·1011Hzc s[240m/s]Y0v maxπξc s +27.75+ln[(c s/ξ)n],(59)where inthe second line we inserted the results of the2d half-ellipse problem in equations(52)and(53),and the third line employs the Bohr-Sommerfeld quantization of(19).i [θ,H]=−1∂N.(61)Taking the thermodynamic average of this equation,we see that the time rate of change of the phase equals the(negative)local chemical potential(defined by˜µ=µ+(1/2)mv2s,whereµis the chemical potential in the superfluid rest frame),divided by ,a relation which became popular under the name‘Josephson-Anderson equation’[54,55].We now consider the time average of this thermodynamic average over a long time spanτand take the difference of the results for two points A,B in the superfluid:− ˜µ(r A)−˜µ(r B) t= d(θA−θB)τ τ0dt ddt t.(62) The last relation tells us that the the negative chemical potential difference between the points A and B,divided by Planck’s quantum of action,is equal to the number of vortices crossing the line C AB,joining A and B,per unit time,dn w/dt.A single phase slip process,caused by one migrating vortex,may be visualized as shown in Figs. 8and9.The Figs.8,9represent a pronounced simplification of the actual vortex motion process.We visualize in these pictures a point vortex moving on a straight line across the superflow through the orifice,which gives a highly symmetric view of the process.The real process of vortex half-ring motion is investigated in Refs.[47,45]. The principal global(topological)features of importance however remain untouched and independent of the actual vortex motion trajectory:The phase difference between two stationary states(times t≪t1and t≫t3in Figs.8and9)is exactly2πand the process always sucks the same amount of quantized energy from theflow,given by∆E=mρ0κS w v c=κJ c[56],with v c being the(mean)critical velocity offlow through the micro-orifice,at which the vortex migration process sets in,and J c the corresponding mass current(see for a derivation below).In Figures8and9,we represent a quantized vortex crossing the micro-orifice designated with quantities S w,l w in Figure7.The lines emanating from the vortexln 9.89 u[10m/sec]hρs v s(ω)−˙X(ω) ×X′2=D(ω) ˙X(ω)−v n(ω) +D′(ω)X′× ˙X(ω)−v n(ω) .(65)It is assumed that the vortices are singly quantized,with a constant circulation vector, the factor of1/2in the Magnus force taking account of the paired nature of the super-fluid.For the point vortex we will deal with,X′=∂X/∂σ=±e z,the upper/lower sign valid for a positive/negative circulation vortex.Thefirst line contains the conven-tional Magnus force(whereρs=ρs(T)is the superfluid density),and the second line the dissipative and reactive mutual friction forces from momentum exchange between vortex line and quasiparticle bath.We further assume in what follows for the sake of simplicity that the normal component is clamped,i.e.v n=0(this,of course,destroys the property of Galilean invariance afforded by(65)).Then,a convenient writing for2v s(ω)×X′=D(ω)˙X(ω)+ D′(ω)−14 1ω+ω0+iτ−1=(hC0/2)(τ−1−iω)/ω02hρs=hC0ω0ω−ω0+iτ−1−11+((ω0τ)−1−iω/ω0)2.(69)2ρs X′× ˙X−v s .(70) At the low temperatures considered,we neglected the small contribution of(h/2)(C0−ρs)X′×∂X/∂t≃(h/2)ρn X′×∂X/∂t,whereρn is the normal density in the superfluid state.This last expression represents the Iordanskiˇıforce[76](remember that wefixed v n=0),which is also present in Bose superfluids and not related to spectralflow[77].The Magnus force dominates in the above limit of‘slow’vortex motion withω≪ω0 the massive term(the Hall term on the right-hand side is larger by a factor ofω0/ωthan the inertial term).Still,the vortex core dynamical mass M c=hC0/(2ω0)∼mC0πξ2 is much larger than the mass arising from the compressible superflow outside the vortex core.Their ratio is of order M0/M c∼(d/ξ)2,where the quantity d signifies the interparticle spacing d≪ξ,so that M0may be neglected in the equation of motion (70).Dissipative motion prevails in the limitω0τ≪1,ωτ≪1:h2C0(ω0τ)˙X+hi The parameter C0is in general a measure of the density at the location of gap nodes;it is zero if no gap nodes are present.In our case,the gap nodes are at the position of the vortex line,other possible occurences of nodes are in the bulk of p-or d-wave superfluids.j We do not show the hydrodynamic and transverse mass terms on the right-hand side of(71), which are small compared to the friction term.The transverse mass[89],relating vortex velocity and momentum in different directions,can be defined dynamically from the equations of motion(66),like M c.Ω0ωc≪ Ω0.k There is a parameter region which yields a comparatively simple and unique result. This is the case ofΩ0τ≪1,which implies E0τ≪ .Assuming we have in addition ωτ≪1,we are led back to an equation of motion of the type(71).On the other hand,ifΩ0τ≫1(andωτ≪1),there is a‘universal region’[83,84],which is realized if E0τ≪ :The dissipative and Hall coefficients are independent of the relaxation time for very low temperatures and small magneticfields and have the same order of magnitude.Finally,ifΩ0τ≫1and E0τ≫ ,the equation of motion is of the type(70),with dominating Magnus force.This is a regime which will presumably2v s ×X ′=−dt ′K D (t −t ′)X (t ′)−X ′× dt ′K H (t −t ′)X (t ′),(72)where the kernels are,by use of (68)and (69),the Fourier transformsK D (t −t ′)=11+((ω0τ)−1−iω/ω0)2,K H (t −t ′)=11+((ω0τ)−1−iω/ω0)2.The integrals can be evaluated via complex contour integration.The poles z 1=ω0−iτ−1,z 2=−¯z 1are lying both in the lower half plane,so that the kernels are causal: K D (t −t ′)K H (t −t ′) = −1i hC 0ω02π dz e −iz (t −t ′) z z +¯z 1= i 1hC 0ω02ω20exp −∆t ω0τcos(ω0∆t ) ,K H (∆t )=θ(∆t )hC 0τ cos(ω0∆t )−12 dtψ[X(t)]+ dt t dt′K D(t−t′)X(t)·X(t′)−X′· dt t dt′K H(t−t′)X(t)×X(t′).(73) The gradient of the stream functionψdescribes the superflow perpendicular to the vortex,∇ψ=v s×X′.Making use of the phase angleΦ=arctan[(ω0τ)−1]and standard addition theo-rems,we can cast the action into the suggestive formS[X(t)]=hρs2ω02π ∞0dωe−ω|t e−t′e|ω2π1ω20+ω2τ ωτ−ω0,(75)and includenonlocality in lowest order.The dissipative kernel is of the Caldeira-Leggett-form([94]–[103])for ohmic dissipation,K D=(η/π)(∆t e)−2,with the frictionMass Magnus Potential[65]No No x2+y2)−F xNo V g(q)[ǫ≪1]No No V g(q)[ǫ≪1]No V g(q)[ǫ=1]No V g(q)[anyǫ]Table1Comparison of different approaches to quantum tunnelling with respect to domi-nant contributions employed in the calculation of the Euclidean tunnelling action(shown by an entry with a checkmark, ).The Magnus column indicates if a linear coupling of the vor-tex velocity to the superfluid background,generating the vortex velocity part of the Magnus force,has been used.In the potential V g(q),ǫ≪1means that the case of a near critical potential has been treated.In Ref.[93],this was done by an analytical method,in[92]by a numerical one.In the case of entry[105],both limitis of dominant Magnus and dissipation contributions have been considered,but not the intermediate case of equal strengths.This intermediate case has been examined numerically in[103],far offand near criticality.coefficientη=(1/2)hC0(ω0ωτ)/(ω20+ω2τ).The dissipation due to bound states is at a maximum ifω0τ=O(1)and vanishes in the limitsω0τ→∞andω0τ→0.The nonlocality of the Hall term in the action is of the same importance as that of the friction term ifω0≃ωτ.4.4Different regions of parameter spaceIt is rather obvious that the motion of a vortex for arbitrary competing contributions in the action(74)can be quite complicated.In principle,the following contributions in the action are conceivable.In addition to the terms appearing in(74),there can be contributions arising from the self-interaction,like in(8),that is,the hydrodynamic mass and elasticity terms(the self-energy is usually absorbed into the potential).The hydrodynamic mass was argued to be in general completely negligible as compared to the dynamic core mass in paired Fermi superfluids.The elasticity arises from the generalization of a2d or rectilinear vortex to one of arbitrary shape and the additional self-energy this creates.Hence,in order to actually describe an imaginary time motion and thus evaluate the tunnelling process probability,only certain classes of metastability problems have been investigated.The(stream function)potential is,for reasons of(analytical)solvability,frequently represented as a quadratic plus cubic potential for a one-dimensional generalized co-ordinate q.This potential is conventionally parameterized with two or three quantities, a height h and width w of the potential,and possibly with the additional parameterq0 2−2q0 3 ,(76)whereǫ=l Thepotential(76)corresponds to the so-called‘tilted washboard potential near criticality’ifǫ≪1,see,e.g.,[104].m In Ref.[112],however,quite large ratios up to(T0/T c)high−T∼0.22have been reported.c。