对法国、西班牙电网的调研
- 格式:docx
- 大小:112.97 KB
- 文档页数:12

高速电气化铁路对电力系统运行的影响作者:宋莹来源:《经营管理者·上旬刊》2016年第12期摘要:高速电气化铁路作为一种高效便捷的交通方式已被全世界各个国家所广泛采用,我国在近些年在高铁发展上有了令人瞩目的成绩,但由于其特殊的供电方式及谐波含量丰富,使得电气化铁路对电力系统中的电网运行有着较大的影响,本文通过分析高铁接触网的三个特点并结合国外的运行经验提出相应的解决方法。
关键词:电力系统接触网谐波功率因数负序功率电气化铁路具有速度快、运输能力强、供电距离长、节约能源与造价、牵引性能好等优点,因而具有广阔的发展前景,是世界以及我国铁路发展的方向,广泛地应用于铁路运输之中。
2010年全国铁路营业里程达到9万公里以上,电气化率均达到45%以上。
根据国务院批准的《中长期铁路网规划》,到2020年,我国铁路总里程将达到10万公里,其中电气化5万公里,主要干线铁路将实现电气化。
铁路电气化率约为50%,承担80%以上的运量。
其中,将建成以京沪、京广、京哈、沪涌深及徐兰、杭长、青太及沪汉蓉“四纵四横”客运专线(高速铁路)1.2万公里,客货混跑快速线路2万公里,形成我国铁路快速客运网,但由于其特殊的供电方式及谐波含量丰富对电力系统运行也有着非常严重的影响。
一、接触网对电力系统的影响目前我国高速电气化铁路采用的牵引制式是国际上较为先进的单相工频交流牵引方式。
单相牵引负荷是一种不对称负荷,接入电力系统运行时容易产生对称的负序电流和电压分量,其负序功率较大,负序电流会给电力系统运行带来很多不利的影响,如会使得电机的定子绕组过热,较大的负序分量会使得电力系统的继电保护装置动作从而切断电源造成损失。
电力机车大多采用的是全波整流的供电方式,假设平波电抗器有无限大的电感,于此同时整流变压器的线圈又无漏磁通,则其应从电网中所取用的原边电流波形应是方波,通过傅氏变换可将电流方波分解为N次谐波,故谐波含量比较丰富。
电力系统中的无功补偿方式主要是采用并联电容器组,当谐波电流叠加到电容器的基波电流上时,便会使得电容器上的有效值增大,并使得电容器本身的温度升高,甚至过热而影响到电容器的使用寿命,同时由于谐波电压的叠加可能导致电容器内部发生局部放电,使得电容器损坏,除此之外并联电容器对谐波电流还有放大的作用,装设电容器之后,系统谐波阻抗发生了变化,对于系统负荷来说既可为感性也可为容性,在特定谐波的作用下,并联电容器可能与系统发生并联谐振,使等效谐波阻抗达到最大值,这样就会使得电力系统中无功补偿的效率很低。
“三双”接线模式在高层小区的运维管理研究摘要:本文通过对滨海区中山花苑的“三双”配电设备试点工程建设运维的跟踪调查,分析了现阶段“三双”接线模式在高层小区的运维管理中的优势及存在的问题,并根据问题提出了关于“三双”设备运维的展望,相信对“三双”接线模式在配电网的应用普及有着积极的作用。
关键词:“三双”接线模式高层小区运维管理供电可靠性引言目前,在电网规划中对供电可靠性指标的提升研究已成为热点。
国内所采用的提升供电可靠性措施与发达国家相比都要全面,但其实施力度或覆盖率都很有限,使得提高供电可靠性的效果不明显,大部分都还处于是试点阶段。
近年来,“三双”接线模式无论是理论还是实践,都被证明是一种迅速有效提升配网供电可靠性的手段,本文以滨海供电区域内的试点小区中山花苑为依据,调研分析了“三双”接线作为一项新的技术,在高层小区运用中带来的巨大优势和前景,同时也就该小区运行维护的现状提出了对“三双”接线模式发展的展望。
一“三双”接线模式产生背景及应用方式(一)“三双”接线模式的提出“三双”接线是浙江省电力公司在消化、吸收国内外配网规划先进经验基础上的一项创新。
在深入研究法国、日本、新加坡等发达国家配电网接线模式,全面总结国内外配电网先进经验基础上, 2011年,省公司编制发布了《浙江省配电网规划设计导则》,导则中提出了中压配电网“双电源、双线路、双接入”的“三双”接线模式。
由浙江省电力公司浙江电网实际出发,提出的中压配电网“三双”接线模式,开始被应用到了高层小区的配电建设中。
该模式下“三双”接线模式的理论用户年平均停电时间在5分钟内,“三双”接线配电网的供电可靠率达到了99.999%。
“三双”接线模式具有可靠性高、维护成本低、扩展性好等一系列优点,,在新建的高层大规模小区中具有很高的应用价值,同时针对现有小区的接线的改造应用也具有很高的可行性。
针对现有配电网典型接线方式进行研究分析, 从表2-1我们可以看到基本现有的配网接线方式都可以改建成“三双”接线模式。
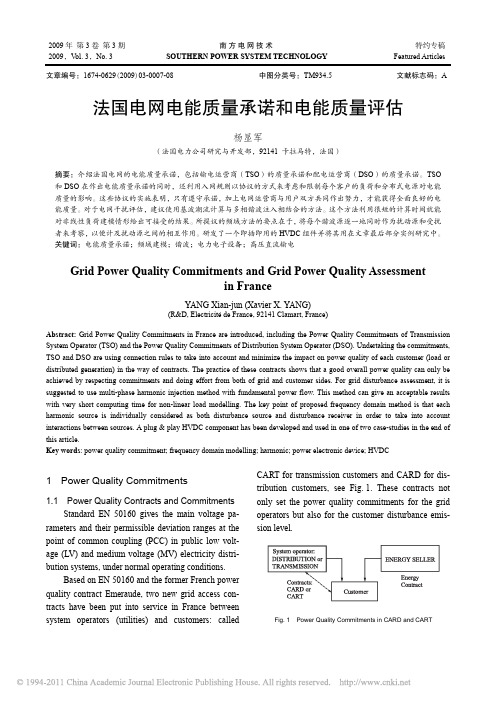
2009年第3卷第3期南方电网技术特约专稿2009,V ol. 3,No. 3 SOUTHERN POWER SYSTEM TECHNOLOGY FeaturedArticles 文章编号:1674-0629(2009)03-0007-08 中图分类号:TM934.5 文献标志码:A 法国电网电能质量承诺和电能质量评估杨显军(法国电力公司研究与开发部,92141 卡拉马特,法国)摘要:介绍法国电网的电能质量承诺,包括输电运营商(TSO)的质量承诺和配电运营商(DSO)的质量承诺。
TSO和DSO在作出电能质量承诺的同时,还利用入网规则以协议的方式来考虑和限制每个客户的负荷和分布式电源对电能质量的影响。
这些协议的实施表明,只有遵守承诺,加上电网运营商与用户双方共同作出努力,才能获得全面良好的电能质量。
对于电网干扰评估,建议使用基波潮流计算与多相谐波注入相结合的方法。
这个方法利用很短的计算时间就能对非线性负荷建模情形给出可接受的结果。
所提议的频域方法的要点在于,将每个谐波源逐一地同时作为扰动源和受扰者来考察,以便计及扰动源之间的相互作用。
研发了一个即插即用的HVDC组件并将其用在文章最后部分实例研究中。
关键词:电能质量承诺;频域建模;谐波;电力电子设备;高压直流输电Grid Power Quality Commitments and Grid Power Quality Assessmentin FranceYANG Xian-jun (Xavier X. YANG)(R&D, Electricité de France, 92141 Clamart, France)Abstract: Grid Power Quality Commitments in France are introduced, including the Power Quality Commitments of TransmissionSystem Operator (TSO) and the Power Quality Commitments of Distribution System Operator (DSO). Undertaking the commitments,TSO and DSO are using connection rules to take into account and minimize the impact on power quality of each customer (load ordistributed generation) in the way of contracts. The practice of these contracts shows that a good overall power quality can only beachieved by respecting commitments and doing effort from both of grid and customer sides. For grid disturbance assessment, it issuggested to use multi-phase harmonic injection method with fundamental power flow. This method can give an acceptable resultswith very short computing time for non-linear load modelling. The key point of proposed frequency domain method is that eachharmonic source is individually considered as both disturbance source and disturbance receiver in order to take into accountinteractions between sources. A plug & play HVDC component has been developed and used in one of two case-studies in the end ofthis article.Key words: power quality commitment; frequency domain modelling; harmonic; power electronic device; HVDC1 Power Quality Commitments1.1 Power Quality Contracts and CommitmentsStandard EN 50160 gives the main voltage pa-rameters and their permissible deviation ranges at the point of common coupling (PCC) in public low volt-age (LV) and medium voltage (MV) electricity distri-bution systems, under normal operating conditions.Based on EN 50160 and the former French power quality contract Emeraude, two new grid access con-tracts have been put into service in France between system operators (utilities) and customers: called CART for transmission customers and CARD for dis-tribution customers, see Fig. 1. These contracts not only set the power quality commitments for the grid operators but also for the customer disturbance emis-sion level.Fig. 1 Power Quality Commitments in CARD and CART8南方电网技术 第3卷The power quality that is handled in grid access contracts includes harmonic, unbalance, flicker, inter-ruption, voltage dip disturbances. Among these dis-turbances, the number of interruption is considered as commitment and others are given as indicative values. 1.2 Power Quality Commitments of Transmis-sion System Operator (TSO)French TSO has the standard and personalized contractual commitments with the customers concern-ing:1) long interruptions (1 per year, 2 per 3 years, 1 per 3 years);2) short interruptions (1 to 5 per year, 1 to 2 per 3 years);3) voltage dips (optional from 3 to 5 per year); 4) RMS voltage magnitude (± 8 %); 5) frequency (± 1 %); 6) voltage unbalance (< 2 %); 7) harmonics ;8) rapid voltage fluctuations, flicker (P lt < 1). For transmission power supply voltage, harmonic limits have been set (Tab. 1). These limits are meas-ured by 10 min mean value at each harmonic voltage (h ≤ 25, the order of harmonics) and total harmonic distortion (THD , h ≤ 40) during 100% of time. For transmission customer, current harmonic emissions are also limited in % compared to contracted rated currenth HRU lim /%h HRU lim /%h HRU lim /%5, 7 2.0 3 2.0 2 1.5 6.0 11, 13 1.5 9 1.0 4 1.0 6.0 171.015, 210.5> 40.56.019 1.0 6.0 23, 25 0.76.01.3 Power Quality Commitments of DistributionSystem Operator (DSO)The Tab. 3 shows the contracted voltage interrup-tion values for the four geographical zones.With personalized contracts signed jointly by system operators and customers, it is possible to in-clude some voltage dips in guaranteed power supply quality by network operators.Tab. 2 Transmission Customer Current Harmonic Commitments Odd Order hHRI lim /% Even Oder h HRI lim /%3 4.0 2 2 5, 7 5.04 1.0 9 2.0 > 4 0.5 11, 133.0>13 2.0Tab. 3 DSO Commitments of Voltage Interruptions per Year Interruption DurationZone 1 Zone 2 Zone 3Zone 4≥ 3 min6 3 3 2 > 1 s and < 3 min301032As grid commitments (Tab. 4), harmonic limits have been set for distribution power supply voltage. These limits are measured by 10 min mean value ateach harmonic voltage (h ≤ 25) and total harmonic distortion (THD , h ≤ 40) during 100% of time. For distribution customer, current harmonic emissions are also limited in % compared to contracted rated current (Tab. 5).Tab. 4 Distribution Voltage Harmonic Commitments Odd Harmonic OrderNot-Triplet Triplet Even HarmonicOrderTHD lim /13 3.0 8.0 17 2.0 8.0 19, 23, 251.5 8.0Tab. 5 Distribution Customer Current Harmonic Commitments Odd Order hHRI lim /% Even Oder h HRI lim /%3 4.0 2 2.0 5, 7 5.04 1.0 9 2.0 > 4 0.5 11, 133.0>13 2.0第3期杨显军:法国电网电能质量承诺和电能质量评估 9For more detail of the power qualify commit-ments of TSO and DSO, please see the following web site: /.1.4 Customer Load ConnectionIn order to meet their power quality commitments, TSO and DSO are using connection rules to take into account and minimize the impact on power quality of each customer (load or distributed generation). DSO has set up a number of technical referential documents and studying tools for load connection. Before per-forming a load or a DG connection, DSO undertakes three level’s studies which are based on standards and site measurements. The aim is to anticipate the possi-ble disturbances which may be provoked by the equipment to be connected and to determine the most adaptive Point of Common Coupling (PCC). Follow-ing these steps, DSO can ensure the optimal perform-ance of the network for all users.The first level study includes identifying the main characteristics of the installation to be connected and effectuating a global analysis. The second level con-sists of evaluating particularly the disturbances. The third level is composed of a detailed study on the iden-tified disturbances. In wind mill connection, this study is based on the standard IEC 61400-21 which evalu-ates the impact in terms of power quality [1].1.5 Power Quality Indices and Evolution ofCommitmentsIn order to measure the evolution of power qual-ity, DSO calculates a number of criterions based on network parameters. These indicators make it possible to evaluate the needs of power supply infrastructure improvement. The following values have been defined as power quality indicators:1)SAIDI or B-Criterion in France, index of mean duration of interruption for LV customers;2)SAIDI for MV customers weighted by the supplied power;3)SAIFI, indices of mean number of interrup-tion of the network, for the long interruption (t id > 3 min), the short interruption (1 s≤ t id≤ 3 min) and the very short interruption (t id < 1 s) . 2 Harmonic Source Modelling and GridDisturbance Assessment2.1 Simulation MethodFrequency domain analysis uses an admittance matrix system model developed from individual com-ponent level models connected according to system topology. The development of admittance matrix mod-els is based on multi-port network theory. Linear grid components are similarly developed from multi-port admittance parameters.In frequency domain simulation, harmonic gener-ating devices are usually modelled by current sources and the whole system admittance matrix is resolved from a start frequency to an end frequency with a fixed or variable frequency step. The deficiencies in the current source method can be partially overcome using a technique that has come to be known as “harmonic power flow”. More often, a fundamental frequency power flow solution is executed using a linear model for all power delivery equipment and loads, and the resultant fundamental frequency load terminal volt-ages are used to “adjust” non-linear load harmonic current vectors automatically without additional user action. However, in frequency approach, initial har-monic current patterns are still required to be known for each nonlinear load.2.2 Harmonic Source ModellingHarmonic model based on a constant current source, see Fig. 2(a), can’t represent real harmonic currents generated by a power electronic device con-nected to an actual network.Fig. 2 General Structure of Three Phase Harmonic Source ModelThe method (a) is too simplified because actual harmonic current of an electric device is always con-10南方电网技术 第3卷trolled by network configuration. In order to overcome this drawback, we have developed multiphase har-monic model with a voltage vector controlled current source and a frequency-variable impedance to repre-sent an actual harmonic source, see Fig. 2(b). In pro-posed method (b), J (f ) is a current source controlled by the fundamental voltage crossing frequency-variable impedance Z (f ). Z (f ) represents the behaviour of the power electronic device towards harmonic distur-bances coming from power supply side.The method (b) is detailed in the following para-graphs.Equivalent harmonic current source of a nonlin-ear load is generated by two main steps: the initial cur-rent J 0(f ) and the corrected current source J (f ) by load-flow. In parameter setting before simulation, the initial J 0(f ) is defined by pre-designed waveform pat-tern, rated power and rated voltage of the load. In fre-quency domain, J 0(f ) is represented by the followingformula:00()()cos()k kJ f J k k t ωφ=⋅+.The pre-designed waveform patterns include cur-rent waveforms generated by the most usual distur-bance sources such as 6-pulse and 12-pulse rectifiers, dimmers, arc furnaces, etc. The following procedure summarizes the proposed source modelling method:1) Choosing a pre-designed waveform (database, analytical formulas, wave form generated by Excel data sheet, empirical data table, on-site measurements) which represents the current harmonic distortion to be used;2) Refining the waveform by particular working state of the device. For example, by switching angle of rectifier and by short-circuit power of upstream net-work;3) Spectrum calculation of the refined wave-form by means of Fast Fourier Transform;4) Calculation of the designed fundamental current and phase angle between voltage and current from rated electric values of the device: voltage, pow-ers P and Q ;5) Pre-design of the harmonic spectrum at rated current and creation of a voltage controlled current source model for frequency domain simulation J 0(f ), see example in Fig. 3 for the used current pattern of a 12-pulse rectifier.Fig. 3 Current Waveform and Harmonic Spectrumof a 12-Pulse RectifierDefine the source impedance Z (f ) as a function of frequency. Z (f ) reflects the device behaviour to the disturbances coming from power supply side.For particular case, it is very important to define Z (f ) values within the studied frequencies. For instance, a static converter’s impedance was set an infinite value in the past in performing inter-harmonic studies. This is not true for a number of static converters. Some in-dustrial cases show the ripple control signal at 175 Hz can be partially absorbed by a rectifier with a capacitor filter as in a variable-speed drive [2].The proposed harmonic source model behaviours as follows: when the source J (f ) is activated, imped-ance Z (f ) is naturally set to an infinite value because the device behaviours as a current source. When the source J (f ) is not activated, Z (f ) has to be added into the system admittance matrix. In this case, the device behaviours as a passive component. Value of Z (f ) is defined case by case in accordance with studied phe-nomena:At fundamental frequency, Z (f ) is calculated from rated voltage and powers P , Q of the simulated device.第3期杨显军:法国电网电能质量承诺和电能质量评估 11At studied harmonic or inter harmonic frequen-cies whose source comes from the power supply side, Z(f) can be defined from the real response of the de-vice at these frequencies. Z(f) is depending on device structure, it can be modelled by series (or parallel) RL, RC circuits, by mixed model of CIGRE 36.05[3] or by a data table for irregular cases.If it is difficult to define a general analytical for-mula representing Z(f) for all studied frequencies. For studying a specific frequency, a simple solution is to perform a time domain simulation on the power elec-tronic device in order to obtain the impedance re-sponse. For example, at ripple control frequency of 175 Hz, the equivalent impedance at input of a recti-fier changes with the type of the rectifier structure, DC bus filter, AC filter and rectifier control techniques. A time domain simulation shows that for a 400 V, 250 kV A diode rectifier used in a variable-speed drive, the impedance at 175 Hz (Z175) is mainly determined by the DC bus type: Z175 = (0.1 ~ 0.9) × Z50 for a capaci-tive DC filter, and Z175 = (0.8 ~ 3) × Z50 for an induc-tive DC filter (Z50 is the rated fundament equivalent impedance) [2].2.3 HVDC Link Frequency Domain ModelAn High V oltage DC link (HVDC) model has been studied in frequency domain and a plug & play HVDC component has been created by using studied harmonic source models. A general HVDC link is composed of two power electronic devices (converter stations): one works as rectifier and another as inverter (or generator), see Fig. 4.Fig. 4 HVDC Link Structure between Two GridsThe studied HVDC component is decomposed in Fig. 5. Each side of HVDC is composed of a three-phase controlled harmonic current source with 74 harmonic number, an impedance and a regulator for power regulation. Two current sources are independent and each current source is synchronized with con-nected fundamental voltage after fundamental fre-quency load flow. This model can simulate independ-ently power quality and electromechanical transient phenomena of each side of HVDC link such as har-monic, reactive power, voltage fluctuation, etc. One case study below will show the application of pro-posed model.Fig. 5 Structure of Frequency Domain HVDC Model2.4 Power Quality Meter ModellingFor a power quality software, PQ meter algorithm is also a key component to think about. A general power quality software that gives just the harmonic spectrum is not enough for a site engineer to perform grid disturbance assessment in a short delay. In fact, the software needs to spend a lot of time in post-data processing in order to get necessary PQ values such as inter-harmonic, harmonic grouping, flicker, unbalance, voltage sag, etc. In most commercialised time domain software, there is no integrated power quality meter. Users have to create tool box in post data processing in order to perform grid PQ assessment. Generally, this step is time-consuming.Simulation tools for grid power quality assess-ment should include at least a build-in total harmonic distortion and individual harmonic computation unit. An advanced power quality simulation tool has to in-tegrate other disturbance metering such as in-ter-harmonic, harmonic grouping, IEC flicker meter, etc [4−5]. Tab. 6 gives some electric measurements to be integrated into power quality simulation tools.An advanced power quality meter algorithm has been studied and implanted in our power quality12 南方电网技术第3卷Tab. 6 Electric Measurements Concerning Power QualityBasic Power Quality Values Advanced Power Quality Valuestotal harmonic distortion; individual harmonic magnitude; armonic angle;voltage sag. inter-harmonic level; harmonic grouping; harmonic power; unbalance;flicker level (P st and P lt).software [6−7]. Fig. 6 shows a case study including harmonic and flicker assessments with embedded dis-turbance analyser and IEC flicker meter in a frequency domain software with electromechanical transient analysis. Harmonic distortion and flicker level Pst are displayed directly on the main simulation.Fig. 6 Disturbance Assessment with Embedded PowerQuality Meters in a Simulation Tool3 Case-Studies: Application & ValidationThe developed harmonic source models and power quality meters have been integrated in a power quality simulation tool, which has been used for grid and customer power quality analysis in a number of actual case studies. Two of them are presented here.3.1 Case Study 1: HVDC Link IntegrationA case study has been performed on harmonic level assessment and voltage improvement upon future HVDC integration to two existing grids. The study has been done using software ExpertEC [8−9] (a frequency domain software with electro-mechanical transient analysis) embedded with the developed numeric HVDC model and power quality meters. This software reads directly the substation databases and converts relative grid data into electric circuit models (Fig. 7). Current harmonic patterns at each HVDC converter station have been modelled by both simplified theo-retical data and on-site measurements offered by a manufacturer. The studied HVDC link is inserted be-tween grid 1 and grid 2 modelled by the following parameters:1)Grid 1 — short-circuit power 5 GV A, total number of nodes 1 100;2)Grid 2 — short-circuit power 1 GV A, total number of nodes 320;3)200 MW of HVDC power flow from grid 1 to grid 2;4)Frequency domain simulation: 50 ~ 3 150 Hz;5)Time step in voltage regulation 20 ms.Fig. 7 Simulated Harmonic Levels in Two GridsHVDC Option 1: Thyristor-based HVDC. Con-verter station is composed of 12-pulse rectifier + sim-plified harmonic filters with current harmonic distor-tion THD = 3.2% (Fig. 8).Fig. 8 Current Waveform and Harmonic Spectrum at Input ofThyristor-Based HVDC Converter StationHVDC Option 2: In the same grid conditions, the two converter stations are replaced by IGBT-based con-verters + harmonic filters. In this case, the current har-monic distortion TDH will be lower than 1.2% (Fig. 9).Fig. 9 Current Waveform and Harmonic Spectrum at Input ofIGBT-Based HVDC Converter Station第3期杨显军:法国电网电能质量承诺和电能质量评估 13For these two HVDC options, voltage harmonicassessment has been performed in all nodes of twogrids from 50 to 3 150 Hz. The simulation resultsshow after insertion of the HVDC option 1 (Thyris-tor-based HVDC with simplified AC filters), the totalvoltage harmonic distortion in two grids becomes toohigh (THD > 3.79%) compared to the planning level ofTHD < 3% defined by IEC 61000-3-6. The simplifiedfilters are not enough to reduce current harmonics in this case. The results from HVDC option 2 (IGBT-based HVDC) gives satisfaction: voltage har-monic levels in two grids are 0.35% for grid 1 and 0.71% for grid 2. These results mean that the integra-tion of this HVDC link will not deteriorate substan-tially harmonic levels of the two grids. This HVDC solution could be taken in consideration.Tab. 7 Total Voltage Harmonic Distortion (225 kV Level)Name of Grids Option 1, THD Option2,THD Grid 1 3.79% 0.35%Grid 2 5.91% 0.71%3.2 Case Study 2: Harmonic Current Assess-ment at PCCAnother case study has been performed on a point of common coupling (PCC) of two industrial sites. Site 1 has an important harmonic source (3 MW, power electronic devices). Site 2 has mainly linear load (induction heating by fundamental frequency) no important harmonic source but there is a very impor-tant capacitor bank for var compensation (Fig. 10).Some simulations have been done in order to confirm site engineer’s first assumption: 550 Hz har-monic source is inside site 1 although at PCC the har-monic current measured at feeder 1 is lower than that of feeder 2. Former measurements show that upstream back ground harmonic voltage at PCC is negligible if these two sites are switched off. Simulation results show that overall harmonic power flow at feeder 1 comes from downstream as the harmonic power is negative (Fig. 10). And the overall harmonic power flow at feeder 2 comes from upstream at the feeder 2 (the harmonic power is positive).Fig. 10 Simulation of Harmonic Resonance at 550 HzThis phenomenon is caused by harmonic reso-nance around 550 Hz between capacitor bank and up-stream impedance. Fig. 11 shows harmonic impedance magnitude at PCC.Fig. 11 Harmonic Impedance Magnitude at PCC4 ConclusionThis paper gives an overview of power quality commitments in grid and customer sides. Two con-tracts have been put into service in France between utilities and customers. These power quality contracts set not only the power quality commitments for the grid operator but also on the customer disturbance emission level.Generally, frequency domain software is more adequate in doing power quality assessment than time domain software. Two key points should be taken into account in power quality simulation tools: disturbance load models and power quality meter in order to re-duce computation and post processing time.Power quality meter models and three phase harmonic source models have been developed. By means of advanced build-in non-linear components, it is possible to study grid power quality assessment by14 南方电网技术第3卷dealing with non-linear loads either as disturbance sources or as disturbance receivers. As an extension of introduced general harmonic source model, an HVDC component has been built, which is composed of two independent harmonic sources and two regulators.A number of multi phase harmonic source models have been developed and integrated into a power qual-ity software, which has been used in grid harmonic analysis. Two case-studies have shown applications of harmonic source and power quality meters in actual grid power quality assessment.References:[1]NASLIN C, GONBEAU O, FRAISSE J L, et al. Wind Farm Integra-tion — Power Quality Management for French Distribution Network[C]// The 18th International Conference and Exhibition on ElectricityDistribution (CIRED 2005), June 6−9, 2005, Turin, Italy. London:IEE Conference Publications, 2005, 2: 41.[2]YANG X, DENNETIÈRE S. Modeling of the Behavior of PowerElectronic Equipment to Grid Ripple Control Signal [C]// The 7thInternational Conference on Power Systems Transients (IPST 2007),June 4−7, 2007, Lyon, France. [S.l.]: IPST, 2007.[3]O’NEILL-CARRILLO E, HEYDT G T, KOSTELICH E J, et al.Nonlinear Deterministic Modeling of Highly Varying Loads [J].IEEE Transactions on Power Delivery, 1999, 14 (2): 537−542.[4]IEC 61000-4-30:2008, Electromagnetic Compatibility (EMC): Test-ing and Measurement Techniques — Power quality measurementmethods [S].[5]IEC 61000-4-7:2002, Electromagnetic Compatibility (EMC): Testingand Measurement Techniques — General Guide on Harmonics andInterharmonics Measurements and Instrumentation, for Power Sup-ply Systems and Equipment Connected Thereto [S]. [6]IEC 61000-4-15:2003, Electromagnetic Compatibility (EMC): Test-ing and Measurement Techniques — Flickermeter — Functional andDesign Specifications [S].[7]YANG X. Methodology and Simulation Tool for Flicker PropagationAnalysis [C]// EPRI Power Quality and Applications (PQA) 2006and Advanced Distribution Automation (ADA) Joint Conference,Marriott Marquis, Atlanta, Georgia, USA, July 24−26, 2006.[8]YANG X, BERTHET L. Methodology for Frequency Domain Dis-turbance Source Modelling for Multi Source Harmonic and In-ter-harmonic Studies [C]// The 12th International Conference onHarmonics and Quality of Power (ICHQP), Cascais, Portugal, Octo-ber 1–5, 2006.[9]YANG X. Advanced Methodology and New Tool for MultiphasePower Quality Analysis & Mitigation [C]// 18th International Con-ference on Electricity Distribution (CIRED 2005), Torino, Italy, June 6−9, 2005.Received date:2009-02-28Biography:Xavier X. Yang (1958−), Male. Dr. Yang received his Electrical Engi-neering Diploma B.S. and M.S. degrees in Liaoning Technology University (China), and received the Ph.D. from National Polytechnic Institute of Tou-louse (France). Dr. Yang was employed in French Electricity and Energy Consulting Companies in which he was in charge of site measurement and power quality mitigation. He is now expert researcher in R&D of Electricite de France (EDF). His research interests are in the areas of electric power system modeling, power system harmonics, computer algorithms, fault detection and voltage sag mitigation. He is a member of IEC SC77A Work-ing Group 1 (Harmonic and flicker) and CIGRE Joint Working Groups B4 (HVDC) and C4 (Review of flicker objectives).E-mail: xavier.yang@edf.fr.收稿日期:2009-02-28作者简介:杨显军(1958–),男。
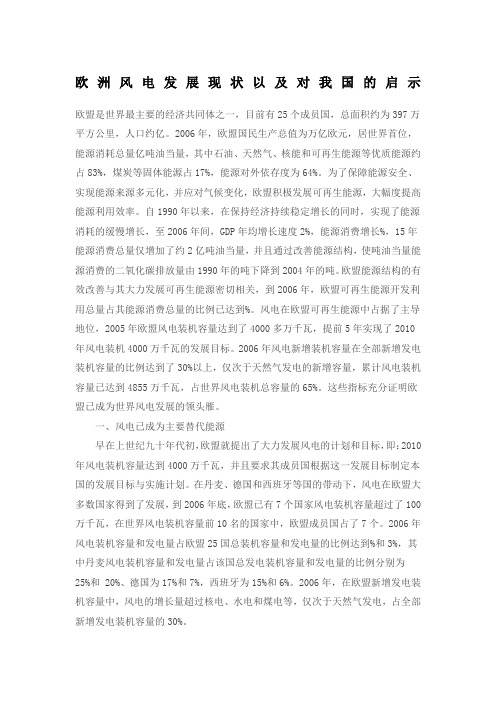
欧洲风电发展现状以及对我国的启示欧盟是世界最主要的经济共同体之一,目前有25个成员国,总面积约为397万平方公里,人口约亿。
2006年,欧盟国民生产总值为万亿欧元,居世界首位,能源消耗总量亿吨油当量,其中石油、天然气、核能和可再生能源等优质能源约占83%,煤炭等固体能源占17%,能源对外依存度为64%。
为了保障能源安全、实现能源来源多元化,并应对气候变化,欧盟积极发展可再生能源,大幅度提高能源利用效率。
自1990年以来,在保持经济持续稳定增长的同时,实现了能源消耗的缓慢增长,至2006年间,GDP年均增长速度2%,能源消费增长%,15年能源消费总量仅增加了约2亿吨油当量,并且通过改善能源结构,使吨油当量能源消费的二氧化碳排放量由1990年的吨下降到2004年的吨。
欧盟能源结构的有效改善与其大力发展可再生能源密切相关,到2006年,欧盟可再生能源开发利用总量占其能源消费总量的比例已达到%。
风电在欧盟可再生能源中占据了主导地位,2005年欧盟风电装机容量达到了4000多万千瓦,提前5年实现了2010年风电装机4000万千瓦的发展目标。
2006年风电新增装机容量在全部新增发电装机容量的比例达到了30%以上,仅次于天然气发电的新增容量,累计风电装机容量已达到4855万千瓦,占世界风电装机总容量的65%。
这些指标充分证明欧盟已成为世界风电发展的领头雁。
一、风电已成为主要替代能源早在上世纪九十年代初,欧盟就提出了大力发展风电的计划和目标,即:2010年风电装机容量达到4000万千瓦,并且要求其成员国根据这一发展目标制定本国的发展目标与实施计划。
在丹麦、德国和西班牙等国的带动下,风电在欧盟大多数国家得到了发展,到2006年底,欧盟已有7个国家风电装机容量超过了100万千瓦,在世界风电装机容量前10名的国家中,欧盟成员国占了7个。
2006年风电装机容量和发电量占欧盟25国总装机容量和发电量的比例达到%和3%,其中丹麦风电装机容量和发电量占该国总发电装机容量和发电量的比例分别为25%和 20%、德国为17%和7%,西班牙为15%和6%。


欧 洲 电 网 的前 景 及 任 务 近年来,中欧联合电网的地理分布图发生了很大变化。
图1所示为截至1996年11月欧洲电网同步运行的联网区域。
该联合电网在原有的西欧发输电协调联盟(UCPTE)中,增加了以下新的成员:德国东部各州(包括柏林在内)和并列运行的中欧电网(Cen2 trel)成员,即波兰、捷克、斯洛伐克和匈牙利。
原南斯拉夫电网在波黑战争期间已经瓦解,有部分电网目前只与阿尔巴尼亚和希腊电网保持并列运行。
原来东欧联合电网(V ES),其成员即原东德、原捷克斯洛伐克、罗马尼亚、保加利亚和原苏联(乌克兰西部电网),现在已经瓦解。
目前仍并列运行的乌克兰和摩尔多瓦电网,不仅与俄罗斯电网、也与原中欧联合电网脱离。
罗马尼亚和保加利亚电网现在采取特殊的做法,它们根据目前的具体情况与现在的南斯拉夫电网和乌克兰电网交替地联网运行。
俄罗斯统一电网在向北和向东延伸,除乌克兰和摩尔多瓦以外,目前波罗的海国家和独联体中的其它国家的电网仍在与其联网运行。
英国和斯堪的纳维亚的联合电网由于隔海,不能与欧洲大陆电网直接联网。
英国电网经过高压直流海底电缆与法国电网相联。
瑞典和挪威也是通过高压直流海底电缆与德国和丹麦电网相联。
芬兰与俄罗斯电网则用背靠背直流换流站联网。
虽然联合电网均以额定频率50Hz运行,但原东欧联合电网和前苏联统一电网的频率调整标准与其不一致,因此目前无法与西欧电网同步并列运行。
西欧联合电网骨干线路的电压等级为380kV,由于电网覆盖区域内的电源和负荷密度都很大,所以该电压等级还会长期存在。
高压直流海底电缆现在采用的最高电压等级为450kV。
1扩大与UCPTE电网同步运行的范围 1990年德国统一之后,德国的两个联合电网很快具备了合并的条件。
由于开始时只是原东德和西柏林电网与西欧电网联网,因而当时东欧电网没有明显的发展。
所以一方面要求原东德电网—现在的联合电力公司(Veag)采取相应的调频措施,另一方面为了保持长期稳定的联网运行,要求建设与原西德电网相联的4条380kV联络线。
电网潮流变化对电网稳定的影响摘要:通过连续潮流法建立潮流方程,获得P-V曲线,并得到负荷点的临界电压和极限功率,从而确定电网潮流变化对电网稳定影响关键因素。
关键词:电网; 潮流变化;电网稳定Abstract: through the continuous tide method to establish the trend equation, get P-V curves, and get the critical load point voltage and limit the power to determine the power grid to electric network flow change stable influence key factors.Keywords: grid; Tide change; Grid stability中图分类号:U665.12文献标识码:A 文章编号:现在各地区电网互联是很普遍的,电网互联可提高电网的稳定性和可靠性,电网之间可以互相支持、互为备用,但是电网互联后成为整体,电网之间很容易相互影响,当电网内一处出现异常或故障时,往往在电网的薄弱处发生连锁性反应,导致系统局部甚至全部崩溃,造成大面积停电。
国际上产生巨大影响的事故有1965年11月9日北美东北部电网大停电事故、1978年12月19日法国大停电事故、2003年8月14日美加大停电事故和2006年11月4日西欧电网大停电事故等[1]。
我国也发生过大面积停电事故,例如1994年“5·25”粤东电网大面积停电事故、1995年“12·15”粤北电网崩溃事故[2]和2006年7月1日华中(河南)电网事故等[1]。
这些事故都造成巨大的经济损失,自然不能等闲视之,从电力技术上分析原因都可归结为局部电网界面输送的潮流超过了暂态稳定极限,导致事故电网内发生振荡,造成事故扩大,再进一步引起内部的统调电源和联络线路相继解列,在多重复杂故障的连续打击下,事故电网最终与系统解列,发生频率崩溃和电压崩溃,所以,研究电网潮流变化对电网稳定的影响确实是非常有必要的。
探讨智能电网调度技术支持系统的电网风险防范措施摘要:从近些年来国内外的所发生的较大的停电事故和的电网的稳定运行的要求来看,电网调度的自动化系统已经成为保证电网安全运行不可缺少的工具。
提出了以智能电网调度技术支持系统为基础,实现对电网调度的精细化管理。
本文主要分析了智能电网调度就是支持系统的电网风险防范措施,进而使得电网能够稳定运行并减少电网的运行风险。
关键词:调度自动化系统电网风险防范措施随着经济和科技的不断发展和进步,各个领域的用电需求也在不断增加,在这种形势下,电网得到了迅速的发展,系统也越来越庞大,这时电网稳定运行的难度也随之增加了。
原因是电网本身是一个极为复杂的系统同时自身具有很多特点:第一,电网石油很多分布在广大区域的不同的元件组成的,同时有通过网络紧密相连在一起;第二,电网的组成具有电压层次结构,而每个层次上的活动对电网都有着不同的影响;第三,电网是一个动态的系统,时刻都在发生在变化,而且变化的状态和短暂,一个事故可能在很短的时间之内就可以发生并且能迅速波及到整个电网,因此对电网的实时控制要求很高;第四,电网长期会受到外界环境以及人为因素的干扰,随时都有可能引起大规模的停电事故。
为了使得电网能够稳定的运行并且减少运行风险,就必须要不断的提高电网实时调度的自动化水平,进而实现电网调度管理的高度精细化,通过开发出具有强大功能的职能电网调度技术支持系统个,可以实时对一些重要的断面进行扫描和分析,对电网运行中的一些薄弱环节进行捕捉,进而对电网在正常运行中的问题提前进行预警,以提供科学合理的对电网的安全进行调整的策略,使得电网能够稳定安全的运行。
1、有关国内外的较大的停电事故从二十一世纪初期以来,在国内外发生了多起重大的停电事故,而且这些停电事故都是由于电网系统中的元件发生的故障,进而对其它的元件造成的影响,这些反应迅速蔓延,最终使得整个电网瘫痪,给某些区域造成了严重的影响。
1.1 欧洲电网停电事故在两千零六年九月十八日,某造船公司向德国某电力公司提出了停运一双回路线路的申请,该电力公司进行了安全校核之后,批准了该申请。
国际典型电网组织架构的比较作者:王馨尉龚雁峰来源:《中国新通信》2017年第06期【摘要】本文选取了美国、英国、法国和日本作为国际典型的电网组织架构,分别对其结构及发展历程进行了详细的说明,为我国电力市场化改革提供了宝贵经验,具有借鉴意义。
【关键词】组织架构垂直一体化可靠性委员会厂网分开一、美国美国电网结构比较复杂,从组织架构上看,可分为从上到下可分为四级:北美电网可靠性监管公司(NERC)、各区域可靠性监管机构(如WECC,SERC 等等)、各地区独立电网运营公司(如CAISO 等等)、局部地区电力公司(PG&E 等等)。
北美电力可靠性公司(NERC),总部设在佐治亚州亚特兰大市,是一个非营利性公司,成立于2006年3月28日,其前身是北美电力可靠性委员会(NERC),成立于1968年6月1日。
无论是之前还是如今的 NERC,其使命都是确保北美电力系统的可靠性。
NERC 下属9个区域性可靠性委员会,按地域划分为:佛罗里达州可靠性协调委员会(FRCC),中西部可靠性组织(MRO),东北电力协调委员会(NPCC),Reliability First 公司(RFC)(中部),可靠性公司国家电力监管委员会(SERC)(东南部),西南电力联营公司(SPP),西部电力协调委员会(WECC),德州电力可靠性委员会(ERCOT)和阿拉斯加系统协调委员会(ASCC)。
二、英国在英格兰和威尔士,原中央发电局拆分为3个发电公司和一个输电公司,三个发电公司分别是国家电力公司(National Power),电能公司(Powergen)和核电公司(Nuclear Electric),输电公司为国家电网公司(National Grid Company)[1]。
国家电力公司和电能公司于1992年实施私有化,成为股份公司,政府现只拥有40%的股份。
国家电网公司主要经营输电系统,是电网的系统调度员,拥有、管理、维护超高压输电系统(400kV和275kV两个电压等级),为发电商和英国与法国、苏格兰的联络线提供输电服务,并配合配电公司为电力市场参与者提供一个良好的竞争环境。
关于对法国、西班牙电网的调研报告×××××××××××2013年10月目录摘要 (3)1 法国、西班牙的电网概况 (4)1.1法国电网概况 (4)1.2西班牙电网概况 (5)2电网的安全生产 (6)2.1法国电网安全及特点 (6)2.2西班牙电网安全 (8)3 电力市场情况 (8)3.1法国电力市场 (8)3.2西班牙电力市场 (10)4 主要体会和启示 (11)摘要在欧盟的能源需求结构中,石油占41%,天然气占23%,煤占15%,核能占16%,可再生能源占6%。
在以石油和天然气作为主要的发电能源结构的情况下,发电装机的增量或存量调整主要依赖新能源或可再生能源。
而且欧洲很重视环境保护和可再生能源发电的发展,在这种能源政策的引导下,欧盟理事会能源政策的中心目标是发展风能、水电、太阳能和生物质能等可再生能源。
法国电源装机以核电和水电为主。
在2006年中:核电6330万kW,占54.5%;火电2480万kW,占21.4%;水电2550万kW,占22%;可再生能源240万kW,占2.1%。
全年发电量5491亿kWh。
法国是欧洲能源的主要出口国。
而在西班牙,风力发电在西班牙电力生产中占有非常重要的地位,从装机容量上看,2009年风电占全部的20%,高于水电(18%)、煤电(12%)和核电(8%)等;从实际电力生产来看,风电达13.8%。
太阳能发电无论是装机容量(3.7%)还是实际生产(2.6%)都远远低于风力发电。
因此,研究法国和西班牙的电网技术对我国的电网的发展具有很大的借鉴和学习意义。
1 法国、西班牙的电网概况1.1 法国电网概况法国电力集团公司( EDF)已按照厂网分开、输配分开、配售分开进行了改革。
目前,发电和交易、售电业务已经解除了管制;输电网和配电网由政府管制。
输电网由EDF公司的全资子公司法国输电网公司(RTE)负责管理400 kV、225 kV、90 kV、63kV电网;配电网由EDF公司的全资子公司法国配电网公司(ERDF)和157个地区运行商负责20kV、0.4kV电网的管理,其中:配电网的资产属于地方政府所有,以合同方式特许ERDF进行管理。
法国EDF集团的发电工程业务主要由三大部分组成:核能、可再生能源以及化石燃料。
1)核能业务的主要发展目标是:(1)持续提升安全性以及辐射防护;(2)提高核电站运行水平;(3)核废料处理。
截至2010年底,EDF共有7,430万千瓦的核电装机容量;全球共有78个核反应堆,其中法国58个,英国15个,美国5个;3个EPR技术的反应堆正在法国和中国建造。
2)EDF可再生能源业务主要分为水力发电以及其他可再生能源两大部分。
水力发电业务目标是:(1)持续提升安全性;(2)合理分配水资源以及应对影响;(3)在高增长国家发展水力发电。
其他可再生能源业务的主要目标有:(1)推广本地接纳能力;(2)整合间歇性电源并网发电。
截至2010年,EDF共有2,150万千瓦的水电装机容量以及330万千瓦的其他可再生能源装机容量(其中主要为风能,270万千瓦)。
EDF在法国共有640个大坝,并有一个大型水坝于2010年在老挝破土动工。
3)化石燃料发电业务的主要目标是:(1)保护空气、水源和土壤;(2)改进发电机组;(3)捕获并储存碳;(4)全球范围内共有化石类装机容量3,480万千瓦。
1.2 西班牙电网概况西班牙电网公司(Red Eléctrica de España)成立于1985年,负责西班牙全境所有电站发电的收购、输送和分配,是世界上第一家对风能、太阳能等可再生能源的发电和并网进行实时监控的公司。
该公司最大的股东是西班牙工业参股公司(SEPI),拥有20%股份,其余股份在股市上自由交易,股东包括国内外金融机构以及个人投资者,该公司是IBEX35股指的样本股,2010年底市值约47.79亿欧元。
根据西班牙法律规定,SEPI对电网公司的持股比例不得低于10%,其他股份比例不得超过5%,由此确保西班牙政府对于全国电力运营的控制权。
该公司对于全国电力发电和输送的控制主要通过CECOEL(电力控制中心)和CECRE(可再生能源控制中心)两个中心完成的。
由于电能无法大量储存,因此确保电力的消耗与生产在任何时候都处于平衡状态非常重要。
CECOEL的主要工作就是确保这一平衡。
CECOEL研发的电力使用情况预测程序达到了很高的准确度,最长可预测未来一周之内的电力使用情况。
CECOEL将预测情况根据实际用电量进行调整,并在考虑与其他国家电网联网情况后,通过专用网络向发电厂实时下达增加或减少发电量的指示,以确保发电与用电的匹配平衡。
在有如某条输电线路故障等突发事件发生时,也可随时发出调整发电的指令。
严格说来,CECRE是CECOEL的一部分,是风力等可再生能源发电厂和CECOEL 之间联系的桥梁。
风力发电在西班牙电力生产中占有非常重要的地位,从装机容量上看,2009年风电占全部的20%,高于水电(18%)、煤电(12%)和核电(8%)等;从实际电力生产来看,风电达13.8%。
太阳能发电无论是装机容量(3.7%)还是实际生产(2.6%)都远远低于风力发电。
可再生能源发电、尤其是风力发电最大的问题之一就是没有传统发电方式稳定,主要原因是原始动力(风力、日照等)不够稳定,很多时候无法准确预测,甚至有时候由于“压力空洞”(huecos de tension,指风压突然消失又在很短时间内恢复)等原因造成风机突然中断供电。
因此,对于风电厂输电的实时监测和控制显得更加重要。
通过CECRE,西班牙成为世界上第一个把所有装机容量超过10兆瓦(MW)风电场都纳入控制中心管理和监控的国家。
西班牙电网公司的输电网络与法国、葡萄牙、安道尔和摩洛哥的电网连接,可根据需要将电力与上述国家输入和输出。
近两年与上述四国电力交换情况如下表所示:表1-12电网的安全生产2.1 法国电网安全及特点在2011年10月7日,法国德龙省特里卡斯坦核电站的一个液压泵发生爆炸,3名工作人员溅到了放射性污水。
法国电力公司21日在新闻发布会上向法国核安全局提议成立一个快速反应小组,以应对类似日本福岛第一核电站事故的紧急情况。
法国电力公司国内核电生产负责人多米尼克米尼埃尔说,法国电力公司目前的事故处理能力只能应对一座核反应堆,如果发生类似日本福岛第一核电站这样的事故,多座核反应堆同时受损,公司将无力应对,所以有必要尽早成立快速反应小组。
米尼埃尔说,快速反应小组应由各部门相关技术人员组成,并配备临时发电和供水装置,可以在事故发生后24小时至48小时内迅速做出反应,向发生事故的核电站和核反应堆提供全方位支持。
法国电力公司同时提议核安全局重新对核事故应对能力进行评估,并对核电站进行更为严格和深入的检查,最大程度确保法国境内核电站的安全。
为避免频繁出现大面积断电事故,法国做出必须及时对电力设施进行必要的更新,同时还要提高电力管理系统对故障的反应速度。
法国电力公司董事长鲁斯利说,美国、英国和意大利等最近出现大面积断电事故的国家有一个共同点:电网设施陈旧,有关经营管理者对电力设施的更新投入不足。
电力设施如果不及时更新,一旦出现事故损失就非常巨大。
此外,电力管理也很关键。
要避免出现大面积断电事故,就必须在几秒种内对任何电力故障作出反应。
这就需要电力管理系统拥有相应的阻断事故和故障的设备,以及良好的监控体系。
另一位负责人对记者说,法国高压线路都有自动断电保护装置,如果线路因雷击等原因中断,在千分之几秒后即可恢复正常。
此外,法国电力系统配有完善的“安全阀”装置,一旦出现断电事故,可以防止事态进一步扩大。
法国电力公司下属输电网集团控制中心主任拉费此前曾说,许多国家为了输电方便,电网间都互相交结联网,而电网互连的国家都存在大面积断电危险。
导致大面积断电事故的原因很多,电网超负荷工作和发电厂运转出故障是最主要的两个原因。
对前者,只有通过不断建设新输电网才能降低断电风险;而对后者,就需要有特殊的应急措施才能解决。
法国电网有以下几个特点:(1)与西欧电网( UCPTE)联网运行,有20条交流400kV线路、13条交流225kV 线路和一条直流±270kV线路分别与比利时、德国、瑞士、意大利、西班牙、英国的电网互联。
能保持全国7个地区(北区、诺曼底·巴黎区、东区、罗讷·阿卑区、地中海区、西南区和西区)电网间的负荷平衡。
各地区内的电力生产和消费也都能尽量保持平衡。
(2)电网结构有很强的抗事故能力。
由400kV输电线路为网架,以巴黎为中心, 形成了双层网和3层网,输电线路多采取单回路布置,发生多重的重大事故的可能性较小。
(3)变电设备的设计裕度较大。
每座变电所都接有多回路引入线(最少2回) , 并装有备用变压器,可自动切换。
法国电网的运行由总调度中心和7个地方调度中心分工管理。
总调度中心负责225kV以上电网的运行监视、记录、频率调整和电力潮流控制,各地区的发电量调整和经济分配, 国际电力交换的协调等。
7个地区分别设有( 里尔、鲁昂、南锡、里昂、马赛、波尔多、南特等) 调度中心, 负责各地区内的发电量和用电量的平衡;电压、频率和无功的控制和调整;对电网事故处理、发布操作指令;汇集地区电网运行的全部信息,传送给总调度中心,或将有关信息传送给电厂和变电所。
这些特点都与法国电网的安全紧密相连。
并且法国电力公司对所有安全重要事件进行分析;找出发生事件的根据;和及时采取相应的纠正措施。
法国电力公司就是根据这些分析制定行动计划的,并对如下若干方面进行了改进: 维修工作的质量;运行小组的核安全组织;建造和运行之间的衔接;以及分包商人员的安全文化等。
使得法国电网安全、稳定的运行。
2.2西班牙电网安全在2004年,西班牙首都马德里市中心以及南部地区18日下午因一变电站发生火灾导致大面积停电,25万市民处于黑暗之中。
这是马德里今年发生的第3次重大停电事故。
据马德里市政府提供的消息,马德里市区普拉塔变电站先是发生火灾造成断电。
随后,其他几个相关的变电站也发生停电。
马德里部分地铁停驶,公共交通也一度陷于混乱。
据警方透露,有2人在火灾中受轻伤。
马德里市政府发言人还说,这是一起因技术问题而发生的停电事故,不是人为的破坏,也不是恐怖活动。
马德里市政管理今年连续发生事故。
6月份,马德里市中心曾经因一变电站发生火灾造成停电,使1万市民受到影响。
再加上刚入夏不久,西班牙就出现了供电不足的现象。
据报道,西班牙南部和西部地区28日的气温超过了40摄氏度。
同时,该国的用电量也刷新了历史纪录。
经过数天的高温考验,西班牙电网不堪重负,29日停止了部分地区的电力供应。