IELTS Writing Task 1--by simon
- 格式:doc
- 大小:44.00 KB
- 文档页数:5

simon的雅思小作文模板英文回答:Task 1 Bar Chart。
The bar chart visually presents the data on the number of students enrolled in various degree programs at a university in the years 2020 and 2021. From the chart, itis evident that there has been a significant increase in the enrollment of students in most of the programs over the two-year period.In 2020, the program with the highest number of students was Business Administration, with 2,500 students enrolled. This was followed by Arts, with 2,000 students. In 2021, Business Administration continued to attract the most students, with a notable increase in enrollment to2,800. Arts also experienced a rise in enrollment, with2,200 students.Other programs that showed an increase in enrollment include Engineering (from 1,500 to 1,800), Law (from 1,200to 1,400), and Science (from 1,000 to 1,200).However, there was a decline in enrollment in two programs: Education and Nursing. Education saw a drop from 1,800 students in 2020 to 1,600 in 2021. Nursing also experienced a decrease, from 1,400 students to 1,300.Task 2 Essay。
IELTS Writing Task 1: describe a processHere is some more advice for describing a process diagram. The question I'm using comes from Cambridge IELTS 6. It's also on this website(go down the page to test 3).Advice:1.Introduction: paraphrase the question statement (one sentence).2.Summary paragraph: write how many steps there are in each of the2 diagrams. You could also mention the first step and the last stepin each process (two sentences).3.Details: describe each step in the diagrams. We'll look at this nextweek.Here's my example introduction and summary paragraph:The figures illustrate the stages in the life of a silkworm and the process of producing silk cloth.There are four main stages in the life cycle of the silkworm, from eggs to adult moth. The process of silk cloth production involves six steps, from silkworm cocoon to silk material.Can you see the paraphrasing I have used? Next week we'll work on describing the stages in each process.paraphrasing:diagrams=figuresshow=illustratestages=stepsthe life cycle of the silkworm=the stages in the life of a silkworm production=process of producing...=process of ...production.there are ...stages=...involves ...steps.Hello Simon,I hope the paraphrasing aboved is correct. I enjoy you daily lessions very much. I am preparing for the IELTS test, and your lessons help me a lot. Thank you very much.Here I have some qustions about this lession. The following is my sentence:There are six stages in the process of silk cloth production, beginning with selecting cocoons. Then the qualified cocoons will* be boiled, unwind into* thread, and the thread will be twisted and finally weaved.My first question is that should I use future tense (will be boiled....) or present simple tense (is boiled)?The second question is that which preposition should i use? (the qualified cocoons will be unwind into* thread: should I use "into") ?I am looking forward to your reply. Thanks again.Best wishesTheresaHi Theresa,Your paraphrasing is perfect. Here are the answers to your questions:1. I would use the present simple to describe processes e.g. "The selected (not 'qualified') cocoons are boiled."2. I would avoid trying to use a preposition - I'd find another way to describe it e.g. "The cocoon is unwound, leaving a single thread". Or, "it is then possible to unwind the cocoon in order to have a thread of silk."Hope this helps,SimonWhen describing stages in a process:1.Start at the beginning. Use words that clearly show the stages (e.g.firstly, at the first stage, after that, next, following this,finally).e the present simple tense.e the 'active' when someone or something does the action (e.g.the moth lays its eggs).e the 'passive' when it is not important to say who or what doesthe action (e.g. the silk cloth is dyed).Here are some example sentences from last week's question: The life cycle of the silkworm begins when the moth lays its eggs.∙After 10 days the silkworm larva is born, and 4 to 6 weeks later the larva produces silk thread.∙At the first stage in the production of silk cloth the cocoon is boiled in water.∙Next, the silk thread is unwound and twisted.∙It is then dyed, to give it colour, or woven to make cloth and then dyed.I have highlighted the passive verbs and the words that mark stages.Advice: you can avoid difficult passive verbs like 'unwound' or 'woven' by writing 'it is then possible to unwind' or 'the thread is then ready for weaving'.IELTS Writing Task 1: describe a tableToday I'm going to look at a question from Cambridge IELTS book 5 (page 98). You can see the question and an example answer on this website.The problem with the example answer is that it is long (233 words) and quite complicated. I'm going to suggest some changes, starting with the introduction and summary paragraph.1. Introduction. Paraphrase the question (make small changes):∙The table shows data about the underground rail networks in six major cities.2. Summary paragraph. Look for the most noticeable feature or main trend:∙The table compares the six networks in terms of their age, size and the number of people who use them each year. It is clear that thethree oldest underground systems are larger and serve significantlymore passengers than the newer systems.Next week I'll add the final paragraphs.Last week I wrote the introduction and summary paragraph for this question. The example answer on the website is good, but it's 233 words long, it contains a few mistakes, and it's a bit complicated.I've now written the full essay. I've followed my usual 4 paragraph structure (see previous Task 1 lessons) and I've tried to make the essay clear and simple.I'd give my essay a band 9, but maybe I'm biased! Please let me know if you find any mistakes in my writing (nobody's perfect), or ask if anything is unclear.Describe a table (Cambridge IELTS 5, page 98)The table shows data about the underground rail networks in six major cities. The table compares the six networks in terms of their age, size and the number of people who use them each year. It is clear that the three oldest underground systems are larger and serve significantly more passengers than the newer systems.The London underground is the oldest system, having opened in 1863. It is also the largest system, with 394 kilometres of route. The second largest system, in Paris, is only about half the size of the London underground, with 199 kilometres of route. However, it serves more people per year. While only third in terms of size, the Tokyo system is easily the most used, with 1927 million passengers per year.Of the three newer networks, the Washington DC underground is the most extensive, with 126 kilometres of route, compared to only 11 kilometres and28 kilometres for the Kyoto and Los Angeles systems. The Los Angeles network is the newest, having opened in 2001, while the Kyoto network is the smallest and serves only 45 million passengers per year.(185 words)Analysis of this essay:∙ Simple paragraph structure: Introduction, summary paragraph, one paragraph about the 3 older systems, one paragraph about the 3newer systems.∙ Select key information: There is too much information to include in ashort essay. I found it difficult to write less than 185 words. Notice that Itried to include only one (sometimes two) statistics for each city.∙ Compare as much as possible: e.g. London is the oldest and largest; Paris is about half the size but serves more people.∙ Commas: Notice how I use commas to add extra information e.g. “…isthe oldest system, having opened in…” I often use the word “with” aftera comma to add a figure to the end of a sentence e.g. “…is the mostused, with 1927 million passengers.”ModelIt is a nice piece of writingI have tried one.The table reveals information on the Underground railway station among six cities during two centuries.As is shown by the table, London, the oldest railway system, has by farthe longest distance with 394 km, closely followed Paris, the second oldest underground railway , with 199 km, or equaling a haft distance of London system. This then preceded the opening of the railway system in Tokyo, Washington DC, Kyoto and Los Angeles.Interestingly, although Tokyo has the middle position as regards the kilometers of route with 155 km, it appears to be the highest system used by passengers, with 1927 million. This number is considerably higher than that of both Paris and London. These figures are 1191 and 775, respectively.Surprisingly, Kyoto and Los Angeles have the lowest number of either kilometers of route and passengers per year. In fact, the number of passengers using both of them is a great deal less than that of Washington DC, with approximately three times less , while the distance of Kyoto and Los Angeles railway system is negligible (ranging from 11 to 28).In conclusion, London has the highest number of kilometers of route, while Tokyo occurs to be the successful railway system with the overwhelming majority of passengers(193 ws)IELTS Writing Task 1: comparing (bar charts)。
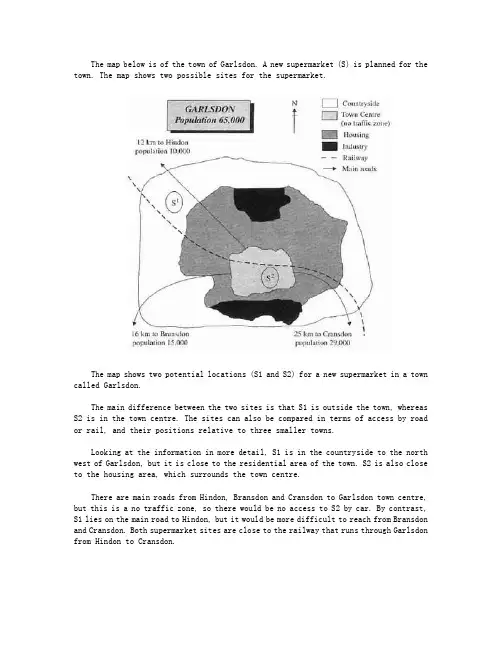
The map below is of the town of Garlsdon. A new supermarket (S) is planned for the town. The map shows two possible sites for the supermarket.The map shows two potential locations (S1 and S2) for a new supermarket in a town called Garlsdon.The main difference between the two sites is that S1 is outside the town, whereas S2 is in the town centre. The sites can also be compared in terms of access by road or rail, and their positions relative to three smaller towns.Looking at the information in more detail, S1 is in the countryside to the north west of Garlsdon, but it is close to the residential area of the town. S2 is also close to the housing area, which surrounds the town centre.There are main roads from Hindon, Bransdon and Cransdon to Garlsdon town centre, but this is a no traffic zone, so there would be no access to S2 by car. By contrast, S1 lies on the main road to Hindon, but it would be more difficult to reach from Bransdon and Cransdon. Both supermarket sites are close to the railway that runs through Garlsdon from Hindon to Cransdon.。
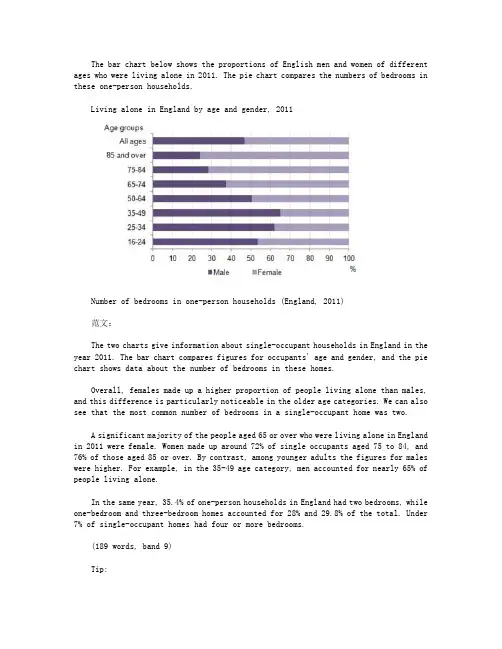
The bar chart below shows the proportions of English men and women of different ages who were living alone in 2011. The pie chart compares the numbers of bedrooms in these one-person households.Living alone in England by age and gender, 2011Number of bedrooms in one-person households (England, 2011)范文:The two charts give information about single-occupant households in England in the year 2011. The bar chart compares figures for occupants' age and gender, and the pie chart shows data about the number of bedrooms in these homes.Overall, females made up a higher proportion of people living alone than males, and this difference is particularly noticeable in the older age categories. We can also see that the most common number of bedrooms in a single-occupant home was two.A significant majority of the people aged 65 or over who were living alone in England in 2011 were female. Women made up around 72% of single occupants aged 75 to 84, and 76% of those aged 85 or over. By contrast, among younger adults the figures for males were higher. For example, in the 35-49 age category, men accounted for nearly 65% of people living alone.In the same year, 35.4% of one-person households in England had two bedrooms, while one-bedroom and three-bedroom homes accounted for 28% and 29.8% of the total. Under 7% of single-occupant homes had four or more bedrooms.(189 words, band 9)Tip:Notice that I was forced to leave out some of the information from the bar chart. This is normal when you only have 20 minutes; examiners expect you to select some key figures, not to try to include everything.。
Writing task 1st month you had a holiday overseas where you stayed with some friends. They have just sentyou some photos of your holiday.Write a letter to your friends. In your letter∙thank them for the photos and for the holiday∙explain why you didn’t write earlier∙invite them to come and stay with you2.You recently bought a piece of equipment for your kitchen but it did not work. You phoned theshop but no action was taken.Write a letter to the shop manager. In your letter∙describe the problem with the equipment∙explain what happened when you phoned the shop∙say what you would like the manager to do3.You have a full-time job and are also doing a part-time evening course. You now find that youcannot continue the course.Write a letter to the course tutor. In your letter∙describe the situation∙explain why you cannot continue at this time∙say what action you would like to take4.You are about to go on vacation for a month. A friend from another town will come and stay inyour apartment.Write a letter to this friend. In your letter∙explain where your friend can get the key to the apartment∙give your friend some instructions about using your apartment∙recommend some places to go5.You missed a flight due to a problem at the airport. Write a letter to the airline. In your letter∙describe what happened that caused you to miss the flight∙explain how missing your flight affected you∙make it clear what you would like the airline to do6.There have been some problems with public transport in your area recently. Write a letter to themanager of the transport company. In your letter∙describe the problems∙explain how these problems are affecting the public∙suggest some changes that could be made7.Your local newspaper published an advertisement asking people to help with environmentprojects in your area.Write a letter to the project manager to offer your help. In your letter∙describe a local environmental issue that affects you∙explain what you would like to do to help∙and suggest how the problem could be avoided in future8.One of your friends has asked you to be a partner in his new business.Write a letter to reply to your friend’s offer. In your letter∙give your opinion of your friend’s business idea∙tell him whether or not you have decided to accept his offer∙and explain your reasons for this decision9.You have decided to leave your current job even though you enjoy it.Write a letter to inform your manager of your decision. In your letter∙tell the manager about your decision and the reason for it∙describe what you learnt in your current job∙and ask the manager to write a reference letter to help you with future employment 10.You recently went on a trip with a friend and you both took some photographs.Write a letter to your friend. In your letter∙ask your friend to send you one of the photographs∙explain why you need that particular photograph∙and tell your friend what happened to your copy of it11.On a recent holiday you lost a valuable item. Fortunately you have travel insurance to cover thecost of anything lost.Write a letter to the manager of your insurance company. In your letter∙describe the item you lost∙explain how you lost it∙tell the insurance company what you would like them to do12.There is a problem in the road outside your house.Write a letter to your local councillor. In your letter∙introduce yourself∙explain what the problem is∙tell the councillor what you would like to be done13.You are working for a company. You need to take some time off work and want to ask yourmanager about this.Write a letter to your manager. In your letter∙explain why you want to take time off work∙give details of the amount of time you need∙suggest how your work could be covered while you are away14.Write to a friend to explain that you had moved house.∙explain why∙describe the new place∙invite your friend to come and stayWriting task 1st month you had a holiday overseas where you stayed with some friends. They have just sentyou some photos of your holiday.Write a letter to your friends. In your letter∙thank them for the photos and for the holiday∙explain why you didn’t write earlier∙invite them to come and stay with youDear John and Jane,I hope this letter finds you well. I’m just writing to thank you both for the holiday and for thephotos you sent.The photos arrived this morning in the post. They reminded me what a great time I had during my stay with you last month. You really were fant astic hosts, and I couldn’t have asked forbetter guides to show me around.Sorry I didn’t write to you earlier, but I’ve been working flat out since the moment I arrivedhome. Do you remember I told you I had an assignment to finish? Well, the deadline was two weeks earlier than I thought it was!Anyway, I’m back to normal now and I’ve handed in all of my assignments. In fact, now that I’m free, why don’t you both come and stay? There’s a spare room here, so you’re welcome to use it whenever you like.Hope to see you soon,Peter2.You recently bought a piece of equipment for your kitchen but it did not work. You phoned theshop but no action was taken.Write a letter to the shop manager. In your letter∙describe the problem with the equipment∙explain what happened when you phoned the shop∙say what you would like the manager to doDear Sir or Madam,I am writing with regard to an appliance that I recently bought from your shop.On the 10th May I bought a new washing machine, and it was installed the following day.However, when I tried to wash some clothes, I noticed that the machine failed to spin during the washing cycle. Consequently, it leaves clothes wet but not clean.When I phoned your shop to report the problem, I spoke to an assistant who did not know the procedure for repairs or returns. He assured me that he would report the issue to the storemanager, and that I would be contacted the same day. That was two days ago, and I am stillwaiting for your call.As the appliance is under warranty, I am entitled to ask for it to be repaired or replaced. I have decided that I would like a replacement washing machine. I would also like you to phone me personally when you receive this letter.I await your prompt response.Yours faithfully,John Smith3.You have a full-time job and are also doing a part-time evening course. You now find that youcannot continue the course.Write a letter to the course tutor. In your letter∙describe the situation∙explain why you cannot continue at this time∙say what action you would like to take4.You are about to go on vacation for a month. A friend from another town will come and stay inyour apartment.Write a letter to this friend. In your letter∙explain where your friend can get the key to the apartment∙give your friend some instructions about using your apartment∙recommend some places to go5.You missed a flight due to a problem at the airport. Write a letter to the airline. In your letter∙describe what happened that caused you to miss the flight∙explain how missing your flight affected you∙make it clear what you would like the airline to do6.There have been some problems with public transport in your area recently. Write a letter to themanager of the transport company. In your letter∙describe the problems∙explain how these problems are affecting the public∙suggest some changes that could be made7.Your local newspaper published an advertisement asking people to help with environmentprojects in your area.Write a letter to the project manager to offer your help. In your letter∙describe a local environmental issue that affects you∙explain what you would like to do to help∙and suggest how the problem could be avoided in future8.One of your friends has asked you to be a partner in his new business.Write a letter to reply to your friend’s offer. In your letter∙give your opinion of your friend’s business idea∙tell him whether or not you have decided to accept his offer∙and explain your reasons for this decision9.You have decided to leave your current job even though you enjoy it.Write a letter to inform your manager of your decision. In your letter∙tell the manager about your decision and the reason for it∙describe what you learnt in your current job∙and ask the manager to write a reference letter to help you with future employment10.You recently went on a trip with a friend and you both took some photographs.Write a letter to your friend. In your letter∙ask your friend to send you one of the photographs∙explain why you need that particular photograph∙and tell your friend what happened to your copy of it11.On a recent holiday you lost a valuable item. Fortunately you have travel insurance to cover thecost of anything lost.Write a letter to the manager of your insurance company. In your letter∙describe the item you lost∙explain how you lost it∙tell the insurance company what you would like them to do12.There is a problem in the road outside your house.Write a letter to your local councillor. In your letter∙introduce yourself∙explain what the problem is∙tell the councillor what you would like to be done13.You are working for a company. You need to take some time off work and want to ask yourmanager about this.Write a letter to your manager. In your letter∙explain why you want to take time off work∙give details of the amount of time you need∙suggest how your work could be covered while you are awayDear Mr. Smith,I am writing to ask for some time off work next month.The reason for this request is that my brother is getting married. His future wife is Australian, and the wedding will take place in her home city, Melbourne. As the brother of the groom, Icannot miss such a special occasion.To attend the ceremony and make the round trip from the UK, I would need at least five days off work. However, I would like to take the opportunity to do some sightseeing in Australia, and so I am hoping that you will allow me to take a full two weeks’ leave, from the 1st to the 15th of May.I have spoken to my co-workers, and it seems that Peter Jones would be best placed to cover myproject commitments while I am away. I will leave detailed instructions for him on my desk.I hope that my request does not cause you any inconvenience.Yours sincerely,Michael Hall14.Write to a friend to explain that you had moved house.∙explain why∙describe the new place∙invite your friend to come and stay11。
雅思作文simon9分范文合集英文回答:Task 1:Bar Graph.The bar graph illustrates the percentage of people who use different modes of transportation to commute to work in a particular city.The most popular mode of transportation is public transportation, which accounts for 45% of commuters.The second most popular mode is driving alone, with 30% of commuters.Walking or cycling is the third most popular mode,with 15% of commuters.The least popular mode is carpooling or ridesharing, with only 10% of commuters.Task 2:Discuss the benefits and drawbacks of social media for young people.Benefits:Social media provides young people with a platform to connect with friends and family, which can be especially beneficial for those who live far apart.It allows them to share their experiences, ideas, and opinions with others.Social media can also be used as a tool for education and learning.Drawbacks:Social media can be addictive, and young people may spend excessive amounts of time on these platforms.It can lead to cyberbullying and other forms of online harassment.Social media can also create unrealistic expectations and promote a culture of comparison.Overall Conclusion:Whether the benefits of social media outweigh the drawbacks is a matter of debate. However, it is important for young people to be aware of both the positive and negative aspects of social media so that they can use it in a healthy and responsible way.中文回答:任务 1:条形图。
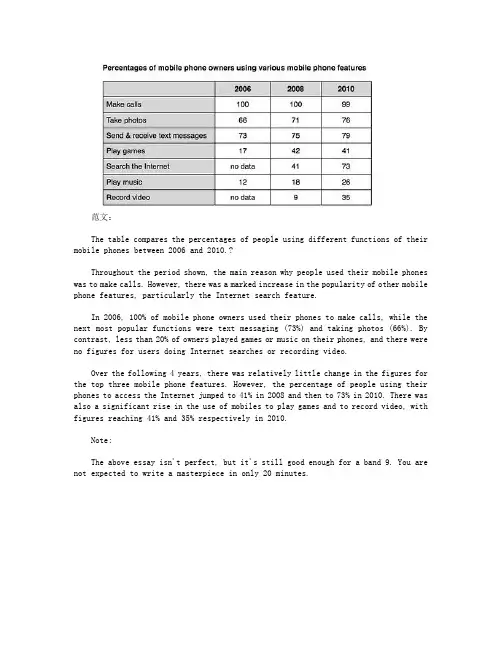
范文:The table compares the percentages of people using different functions of their mobile phones between 2006 and 2010.?Throughout the period shown, the main reason why people used their mobile phones was to make calls. However, there was a marked increase in the popularity of other mobile phone features, particularly the Internet search feature.In 2006, 100% of mobile phone owners used their phones to make calls, while the next most popular functions were text messaging (73%) and taking photos (66%). By contrast, less than 20% of owners played games or music on their phones, and there were no figures for users doing Internet searches or recording video.Over the following 4 years, there was relatively little change in the figures for the top three mobile phone features. However, the percentage of people using their phones to access the Internet jumped to 41% in 2008 and then to 73% in 2010. There was also a significant rise in the use of mobiles to play games and to record video, with figures reaching 41% and 35% respectively in 2010.Note:The above essay isn't perfect, but it's still good enough for a band 9. You are not expected to write a masterpiece in only 20 minutes.。

2016年10月份雅思大作文:high salaries题目:In many countries, a small number of people earn extremely high salaries. Some people believe that this is good for the country, but others think that governments should not allow salaries above a certain level.Discuss both these views and give your own opinion.范文People have different views about whether governments should introduce a maximum wage. While in some ways it may seem reasonable to allow people to earn as much as companies are willing to pay, I personally believe that employee remuneration should be capped at a certain level.There are various reasons why it might be considered beneficial to allow people to be paid extremely high salaries. If companies offer excellent pay packages, they can attract the most talented people in their fields to work for them. For example, technology companies like Google are able to employ the best programmers because of the huge sums that they are willing to pay. Furthermore, these well-paid employees are likely to be highly motivated to work hard and therefore drive their businesses successfully. In theory, this should result in a thriving economy and increased tax revenues, which means that paying high salaries benefits everyone.However, I agree with those who argue that there should be a maximum wage. By introducing a limit on earnings, the pay-gap between bosses and employees can be reduced. Currently, the difference between normal and top salaries is huge, and this can demotivate workers who feel that the situation is unfair. With lower executive salaries and higher minimum wages, everybody will be better off. One possible consequence of greater equality could be that poverty and crime rates fall because the general population will experience an improved standard of living.In conclusion, it seems to me that it would be better, on balance, for governments to set a limit on the wages of the highest earners in society.2016年07月份雅思大作文:climate change题目:Some people think that instead of preventing climate change, we need to find a way to live with it. To what extent do you agree or disagree?范文Climate change represents a major threat to life on Earth, but some people argue that we need to accept it rather than try to stop it. I completely disagree with this opinion, because I believe that we still have time to tackle this issue and reduce the human impact on the Earth's climate.There are various measures that governments and individuals could take to prevent, or at least mitigate, climate change. Governments could introduce laws to limit the carbon dioxide emissions that lead to global warming. They could impose “green taxes” on drivers, airline companies and other polluters, and they could invest in renewable energy production from solar, wind or water power. As individuals, we should also try to limit our contribution to climate change, by becoming more energy efficient, by flying less, and by using bicycles and public transport. Furthermore, the public can affect the actions of governments by voting for politicians who propose to tackle climate change, rather than for those who would prefer to ignore it.If instead of taking the above measures we simply try to live with climate change, I believe that the consequences will be disastrous. To give just one example, I am not optimistic that we would be able to cope with even a small rise in sea levels. Millions of people would be displaced by flooding, particularly in countries that do not have the means to safeguard low-lying areas. These people would lose their homes and their jobs, and they would be forced to migrate to nearby cities or perhaps to other countries. The potential for human suffering would be huge, and it is likely that we would see outbreaks of disease and famine, as well as increased homelessness and poverty.In conclusion, it is clear to me that we must address the problem of climate change, and I disagree with those who argue that we can find ways to live with it.2016年份雅思大作文:economic progress题目:Many governments think that economic progress is their most important goal. Some people, however, think that other types of progress are equally important for a country.Discuss both these views and give your own opinion.范文People have different views about how governments should measure their countries’progress. While economic progress is of course essential, I agree with those who believe that other measures of progress are just as important.There are three key reasons why economic growth is seen as a fundamental goal for countries. Firstly, a healthy economy results in job creation, a high level of employment, and better salaries for all citizens. Secondly, economic progress ensures that more money is available for governments to spend on infrastructure and public services. For example, a government with higher revenues can invest in the country's transport network, its education system and its hospitals. Finally, a strong economy can help a country’s standing on the global stage, in terms of its political influence and trading power.However, I would argue that various other forms of progress are just as significant as the economic factors mentioned above. In particular, we should consider the area of social justice, human rights, equality and democracy itself. For example, the treatment of minority groups is often seen as a reflection of the moral standards and level of development of a society. Perhaps another key consideration when judging the progress of a modern country should be how well that country protects the natural environment, and whether it is moving towards environmental sustainability. Alternatively, the success of a nation could be measured by looking at the health, well-being and happiness of its residents.In conclusion, the economy is obviously a key marker of a country’s success, but social, environmental and health criteria are equally significant.2016年份雅思大作文:problem and solution题目:More and more people are migrating to cities in search of a better life, but city life can be extremely difficult. Explain some of the difficulties of living in a city. How can governments make urban life better for everyone?范文Cities are often seen as places of opportunity, but there are also some major drawbacks of living in a large metropolis. In my opinion, governments could do much more to improve city life for the average inhabitant.The main problem for anyone who hopes to migrate to a large city is that the cost of living is likely to be much higher than it is in a small town or village. Inhabitants of cities have to pay higher prices for housing, transport, and even food. Another issue is that urban areas tend to suffer from social problems such as high crime and poverty rates in comparison with rural areas. Furthermore, the air quality in cities is often poor, due to pollution from traffic, and the streets and public transport systems are usually overcrowded. As a result, city life can be unhealthy and stressful.However, there are various steps that governments could take to tackle these problems. Firstly, they could invest money in the building of affordable or social housing to reduce the cost of living. Secondly, politicians have the power to ban vehicles from city centres and promote the use of cleaner public transport, which would help to reduce both air pollution and traffic congestion. In London, for example, the introduction of a congestion charge for drivers has helped to curb the traffic problem. A third option would be to develop provincial towns and rural areas, by moving industry and jobs to those regions, in order to reduce the pressure on major cities.In conclusion, governments could certainly implement a range of measures to enhance the quality of life for all city residents.2015年份雅思大作文:positive or negative题目:In some countries, many more people are choosing to live alone nowadays than in the past. Do you think this is a positive or negative development?范文In recent years it has become far more normal for people to live alone, particularly in large cities in the developed world. In my opinion, this trend is having both positive and negative consequences in equal measure.The rise in one-person households can be seen as positive for both personal and broader economic reasons. On an individual level, people who choose to live alone may become more independent and self-reliant than those who live with family members. A young adult who lives alone, for example, will need to learn to cook, clean, pay bills and manage his or her budget, all of which are valuable life skills. From an economic perspective, the trend towards living alone will result in greater demand for housing. This is likely to benefit the construction industry, estate agents and a whole host of other companies that rely on homeowners to buy their products or services.However, the personal and economic arguments given above can be considered from the opposite angle. Firstly, rather than the positive feeling of increased independence, people who live alone may experience feelings of loneliness, isolation and worry. They miss out on the emotional support and daily conversation that family or flatmates can provide, and they must bear the weight of all household bills and responsibilities. Secondly, from the financial point of view, a rise in demand for housing is likely to push up property prices and rents. While this may benefit some businesses, the general population, including those who live alone, will be faced with rising living costs.In conclusion, the increase in one-person households will have both beneficial and detrimental effects on individuals and on the economy.2015年份雅思大作文:university subjects题目:Some people think that all university students should study whatever they like. Others believe that they should only be allowed to study subjects that will be useful in the future, such as those related to science and technology.Discuss both these views and give your own opinion.范文People have different views about how much choice students should have with regard to what they can study at university. While some argue that it would be better for students to be forced into certain key subject areas, I believe that everyone should be able to study the course of their choice.There are various reasons why people believe that universities should only offer subjects that will be useful in the future. They may assert that university courses like medicine, engineering and information technology are more likely to be beneficial than certain art degrees. From a personal perspective, it can be argued that these courses provide more job opportunities, career progression, better salaries, and therefore an improved quality of life for students who take them. On the societal level, by forcing people to choose particular university subjects, governments can ensure that any knowledge and skill gaps in the economy are covered. Finally, a focus on technology in higher education could lead to new inventions, economic growth, and greater future prosperity.In spite of these arguments, I believe that university students should be free to choose their preferred areas of study. In my opinion, society will benefit more if our students are passionate about what they are learning. Besides, nobody can really predict which areas of knowledge will be most useful to society in the future, and it may be that employers begin to value creative thinking skills above practical or technical skills. If this were the case, perhaps we would need more students of art, history and philosophy than of science or technology.In conclusion, although it might seem sensible for universities to focus only on the most useful subjects, I personally prefer the current system in which people have right to study whatever they like.2015年份雅思大作文:crime subject题目:Some people who have been in prison become good citizens later, and it is often argued that these are the best people to talk to teenagers about the dangers of committing a crime.To what extent do you agree or disagree?范文1.开头段:完全同意题目的观点It is true that ex-prisoners can become normal, productive members of society. I completely agree with the idea that allowing such people to speak to teenagers about their experiences is the best way to discourage them from breaking the law.2.主体段:(第一个理由):犯人可以告诉青少年他们真实的犯罪经历。
SIMON TASK 1RISE•The price of cigarettes rises every year. (verb, present)•In 2008, the number of customers rose from 100 to 200. (verb, past)•There has been a dramatic rise in Internet usage in the UK. (noun)•In 2008, the UK saw a rise in the divorce rate. (noun)London saw a significant increase in the cost of homes. (noun)The cost of homes in London increased significantly. (verb)There was a rise in house prices between 1990 and 1995. (noun)House prices rose between 1990 and 1995. (verb)There was a 7% fall in the average house price in Tokyo. (noun)The average Tokyo house price fell by 7%. (verb)SEEIELTS Grammar: using 'see' in writing task 1In Britain, CD sales increased dramatically in the 1980s.We can write the same sentence in various ways using 'see':•Britain saw a dramatic increase in CD sales in the 1980s.•The 1980s saw a dramatic increase in CD sales in Britain.•British shops saw CD sales increase dramatically in the 1980s.PERCENTAGE•In 1999, 35% of British people went abroad for their holidays, while only 28% of Australians spent their holidays in a different country. The figure for the USA stood at 31%.•Around 40% of women in the UK had an undergraduate qualification in 1999, compared to 37% of men. The figures for the year 2000 rose slightly to 42% and 38% respectively.to, by, with, at1) Use to when describing what happened to the number:In 2008, the rate of unemployment rose to 10%.2) Use by when describing the amount of change between two numbers:In 2009, the rate of unemployment fell by 2% (from 10% to 8%).3) Use with to give the idea of 'having' the number:Obama won the election with 52% of the vote.4) Use at to add the number on the end of a sentence:Unemployment reached its highest level in 2008, at 10%.passiveIn which of the following sentences is the passive used appropriately? Which sentences should be changed to the active?1) The number of marriages was decreased between 1999 and 2009.2) First, the raw materials are mixed together.3) The figure for residents with no children has been increased this year.4) The final product is packaged and delivered to shopsprocess diagramsAt the first stage in the cement production process, limestone and clay are crushed to form a powder. This powder is then mixed and passed through a rotating heater. The resulting mixture is ground, and finally the end product, cement, is packed into large bags. double, twice as, twofold1. 'double' (verb)The number of unemployed people doubled between 2005 and 2009.2. 'twice as...as/compared to', 'three times as...as/compared to'There were twice as many unemployed people in 2009 as in 2005.Twice as many people were unemployed in 2009 compared to 2005.3. 'twofold', 'threefold' (adjective or adverb)There was a twofold increase in the number of unemployed people between 2005 and 2009. (adjective with the noun 'increase')The number of unemployed people increased twofold between 2005 and 2009. (adverb with the verb 'increase')ages and age groupsIt's easy to make small mistakes when describing ages and age groups. Here are some examples that should help.One person:•He is 10 years old.•He is a 10-year-old.•He is aged 10.More than one person:•The children in the class are all 10 years old.•It is a class of 10-year-olds (or "10-year-old children").•The children in the class are all aged 10.Age groups with more than one person:•The chart shows the preferred hobbies of children (who are) between 10 and 12 years old.•The chart shows the preferred hobbies of 10- to 12-year-olds (or "10- to 12-year-old children").•The chart shows the preferred hobbies of children aged 10 to 12.DANWEIsome sentences about the year 1970:1)60 million tonnes of goods were transported by road.2) The amount of goods transported by road totalled 60 million tonnes.3) Road vehicles were used to transport 60 million tonnes of goodsYou could either put the percentage at the beginning of the sentence (example 1), or put it at the end of the sentence (example 2):1.6% of single aged people were living in poverty.2.The level of poverty among single aged people stood at 6%.You could also add a comparison:1.6% of single aged people were living in poverty, compared to only 4% of agedcouples.2.The level of poverty among single aged people stood at 6%, whereas the figure foraged couples was only 4%.Don't write:- Walking was 255 miles per person in 1985.- Car was the highest form of transport.Do write:- The average person walked 255 miles in 1985.- People travelled more miles by car than by any other form of transport.FUTUREPast:In 1999, the proportion of people using the Internet in the USA was about 20%. The figures for Canada and Mexico were lower, at about 10% and 5% respectively. In 2005, Internet usage in both the USA and Canada rose to around 70% of the population, while the figure for Mexico reached just over 25%.Future (I've changed the years and the verbs):In 2015, the proportion of people using the Internet in the USA is expected to be about 20%. The figures for Canada and Mexico are likely to be lower, at about 10% and 5% respectively. In 2025, it is predicted that Internet usage in both the USA and Canada will rise to around 70% of the population, while the figure for Mexico should reach just over 25%.IELTS Writing Task 1: comparisonsYou can use "compared to", "compared with" and "in comparison with" in the same way. For example:•Prices in the UK are high compared to / with / in comparison with (prices in) Canada and Australia.•Compared to / with / in comparison with (prices in) Canada and Australia, prices in the UK are high.When writing about numbers or changes, I find it easier to use "while" or "whereas": •There are 5 million smokers in the UK, while / whereas only 2 million Canadians and 1 million Australians smoke.•Between 1990 and 2000, the number of smokers in the UK decreased dramatically, while / whereas the figures for Canada and Australia remained the same.PIEThe pie charts compare the expenditure of a school in the UK in three different years over a 20-year period.It is clear that teachers’ salaries made up the largest proportion of the school’s spending in all three years (1981, 1991 and 2001). By contrast, insurance was the smallest cost in each year.In 1981, 40% of the school’s budget went on teach ers’ salaries. This figure rose to 50% in 1991, but fell again by 5% in 2001. The proportion of spending on other workers’ wages fell steadily over the 20-year period, from 28% of the budget in 1981 to only 15% in 2001.Expenditure on insurance stood at only 2% of the total in 1981, but reached 8% in 2001. Finally, the percentages for resources and furniture/equipment fluctuated. The figure for resources was highest in 1991, at 20%, and the proportion of spending on furniture and equipment reached its peak in 2001, at 23%.Cambridge IELTS book 7, page 101:The pie charts compare the amount of electricity produced using five different sources of fuel in two countries over two separate years.Total electricity production increased dramatically from 1980 to 2000 in both Australia and France. While the totals for both countries were similar, there were big differences in the fuel sources used.Coal was used to produce 50 of the total 100 units of electricity in Australia in 1980, rising to 130 out of 170 units in 2000. By contrast, nuclear power became the most important fuel source in France in 2000, producing almost 75% of the country’s electricity.Australia depended on hydro power for just under 25% of its electricity in both years, but the amount of electricity produced using this type of power fell from 5 to only 2 units in France. Oil, on the other hand, remained a relatively important fuel source in France, but its use declined in Australia. Both countries relied on natural gas for electricity production significantly more in 1980 than in 2000.(170 words)BARThe bar charts compare students of different ages in terms of why they are studying and whether they are supported by an employer.It is clear that the proportion of students who study for career purposes is far higher among the younger age groups, while the oldest students are more likely to study for interest. Employer support is more commonly given to younger students.Around 80% of students aged under 26 study to further their careers, whereas only 10% study purely out of interest. The gap between these two proportions narrows as students get older, and the figures for those in their forties are the same, at about 40%. Students aged over 49 overwhelmingly study for interest (70%) rather than for professional reasons (less than 20%). Just over 60% of students aged under 26 are supported by their employers. By contrast, the 30-39 age group is the most self-sufficient, with only 30% being given time off and help with fees. The figures rise slightly for students in their forties and for those aged 50 or more.The bar chart compares the number of incidents and injuries for every 100 million passenger miles travelled on five different types of public transport in 2002.It is clear that the most incidents and injuries took place on demand-response vehicles. By contrast, commuter rail services recorded by far the lowest figures.A total of 225 incidents and 173 injuries, per 100 million passenger miles travelled, took place on demand-response transport services. These figures were nearly three times as high as those for the second highest category, bus services. There were 76 incidents and 66 people were injured on buses.Rail services experienced fewer problems. The number of incidents on light rail trains equalled the figure recorded for buses, but there were significantly fewer injuries, at only 39. Heavy rail services saw lower numbers of such events than light rail services, but commuter rail passengers were even less likely to experience problems. In fact, only 20 incidents and 17 injuries occurred on commuter trains.The chart below shows information about changes in average house prices in five different cities between 1990 and 2002 compared with the average house prices in 1989.The bar chart compares the cost of an average house in five major cities over a period of 13 years from 1989.We can see that house prices fell overall between 1990 and 1995, but most of the cities saw rising prices between 1996 and 2002. London experienced by far the greatest changes in house prices over the 13-year period.Over the 5 years after 1989, the cost of average homes in Tokyo and London dropped by around 7%, while New York house prices went down by 5%. By contrast, prices rose by approximately 2% in both Madrid and Frankfurt.Between 1996 and 2002, London house prices jumped to around 12% above the 1989 average. Homebuyers in New York also had to pay significantly more, with prices rising to 5% above the 1989 average, but homes in Tokyo remained cheaper than they were in 1989. The cost of an average home in Madrid rose by a further 2%, while prices in Frankfurt remained stable.The charts below show the levels of participation in education and science in developing and industrialised countries in 1980 and 1990.The three bar charts show average years of schooling, numbers of scientists and technicians, and research and development spending in developing and developed countries. Figures are given for 1980 and 1990.It is clear from the charts that the figures for developed countries are much higher than those for developing nations. Also, the charts show an overall increase in participation in education and science from 1980 to 1990.People in developing nations attended school for an average of around 3 years, with only a slight increase in years of schooling from 1980 to 1990. On the other hand, the figure for industrialised countries rose from nearly 9 years of schooling in 1980 to nearly 11 years in 1990.From 1980 to 1990, the number of scientists and technicians in industrialised countries almost doubled to about 70 per 1000 people. Spending on research and development also saw rapid growth in these countries, reaching $350 billion in 1990. By contrast, the number of science workers in developing countries remained below 20 per 1000 people, and research spending fell from about $50 billion to only $25 billion.selecting detailsUnited StatesThe United States had the highest number of prisoners in four out of the six years shown on the chart, and in 1980 the figure for this country peaked at nearly 140,000 prisoners. CanadaCanada had the highest figures for imprisonment in 1930 and 1950, with about 120,000 prisoners in both years.New Zealand and AustraliaThe figures for New Zealand an Australia fluctuated between 40,000 and 100,000 prisoners, although New Zealand's prison population tended to be the higher of the two.Great BritainIn contrast to the figures for the other countries, the number of prisoners in Great Britain rose steadily between 1930 and 1980, reaching a peak of about 80,000 at the end of the period.The following bar chart has a total of 24 bars. It's impossible to describe 24 pieces of information in only 20 minutes, so you need to select.The bar chart compares consumer spending on six different items in Germany, Italy, France and Britain.It is clear that British people spent significantly more money than people in the other three countries on all six goods. Of the six items, consumers spent the most money on photographic film.People in Britain spent just over £170,000 on photographic film, which is the highest figure shown on the chart. By contrast, Germans were the lowest overall spenders, with roughly the same figures (just under £150,000) for each of the six products.The figures for spending on toys were the same in both France and Italy, at nearly £160,000. However, while French people spent more than Italians on photographic film and CDs, Italians paid out more for personal stereos, tennis racquets and perfumes. The amount spent by French people on tennisLINEThe line graph compares the percentage of people aged 65 or more in three countries over a period of 100 years.It is clear that the proportion of elderly people increases in each country between 1940 and 2040. Japan is expected to see the most dramatic changes in its elderly population.In 1940, around 9% of Americans were aged 65 or over, compared to about 7% of Swedish people and 5% of Japanese people. The proportions of elderly people in the USA and Sweden rose gradually over the next 50 years, reaching just under 15% in 1990. By contrast, the figures for Japan remained below 5% until the early 2000s.Looking into the future, a sudden increase in the percentage of elderly people is predicted for Japan, with a jump of over 15% in just 10 years from 2030 to 2040. By 2040, it is thought that around 27% of the Japanese population will be 65 years old or more, while the figures for Sweden and the USA will be slightly lower, at about 25% and 23% respectively.In 1990, almost 90% of 14 to 24 year olds went to the cinema at least once a year. Cinema attendance was about 30% lower than this among people aged 25 to 34 and 35 to 49, while the figure for those aged over 50 was the lowest, at only 40%.The line graph compares the percentage of people in three countries who used the Internet between 1999 and 2009.It is clear that the proportion of the population who used the Internet increased in each country over the period shown. Overall, a much larger percentage of Canadians and Americans had access to the Internet in comparison with Mexicans, and Canada experienced the fastest growth in Internet usage.In 1999, the proportion of people using the Internet in the USA was about 20%. The figures for Canada and Mexico were lower, at about 10% and 5% respectively. In 2005, Internet usage in both the USA and Canada rose to around 70% of the population, while the figure for Mexico reached just over 25%.By 2009, the percentage of Internet users was highest in Canada. Almost 100% of Canadians used the Internet, compared to about 80% of Americans and only 40% of Mexicans.TABLEThe table below gives information on consumer spending on different items in five different countries in 2002.Percentage of national consumer expenditure by category - 2002The table shows percentages of consumer expenditure for three categories of products and services in five countries in 2002.It is clear that the largest proportion of consumer spending in each country went on food, drinks and tobacco. On the other hand, the leisure/education category has the lowest percentages in the table.Out of the five countries, consumer spending on food, drinks and tobacco was noticeably higher in Turkey, at 32.14%, and Ireland, at nearly 29%. The proportion of spending on leisure and education was also highest in Turkey, at 4.35%, while expenditure on clothing and footwear was significantly higher in Italy, at 9%, than in any of the other countries.It can be seen that Sweden had the lowest percentages of national consumer expenditure for food/drinks/tobacco and for clothing/footwear, at nearly 16% and just over 5% respectively. Spain had slightly higher figures for these categories, but the lowest figure forleisure/education, at only 1.98%.The table below shows the proportion of different categories of families living in poverty in Australia in 1999.The table gives information about poverty rates among six types of household in Australia in the year 1999.It is noticeable that levels of poverty were higher for single people than for couples, and people with children were more likely to be poor than those without. Poverty rates were considerably lower among elderly people.Overall, 11% of Australians, or 1,837,000 people, were living in poverty in 1999. Aged people were the least likely to be poor, with poverty levels of 6% and 4% for single aged people and aged couples respectively.Just over one fifth of single parents were living in poverty, whereas only 12% of parents living with a partner were classed as poor. The same pattern can be seen for people with no children: while 19% of single people in this group were living below the poverty line, the figure for couples was much lower, at only 7%.The table below gives information about the underground railway systems in six cities.The table shows data about the underground rail networks in six major cities.The table compares the six networks in terms of their age, size and the number of people who use them each year. It is clear that the three oldest underground systems are larger and serve significantly more passengers than the newer systems.The London underground is the oldest system, having opened in 1863. It is also the largest system, with 394 kilometres of route. The second largest system, in Paris, is only about half the size of the London underground, with 199 kilometres of route. However, it serves more people per year. While only third in terms of size, the Tokyo system is easily the most used, with 1927 million passengers per year.Of the three newer networks, the Washington DC underground is the most extensive, with 126 kilometres of route, compared to only 11 kilometres and 28 kilometres for the Kyoto and Los Angeles systems. The Los Angeles network is the newest, having opened in 2001, while the Kyoto network is the smallest and serves only 45 million passengers per year.MIXThe chart gives information about UK immigration, emigration and net migration between 1999 and 2008.Both immigration and emigration rates rose over the period shown, but the figures for immigration were significantly higher. Net migration peaked in 2004 and 2007.In 1999, over 450,000 people came to live in the UK, while the number of people who emigrated stood at just under 300,000. The figure for net migration was around 160,000, and it remained at a similar level until 2003. From 1999 to 2004, the immigration rate rose by nearly 150,000 people, but there was a much smaller rise in emigration. Net migration peaked at almost 250,000 people in 2004.After 2004, the rate of immigration remained high, but the number of people emigrating fluctuated. Emigration fell suddenly in 2007, before peaking at about 420,000 people in 2008. As a result, the net migration figure rose to around 240,000 in 2007, but fell back to around 160,000 in 2008.The graph and table below give information about water use worldwide and water consumption in two different countries.The charts compare the amount of water used for agriculture, industry and homes around the world, and water use in Brazil and the Democratic Republic of Congo.It is clear that global water needs rose significantly between 1900 and 2000, and that agriculture accounted for the largest proportion of water used. We can also see that water consumption was considerably higher in Brazil than in the Congo.In 1900, around 500km³ of water was used by the agriculture sector worldwide. The figures for industrial and domestic water consumption stood at around one fifth of that amount. By 2000, global water use for agriculture had increased to around 3000km³, industrial water use had risen to just under half that amount, and domestic consumption had reached approximately 500km³.In the year 2000, the populations of Brazil and the Congo were 176 million and 5.2 million respectively. Water consumption per person in Brazil, at 359m³, was much higher than that in the Congo, at only 8m³, and this could be explained by the fact that Brazil had 265 times more irrigated land.The diagram below shows the water cycle, which is the continuous movement of water on, above and below the surface of the Earth.The picture illustrates the way in which water passes from ocean to air to land during the natural process known as the water cycle.Three main stages are shown on the diagram. Ocean water evaporates, falls as rain, and eventually runs back into the oceans again.Beginning at the evaporation stage, we can see that 80% of water vapour in the air comes from the oceans. Heat from the sun causes water to evaporate, and water vapour condenses to form clouds. At the second stage, labelled ‘precipitation’ on the diagram, water falls as rain or snow.At the third stage in the cycle, rainwater may take various paths. Some of it may fall into lakes or return to the oceans via ‘surface runoff’. Otherwise, rainwater may filter through the ground, reaching the impervious layer of the earth. Salt water intrusion is shown to take place just before groundwater passes into the oceans to complete the cycle.BrickmanufacturingHere are my 2 main paragraphs describing the steps:At the beginning of the process, clay is dug from the ground. The clay is put through a metal grid, and it passes onto a roller where it is mixed with sand and water. After that, the clay can be shaped into bricks in two ways: either it is put in a mould, or a wire cutter is used.At the fourth stage in the process, the clay bricks are placed in a drying oven for one to two days. Next, the bricks are heated in a kiln at a moderate temperature (200 - 900 degrees Celsius) and then at a high temperature (up to 1300 degrees), before spending two to three days in a cooling chamber. Finally, the finished bricks are packaged and delivered.'process diagram' detailsLooking at the coffee production process in detail, coffee beans must first be picked in the fields. These beans are then dried, roasted, and cooled before being put in a grinding machine, which turns the beans into coffee granules.At the sixth stage in the process, the ground coffee is mixed with hot water, and the resulting mixture is strained. Next, the mixture is frozen and then passed once again through the grinder. After that, the ground, frozen liquid is dried in a vacuum so that the water evaporates, leaving the coffee granules. Finally, these granules are packed into coffee jars for delivery to shops.Did you notice the passives and sequencing phrases?- Passives: must be picked; are dried, roasted and cooled; is mixed...- Sequencing: then; and; at the sixth stage; next; after that; finally...。
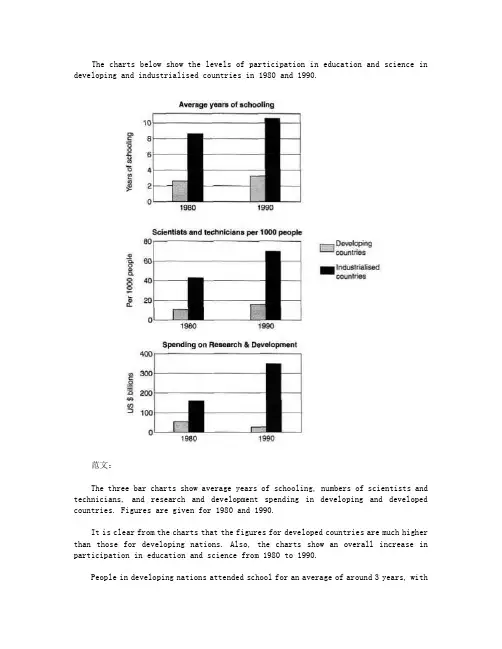
The charts below show the levels of participation in education and science in developing and industrialised countries in 1980 and 1990.范文:The three bar charts show average years of schooling, numbers of scientists and technicians, and research and development spending in developing and developed countries. Figures are given for 1980 and 1990.It is clear from the charts that the figures for developed countries are much higher than those for developing nations. Also, the charts show an overall increase in participation in education and science from 1980 to 1990.People in developing nations attended school for an average of around 3 years, withonly a slight increase in years of schooling from 1980 to 1990. On the other hand, the figure for industrialised countries rose from nearly 9 years of schooling in 1980 to nearly 11 years in 1990.From 1980 to 1990, the number of scientists and technicians in industrialised countries almost doubled to about 70 per 1000 people. Spending on research and development also saw rapid growth in these countries, reaching $350 billion in 1990. By contrast, the number of science workers in developing countries remained below 20 per 1000 people, and research spending fell from about $50 billion to only $25 billion.(187 words)。
The chart below shows the process of waste paper recycling.The flow chart shows how waste paper is recycled. It is clear that there are six distinct stages in this process, from the initial collection of waste paper to the eventual production of usable paper.At the first stage in the paper recycling process, waste paper is collected either from paper banks, where members of the public leave their used paper, or directly from businesses. This paper is then sorted by hand and separated according to its grade, with any paper that is not suitable for recycling being removed. Next, the graded paper is transported to a paper mill.Stages four and five of the process both involve cleaning. The paper is cleaned and pulped, and foreign objects such as staples are taken out. Following this, all remnants of ink and glue are removed from the paper at the de-inking stage. Finally, the pulp can be processed in a paper making machine, which makes the end product: usable paper.(160 words, band 9)Note: I joined the introduction and overview together because they were both short. Try to analyse the essay - why is it worth band 9?。
前考官simon:34篇雅思小作文范文IELTS Writing Task 1: bar chart sample answer题目:The chart below shows the total number of minutes (in billions) of telephone calls in the UK, divided into three categories, from 1995-2002.Here's my suggested outline for a 4-paragraph report:Introduction: rewrite the question statement in your own words.Overview: point out which category was highest in each year, which was lowest, and which saw the biggest changes.Details: compare the 3 categories in 1995, then say what happened up until 1999.Details: notice what happened to local calls from 1999 onwards, and contrast this with the other 2 categories. Finish with a comparison of the figures in 2002.范文:The bar chart compares the amount of time spent by people in the UK on three different types of phone call between 1995 and 2002.It is clear that calls made via local, fixed lines were the most popular type, in terms of overall usage, throughout the period shown. The lowest figures on the chart are for mobile calls, but this category also saw the most dramatic increase in user minutes.In 1995, people in the UK used fixed lines for a total of just over 70 billion minutes for local calls, and about half of that amount of time for national or international calls. By contrast, mobile phones were only used for around 4 billion minutes. Over the following four years, the figures for all three types of phone call increased steadily.By 1999, the amount of time spent on local calls using landlines had reached a peak at 90 billion minutes. Subsequently, the figure for this category fell, but the rise in the other two types of phone call continued. In 2002, the number of minutes of national / international landline calls passed 60 billion, while the figure for mobiles rose to around 45 billion minutes.(197 words, band 9)IELTS Writing Task 1: 'living alone' chartsThe bar chart below shows the proportions of English men and women of different ages who were living alone in 2011. The pie chart compares the numbers of bedrooms in these one-person households.Living alone in England by age and gender, 2011Number of bedrooms in one-person households (England, 2011)范文:The two charts give information about single-occupant households in England in the year 2011. The bar chart compares figures for occupants' age and gender, and the pie chart shows data about the number of bedrooms in these homes.Overall, females made up a higher proportion of people living alone than males, and this difference is particularly noticeable in the older age categories. We can also see that the most common number of bedrooms in a single-occupant home was two.A significant majority of the people aged 65 or over who were living alone in England in 2011 were female. Women made up around 72% of single occupants aged 75 to 84, and 76% of those aged 85 or over. By contrast, among younger adults the figures for males were higher. For example, in the 35-49 age category, men accounted for nearly 65% of people living alone.In the same year, 35.4% of one-person households in England had two bedrooms, while one-bedroom and three-bedroom homes accounted for 28% and 29.8% of the total. Under 7% of single-occupant homes had four or more bedrooms.(189 words, band 9)Tip:Notice that I was forced to leave out some of the information from the bar chart. This is normal when you only have 20 minutes; examiners expect you to select some key figures, not to try to include everything.IELTS Writing Task 1: 'coffee and bananas' table题目:The tables below give information about sales of Fairtrade*-labelled coffee and bananas in 1999 and 2004 in five European countries.*Fairtrade: a category of products for which farmers from developing countries have been paid an officially agreed fair price.范文:The tables show the amount of money spent on Fairtrade coffee and bananas in two separate years in the UK, Switzerland, Denmark, Belgium and Sweden.It is clear that sales of Fairtrade coffee rose in all five European countries from 1999 to 2004, but sales of Fairtrade bananas only went up in three out of the five countries. Overall, the UK saw by far the highest levels of spending on the two products.In 1999, Switzerland had the highest sales of Fairtrade coffee, at €3 million, while revenue from Fairtrade bananas was highest in the UK, at €15 million. By 2004, however, sales of Fairtrade coffee in the UK had risen to €20 million, and this was over three times higher than Switzerland’s sales figure for Fairtrade coffee in that year. The year 2004 also saw dramatic increases in the money spent on Fairtrade bananas in the UK and Switzerland, with revenues rising by €32 million and €4.5 million respectively.Sales of the two Fairtrade products were far lower in Denmark, Belgium and Sweden. Small increases in sales of Fairtrade coffee can be seen, but revenue remained at €2 million or below in all three countries in both years. Finally, it is noticeable that the money spent on Fairtrade bananas actually fell in Belgium and Sweden.IELTS Writing Task 1: 'school buildings' answer 题目:The diagrams below show the site of a school in 2004 and the plan for changes to the school site in 2024.范文:The two pictures compare the layout of a school as it was in the year 2004 with a proposed site design for the year 2024.It is clear that the main change for 2024 involves the addition of a new school building. The school will then be able to accommodate a considerably larger number of students.In 2004, there were 600 pupils attending the school, and the two school buildings were separated by a path running from the main entrance to the sports field. By 2024, it is expected that there will be 1000 pupils, and a third building will have been constructed. Furthermore, the plan is to join the two original buildings together, creating a shorter path that links the buildings only.As the third building and a second car park will be built on the site of the original sports field, a new, smaller sports field will need to be laid. A new road will also be built from the main entrance to the second car park. Finally, no changes will be made to the main entrance and original car park.(183 words, band 9)IELTS Writing Task 1: 'age distribution' answer The charts below compare the age structure of the populations of France and India in 1984.The two charts compare the populations of France and India in terms of age distribution by gender in the year 1984.It is clear that the population of India was younger than that of France in 1984, with a noticeably larger proportion of people aged under 20. France, on the other hand, had a significantly larger percentage of elderly inhabitants.In India, close to 14% of people were aged 5 or under, and each five-year age bracket above this contained an increasingly smaller proportion of the population. France’s population, by contrast, was more evenly distributed across the age ranges, with similar figures (around 7% to 8% of all people) for each five-year cohort between the ages of 0 and 40. Somewhere between 10% and 15% of all French people were aged 70 or older, but the equivalent figure for India was only 2%.Looking more closely at gender, there was a noticeably higher proportion of French women than men in every cohort from age 50 upwards. For example, almost 3% of French 70- to 75-year-olds were women, while just under 2% were men. No significant gender differences can be seen on the Indian population chart.(199 words, band 9)IELTS Writing Task 1: pie chart answerThe pie charts below show how dangerous waste products are dealt with in three countries.范文:The charts compare Korea, Sweden and the UK in terms of the methods used in each country to dispose of harmful waste.It is clear that in both the UK and Sweden, the majority of dangerous waste products are buried underground. By contrast, most hazardous materials in the Republic of Korea are recycled.Looking at the information in more detail, we can see that 82% of the UK’s dangerous waste is put into landfill sites. This disposal technique is used for 55% of the harmful waste in Sweden and only 22% of similar waste in Korea. The latter country recycles 69% of hazardous materials, which is far more than the other two nations.While 25% of Sweden's dangerous waste is recycled, the UK does not recycle at all. Instead, it dumps waste at sea or treats it chemically. These two methods are not employed in Korea or Sweden, which favour incineration for 9% and 20% of dangerous waste respectively.(159 words, band 9)IELTS Writing Task 1: 'flood diagram' answer The diagrams below show how houses can be protected in areas which are prone to flooding.Here's my full band 9 report:The diagrams compare two different methods of defence for homes which are at risk of being flooded.The key difference between the diagrams is that they show flood protection with and without a stopbank. In either case, the at-risk home is raised on stilts above ground level.The first diagram shows how a stopbank acts as a flood barrier to stop river water from flooding homes. The stopbank is a small mound of land next to the river that is higher than the 100-year flood level, and prevents the river from bursting its banks. Nearby houses can be built on stilts to prevent flooding from rainwater, and a floodgate beneath the stopbank can be opened to allow this ‘ponding’ to drain off into the river.When there is no stopbank, as shown in the second diagram, there will be nothing to stop the river from flooding. In this case, the solution is to put buildings on stilts. The height of the stilts is measured so that the floor of the house is 300mm above the 100-year flood level. This measurement is called the ‘freeboard’.IELTS Writing Task 1: 'waste table' essayThe table below shows the amount of waste production (in millions of tonnes) in six different countries over a twenty-year period.The chart compares the amounts of waste that were produced in six countries in the years 1980, 1990 and 2000.In each of these years, the US produced more waste than Ireland, Japan, Korea, Poland and Portugal combined. It is also noticeable that Korea was the only country that managed to reduce its waste output by the year 2000.Between 1980 and 2000, waste production in the US rose from 131 to 192 million tonnes, and rising trends were also seen in Japan, Poland and Portugal. Japan’s waste output increased from 28 to 53 million tonnes, while Poland and Portugal saw waste totals increase from 4 to 6.6 and from 2 to 5 million tonnes respectively.The trends for Ireland and Korea were noticeably different from those described above. In Ireland, waste production increased more than eightfold, from only 0.6 million tonnes in 1980 to 5 million tonnes in 2000. Korea, by contrast, cut its waste output by 12 million tonnes between 1990 and 2000.IELTS Writing Task 1: table essayThe table below shows changes in the numbers of residents cycling to work in different areas of the UK between 2001 and 2011The table compares the numbers of people who cycled to work in twelve areas of the UK in the years 2001 and 2011.Overall, the number of UK commuters who travelled to work by bicycle rose considerably over the 10-year period. Inner London had by far the highest number of cycling commuters in both years.In 2001, well over 43 thousand residents of inner London commuted by bicycle, and this figure rose to more than 106 thousand in 2011, an increase of 144%. By contrast, although outer London had the second highest number of cycling commuters in each year, the percentage change, at only 45%, was the lowest of the twelve areas shown in the table.Brighton and Hove saw the second biggest increase (109%) in the number of residents cycling to work, but Bristol was the UK’s second city in terms of total numbers of cycling commuters, with 8,108 in 2001 and 15,768 in 2011. Figures for the other eight areas were below the 10 thousand mark in both years.(172 words, band 9)IELTS Writing Task 1: process diagramThe diagram below shows how solar panels can be used to provide electricity for domestic use.The picture illustrates the process of producing electricity in a home using solar panels.It is clear that there are five distinct stages in this process, beginning with the capture of energy from sunlight. The final two steps show how domestic electricity is connected to the externalpower supply.At the first stage in the process, solar panels on the roof of a normal house take energy from the sun and convert it into DC current. Next, this current is passed to an inverter, which changes it to AC current and regulates the supply of electricity. At stage three, electricity is supplied to the home from an electrical panel.At the fourth step shown on the diagram, a utility meter in the home is responsible for sending any extra electric power outside the house into the grid. Finally, if the solar panels do not provide enough energy for the household, electricity will flow from the utility grid into the home through the meter.Note:I've underlined examples of the two language features that make process diagram descriptions special: 'steps' language, and passive verbs.IELTS Writing Task 1: bar chartThe bar graph shows the global sales (in billions of dollars) of different types of digital games between 2000 and 2006.The bar chart compares the turnover in dollars from sales of video games for four different platforms, namely mobile phones, online, consoles and handheld devices, from 2000 to 2006.It is clear that sales of games for three out of the four platforms rose each year, leading to a significant rise in total global turnover over the 7-year period. Sales figures for handheld games were at least twice as high as those for any other platform in almost every year.In 2000, worldwide sales of handheld games stood at around $11 billion, while console games earned just under $6 billion. No figures are given for mobile or online games in that year. Overthe next 3 years, sales of handheld video games rose by about $4 billion, but the figure for consoles decreased by $2 billion. Mobile phone and online games started to become popular, with sales reaching around $3 billion in 2003.In 2006, sales of handheld, online and mobile games reached peaks of 17, 9 and 7 billion dollars respectively. By contrast, turnover from console games dropped to its lowest point, at around $2.5 billion.IELTS Writing Task 1: map essayThe map shows the growth of a village called Chorleywood between 1868 and 1994.It is clear that the village grew as the transport infrastructure was improved. Four periods of development are shown on the map, and each of the populated areas is near to the main roads, the railway or the motorway.From 1868 to 1883, Chorleywood covered a small area next to one of the main roads. Chorleywood Park and Golf Course is now located next to this original village area. The village grew along the main road to the south between 1883 and 1922, and in 1909 a railway line was built crossing this area from west to east. Chorleywood station is in this part of the village.The expansion of Chorleywood continued to the east and west alongside the railway line until1970. At that time, a motorway was built to the east of the village, and from 1970 to 1994, further development of the village took place around motorway intersections with the railway and one of the main roads.IELTS Writing Task 1: flow chart essayThe chart below shows the process of waste paper recycling.The flow chart shows how waste paper is recycled. It is clear that there are six distinct stages in this process, from the initial collection of waste paper to the eventual production of usable paper.At the first stage in the paper recycling process, waste paper is collected either from paper banks, where members of the public leave their used paper, or directly from businesses. This paper is then sorted by hand and separated according to its grade, with any paper that is not suitable for recycling being removed. Next, the graded paper is transported to a paper mill.Stages four and five of the process both involve cleaning. The paper is cleaned and pulped, and foreign objects such as staples are taken out. Following this, all remnants of ink and glue are removed from the paper at the de-inking stage. Finally, the pulp can be processed in a paper making machine, which makes the end product: usable paper.(160 words, band 9)Note: I joined the introduction and overview together because they were both short. Try to analyse the essay - why is it worth band 9?IELTS Writing Task 1: stacked bar chart essay The chart below shows the total number of Olympic medals won by twelve different countries.The bar chart compares twelve countries in terms of the overall number of medals that they have won at the Olympic Games.It is clear that the USA is by far the most successful Olympic medal winning nation. It is also noticeable that the figures for gold, silver and bronze medals won by any particular country tend to be fairly similar.The USA has won a total of around 2,300 Olympic medals, including approximately 900 gold medals, 750 silver and 650 bronze. In second place on the all-time medals chart is the Soviet Union, with just over 1,000 medals. Again, the number of gold medals won by this country is slightly higher than the number of silver or bronze medals.Only four other countries - the UK, France, Germany and Italy - have won more than 500 Olympic medals, all with similar proportions of each medal colour. Apart from the USA and the Soviet Union, China is the only other country with a noticeably higher proportion of gold medals (about 200) compared to silver and bronze (about 100 each).(178 words, band 9)IELTS Writing Task 1: mobile phones essay范文:The table compares the percentages of people using different functions of their mobile phones between 2006 and 2010. Throughout the period shown, the main reason why people used their mobile phones was to make calls. However, there was a marked increase in the popularity of other mobile phone features, particularly the Internet search feature.In 2006, 100% of mobile phone owners used their phones to make calls, while the next most popular functions were text messaging (73%) and taking photos (66%). By contrast, less than 20% of owners played games or music on their phones, and there were no figures for users doing Internet searches or recording video.Over the following 4 years, there was relatively little change in the figures for the top three mobile phone features. However, the percentage of people using their phones to access the Internet jumped to 41% in 2008 and then to 73% in 2010. There was also a significant rise in the use of mobiles to play games and to record video, with figures reaching 41% and 35% respectively in 2010.Note:The above essay isn't perfect, but it's still good enough for a band 9. You are not expected to write a masterpiece in only 20 minutes.IELTS Writing Task 1: line graph essayThe line graph compares average yearly spending by Americans on mobile and landline phone services from 2001 to 2010.It is clear that spending on landline phones fell steadily over the 10-year period, while mobile phone expenditure rose quickly. The year 2006 marks the point at which expenditure on mobile services overtook that for residential phone services.In 2001, US consumers spent an average of nearly $700 on residential phone services, compared to only around $200 on cell phone services. Over the following five years, average yearly spending on landlines dropped by nearly $200. By contrast, expenditure on mobiles rose by approximately $300.In the year 2006, the average American paid out the same amount of money on both types of phone service, spending just over $500 on each. By 2010, expenditure on mobile phones had reached around $750, while the figure for spending on residential services had fallen to just over half this amount.(162 words, band 9)IELTS Writing Task 1: life cycle essayThe diagram shows the life cycle of the honey bee. Two things to consider are:how to summarise the diagram before describing the stages in detailwhether to use active or passive verb formsThe diagram illustrates the various stages in the life of a honey bee. We can see that the complete life cycle lasts between 34 and 36 days. It is also noticeable that there are five main stages in the development of the honey bee, from egg to mature adult insect.The life cycle of the honey bee begins when the female adult lays an egg; the female typically lays one or two eggs every 3 days. Between 9 and 10 days later, each egg hatches and the immature insect, or nymph, appears.During the third stage of the life cycle, the nymph grows in size and sheds its skin three times. This moulting first takes place 5 days after the egg hatches, then 7 days later, and again another 9 days later. After a total of 30 to 31 days from the start of the cycle, the young adult honey bee emerges from its final moulting stage, and in the space of only 4 days it reaches full maturity. (169 words, band 9)IELTS Writing Task 1: climate essayThe climograph below shows average monthly temperatures and rainfall in the city of Kolkata.The chart compares average figures for temperature and precipitation over the course of a calendar year in Kolkata.It is noticeable that monthly figures for precipitation in Kolkata vary considerably, whereas monthly temperatures remain relatively stable. Rainfall is highest from July to August, while temperatures are highest in April and May.Between the months of January and May, average temperatures in Kolkata rise from their lowest point at around 20°C to a peak of just over 30°C. Average rainfall in the city also rises over the same period, from approximately 20mm of rain in January to 100mm in May.While temperatures stay roughly the same for the next four months, the amount of rainfall more than doubles between May and June. Figures for precipitation remain above 250mm from June to September, peaking at around 330mm in July. The final three months of the year see a dramatic fall in precipitation, to a low of about 10mm in December, and a steady drop in temperatures back to the January average.(173 words, band 9)IELTS Writing Task 1: full essay about 2 bar chartsThe bar charts compare students of different ages in terms of why they are studying and whether they are supported by an employer.It is clear that the proportion of students who study for career purposes is far higher among the younger age groups, while the oldest students are more likely to study for interest. Employer support is more commonly given to younger students.Around 80% of students aged under 26 study to further their careers, whereas only 10% study purely out of interest. The gap between these two proportions narrows as students get older, and the figures for those in their forties are the same, at about 40%. Students aged over 49 overwhelmingly study for interest (70%) rather than for professional reasons (less than 20%).Just over 60% of students aged under 26 are supported by their employers. By contrast, the 30-39 age group is the most self-sufficient, with only 30% being given time off and help with fees. The figures rise slightly for students in their forties and for those aged 50 or more.(178 words, band 9)IELTS Writing Task 1: 'chart without years' essayThe chart below shows numbers of incidents and injuries per 100 million passenger miles travelled (PMT) by transportation type in 2002.The bar chart compares the number of incidents and injuries for every 100 million passenger miles travelled on five different types of public transport in 2002.It is clear that the most incidents and injuries took place on demand-response vehicles. By contrast, commuter rail services recorded by far the lowest figures.A total of 225 incidents and 173 injuries, per 100 million passenger miles travelled, took place on demand-response transport services. These figures were nearly three times as high as those for the second highest category, bus services. There were 76 incidents and 66 people were injured on buses.Rail services experienced fewer problems. The number of incidents on light rail trains equalled the figure recorded for buses, but there were significantly fewer injuries, at only 39. Heavy rail services saw lower numbers of such events than light rail services, but commuter rail passengers were even less likely to experience problems. In fact, only 20 incidents and 17 injuries occurred on commuter trains.(165 words, band 9)IELTS Writing Task 1: graph showing future yearsThe graph below shows the proportion of the population aged 65 and over between 1940 and 2040 in three different countries.The line graph compares the percentage of people aged 65 or more in three countries over a period of 100 years.It is clear that the proportion of elderly people increases in each country between 1940 and 2040. Japan is expected to see the most dramatic changes in its elderly population.In 1940, around 9% of Americans were aged 65 or over, compared to about 7% of Swedish people and 5% of Japanese people. The proportions of elderly people in the USA and Sweden rose gradually over the next 50 years, reaching just under 15% in 1990. By contrast, the figures for Japan remained below 5% until the early 2000s.Looking into the future, a sudden increase in the percentage of elderly people is predicted for Japan, with a jump of over 15% in just 10 years from 2030 to 2040. By 2040, it is thought that around 27% of the Japanese population will be 65 years old or more, while the figures for Sweden and the USA will be slightly lower, at about 25% and 23% respectively.(178 words, band 9)IELTS Writing Task 1: graph showing future yearsThe graph below shows the proportion of the population aged 65 and over between 1940 and 2040 in three different countries.The line graph compares the percentage of people aged 65 or more in three countries over a period of 100 years.It is clear that the proportion of elderly people increases in each country between 1940 and 2040. Japan is expected to see the most dramatic changes in its elderly population.In 1940, around 9% of Americans were aged 65 or over, compared to about 7% of Swedish people and 5% of Japanese people. The proportions of elderly people in the USA and Sweden rose gradually over the next 50 years, reaching just under 15% in 1990. By contrast, the figures for Japan remained below 5% until the early 2000s.Looking into the future, a sudden increase in the percentage of elderly people is predicted for Japan, with a jump of over 15% in just 10 years from 2030 to 2040. By 2040, it is thought that around 27% of the Japanese population will be 65 years old or more, while the figures for Sweden and the USA will be slightly lower, at about 25% and 23% respectively.(178 words, band 9)IELTS Writing Task 1: 'table' essayThe table below gives information on consumer spending on different items in five different countries in 2002.Percentage of national consumer expenditure by category – 2002范文;The table shows percentages of consumer expenditure for three categories of products and services in five countries in 2002.It is clear that the largest proportion of consumer spending in each country went on food, drinks and tobacco. On the other hand, the leisure/education category has the lowest percentages in the table.Out of the five countries, consumer spending on food, drinks and tobacco was noticeably higher in Turkey, at 32.14%, and Ireland, at nearly 29%. The proportion of spending on leisure and education was also highest in Turkey, at 4.35%, while expenditure on clothing and footwear was significantly higher in Italy, at 9%, than in any of the other countries.It can be seen that Sweden had the lowest percentages of national consumer expenditure for food/drinks/tobacco and for clothing/footwear, at nearly 16% and just over 5% respectively. Spain had slightly higher figures for these categories, but the lowest figure for leisure/education, at only 1.98%.IELTS Writing Task 1: graph and table essay The graph and table below give information about water use worldwide and water consumption in two different countries.。
IELTS Writing Task 1: describe a processHere is some more advice for describing a process diagram. The question I'm using comes from Cambridge IELTS 6. It's also on this website(go down the page to test 3).Advice:1.Introduction: paraphrase the question statement (one sentence).2.Summary paragraph: write how many steps there are in each of the2 diagrams. You could also mention the first step and the last stepin each process (two sentences).3.Details: describe each step in the diagrams. We'll look at this nextweek.Here's my example introduction and summary paragraph:The figures illustrate the stages in the life of a silkworm and the process of producing silk cloth.There are four main stages in the life cycle of the silkworm, from eggs to adult moth. The process of silk cloth production involves six steps, from silkworm cocoon to silk material.Can you see the paraphrasing I have used? Next week we'll work on describing the stages in each process.paraphrasing:diagrams=figuresshow=illustratestages=stepsthe life cycle of the silkworm=the stages in the life of a silkworm production=process of producing...=process of ...production.there are ...stages=...involves ...steps.Hello Simon,I hope the paraphrasing aboved is correct. I enjoy you daily lessions very much. I am preparing for the IELTS test, and your lessons help me a lot. Thank you very much.Here I have some qustions about this lession. The following is my sentence:There are six stages in the process of silk cloth production, beginning with selecting cocoons. Then the qualified cocoons will* be boiled, unwind into* thread, and the thread will be twisted and finally weaved.My first question is that should I use future tense (will be boiled....) or present simple tense (is boiled)?The second question is that which preposition should i use? (the qualified cocoons will be unwind into* thread: should I use "into") ?I am looking forward to your reply. Thanks again.Best wishesTheresaHi Theresa,Your paraphrasing is perfect. Here are the answers to your questions:1. I would use the present simple to describe processes e.g. "The selected (not 'qualified') cocoons are boiled."2. I would avoid trying to use a preposition - I'd find another way to describe it e.g. "The cocoon is unwound, leaving a single thread". Or, "it is then possible to unwind the cocoon in order to have a thread of silk."Hope this helps,SimonWhen describing stages in a process:1.Start at the beginning. Use words that clearly show the stages (e.g.firstly, at the first stage, after that, next, following this,finally).e the present simple tense.e the 'active' when someone or something does the action (e.g.the moth lays its eggs).e the 'passive' when it is not important to say who or what doesthe action (e.g. the silk cloth is dyed).Here are some example sentences from last week's question: The life cycle of the silkworm begins when the moth lays its eggs.∙After 10 days the silkworm larva is born, and 4 to 6 weeks later the larva produces silk thread.∙At the first stage in the production of silk cloth the cocoon is boiled in water.∙Next, the silk thread is unwound and twisted.∙It is then dyed, to give it colour, or woven to make cloth and then dyed.I have highlighted the passive verbs and the words that mark stages.Advice: you can avoid difficult passive verbs like 'unwound' or 'woven' by writing 'it is then possible to unwind' or 'the thread is then ready for weaving'.IELTS Writing Task 1: describe a tableToday I'm going to look at a question from Cambridge IELTS book 5 (page 98). You can see the question and an example answer on this website.The problem with the example answer is that it is long (233 words) and quite complicated. I'm going to suggest some changes, starting with the introduction and summary paragraph.1. Introduction. Paraphrase the question (make small changes):∙The table shows data about the underground rail networks in six major cities.2. Summary paragraph. Look for the most noticeable feature or main trend:∙The table compares the six networks in terms of their age, size and the number of people who use them each year. It is clear that the three oldest underground systems are larger and serve significantly more passengers than the newer systems.Next week I'll add the final paragraphs.Last week I wrote the introduction and summary paragraph for this question. The example answer on the website is good, but it's 233 words long, it contains a few mistakes, and it's a bit complicated.I've now written the full essay. I've followed my usual 4 paragraph structure (see previous Task 1 lessons) and I've tried to make the essay clear and simple.I'd give my essay a band 9, but maybe I'm biased! Please let me know if you find any mistakes in my writing (nobody's perfect), or ask if anything is unclear.Describe a table (Cambridge IELTS 5, page 98)The table shows data about the underground rail networks in six major cities. The table compares the six networks in terms of their age, size and the number of people who use them each year. It is clear that the three oldest underground systems are larger and serve significantly more passengers than the newer systems.The London underground is the oldest system, having opened in 1863. It is also the largest system, with 394 kilometres of route. The second largest system, in Paris, is only about half the size of the London underground, with 199 kilometres of route. However, it serves more people per year. While only third in terms of size, the Tokyo system is easily the most used, with 1927 million passengers per year.Of the three newer networks, the Washington DC underground is the most extensive, with 126 kilometres of route, compared to only 11 kilometres and 28 kilometres for the Kyoto and Los Angeles systems. The Los Angeles network is the newest, having opened in 2001, while the Kyoto network is the smallest and serves only 45 million passengers per year.(185 words)Analysis of this essay:∙ Simple paragraph structure: Introduction, summary paragraph, one paragraph about the 3 older systems, one paragraph about the 3newer systems.∙ Select key information: There is too much information to include in ashort essay. I found it difficult to write less than 185 words. Notice that Itried to include only one (sometimes two) statistics for each city.∙ Compare as much as possible: e.g. London is the oldest and largest; Paris is about half the size but serves more people.∙ Commas: Notice how I use commas to add extra information e.g. “…isthe oldest system, having opened in…” I often use the word “with” aftera comma to add a figure to the end of a sentence e.g. “…is the mostused, with 1927 million passengers.”ModelIt is a nice piece of writingI have tried one.The table reveals information on the Underground railway station among six cities during two centuries.As is shown by the table, London, the oldest railway system, has by farthe longest distance with 394 km, closely followed Paris, the second oldest underground railway , with 199 km, or equaling a haft distance of London system. This then preceded the opening of the railway system in Tokyo, Washington DC, Kyoto and Los Angeles.Interestingly, although Tokyo has the middle position as regards the kilometers of route with 155 km, it appears to be the highest system used by passengers, with 1927 million. This number is considerably higher than that of both Paris and London. These figures are 1191 and 775, respectively.Surprisingly, Kyoto and Los Angeles have the lowest number of either kilometers of route and passengers per year. In fact, the number of passengers using both of them is a great deal less than that of Washington DC, with approximately three times less , while the distance of Kyoto and Los Angeles railway system is negligible (ranging from 11 to 28).In conclusion, London has the highest number of kilometers of route, while Tokyo occurs to be the successful railway system with the overwhelming majority of passengers(193 ws)IELTS Writing Task 1: comparing (bar charts)。