IELTS写作task1--9分范文(33篇)
- 格式:doc
- 大小:730.03 KB
- 文档页数:38
雅思写作真题9分范文Is learning a foreign language essential or awaste of time一、原题:Some people feel that learning a foreign language is an essential component of a child's education. Others feel that learning a foreign language is often a waste of time that can be better spent on learning about technology and other more vocational subjects.Discuss both views and give your own opinion.Give reasons for your answer and include any relevant examples from your knowledge or experience.You should write at least 250 words.二、范文:Throughout the history of education, learning a foreign language or languages has been a constant component. Of course, many people feel that this is really an unnecessary part of education for everyone, but this is not a point of view that I share.在整个教育史上,学习一门或多门外语一直是一个不变的组成部分。
当然,许多人认为这对每个人来说都是教育中不必要的部分,但我不同意这种观点。
雅思九分作文范文题目:Some people prefer to live in a small town. Others prefer to live in a big city. Which place would you prefer to live in? Use specific reasons and details to support your answer.范文:Well, if you ask me whether I'd rather live in a small town or a big city, it's like choosing between a cozy little nook and a bustling beehive. And I've got to say, I'm more of a big city kind of person.First off, big cities are like a never ending carnival of opportunities. There are jobs galore! I mean, whether you want to be a high flying corporate hotshot, an avant garde artist, or a whiz kid techie, a big city has got your back. In a small town, your career options might be as limited as the flavors at the local ice cream parlor you know, just vanilla and chocolate, while in the city, it's like having a 31 flavor bonanza ofcareer choices.Then there's the food. Oh, man! Big cities are a foodie's paradise. You can have sushi for breakfast, tacos for lunch, and a plate of authentic Italian pasta for dinner, all within a few blocks. In a small town, you might be stuck with the same old diner grub day in and day out. It's like eating the same song on repeat, while in the city, it's a whole differenthit every meal.Entertainment is another huge plus in the big city. Concerts, theaters, art galleries you name it. There's always something going on. It's like living inside a perpetual movie premiere. In a small town, your idea of awild night out might be a game of bingo at the community hall. I don't know about you, but I'd rather be dancing at a trendy nightclub or catching a live band at a smoky underground bar.Sure, small towns have their charm. The peace and quiet, the friendly neighbors who know your name and your family history. It's like living in a big, warm hug. But for me, the energy, the variety, and the constant buzz of a big city are just too hard to resist. It's like the city is a big, shiny magnet, and I'm just a little piece of metal helplessly drawn to it. So, give me the skyscrapers, the traffic jams, and the anonymous crowds any day. Because in the city, I feel like I'm part of a huge, exciting story, and that's just the kind of life I'm after.。

IELTS Task 1范文1.A glance at the graph provided reveals some striking similarities between the Chinese and US birth rates during the period from 1920 to 2000. It is evident that both nations saw considerable fluctuations in fertility, with lows during the 1940s and highs during the 1950s.1920 to15 percent in 1935, China’sThis was followed by a period of exponential growth, with fertility in the countrypercent in 1950.in this figure.The US birth rate, meanwhile, and 13 percentin 1950, followed by a steady fall.It is interesting to note that whileuntil 1950, the gap between the two after this time as fertility in China slid away.2.Given are two figures concerning criminality in Britain. The first provides data on the rates of conviction among men and women of various ages, while the second indicates the gender balance of the UK prison population.the rate of conviction among Britsof both during adolescence the age of about 20. men are far more likely to offend than women.From a negligible 2 percent among 10-year-old boys, the male conviction rateto approximately 20-year-olds. The percentage of0 percent among girls of 10 to some 5 percent for 20-year-olds. The however, see dramatic decreases in criminality among both sexes. A mere 2 percent of crimes are committed by 60-year-old men and 0 percent by women of the same age.As for the proportion of male and female prison inmates, men outnumber women 24 to 1. Some 96 percent of all prisioners are men, while the remainder are female.A glance at the two pie charts provided reveals the relative popularity of various leisure activities among European adults in 1985 and 1995.Of these activities in both years, at 32 percent in 1985 and a slightly lower 30 percent in 1995. Yet, by far the most significant change to take place during this period was the increased popularity of computer games. Not a single respondent to the survey rated playing computer games as their preferred leisure activity in 1985. However, by 1995 this figure stood at 27 percent –the second highest overall. Also more popular in 1995 was talking with friends, at 26 percent compared to 21 percent a decade earlier.In stark contrast, however, all other activities decreased in popularity. Eating out –which was the second most widely enjoyed pastime in 1985,percent of respondents – slipped to a mere 8 percent in 1995. Likewisealso considerable decreases in the popularity ratings of talking withactivities and (as previously mentioned) watching television.4.Given are two figures providing a comparison of internet use in five European countries (namely Switzerland, Germany, France, Spain and the UK) in 1995, 2000 and 2004, as well as the popularity of internet shopping in these countries.It is evident from the information provided that Britain had by far the highest number of internet users in all three years. From 16 million in 1995, the number of British users climbed steadily to 22 million in 2000, before soaring to a staggering 41 million in 2004. Second in terms of internet use was Germany. This country saw a threefold increase during the period in question, from 5 million people in 1995 to 14 million in 2000 and 15 million in 2004. A similar increase took place in France. The two nations with the fewest internet users, meanwhile, were Switzerland and Spain. It is also interesting to note that internet shopping was far more common in the UK than in any other country listed.In fact, the prevalence of internet shopping in Britain was double that of Germany and triple that of Switzerland. France and Spain, meanwhile, had moderate levels of online shopping.A glance at the table provided reveals a number of clear differences between the major metro systems of the world in terms of age, scale and annual carrying capacity.One particularly interesting fact highlighted by the figure is that the more recently established metro systems are considerably shorter than the older ones. Completed in 1863, the London underground is the oldestthe longest, extending for 1100 kilometres.stark contrast, howeverand 2001 respectively– are far shorter. The formerthe latter just 14 kilometre s.With regard to yearly carrying capacity, the metro systems mentioned in the table vary greatly. The Tokyo metro is equipped to carry the largest number of passengers, at 1434 million. With 850 million, meanwhile, the Paris metro has the second largest carrying capacity. The systems with the smallest capacities are those of Kyoto and Washington DC, transporting just 11 million and 70 million people per year respectively.6.Given are two column graphs comparing the rates of secondary and tertiary education among males and females in various different parts of the world.compared with only 20 Asia, meanwhile, have moderate levels of secondary education – between 40 and 50 percent for both sexes.With regard to higher education, the figures are much lower throughout the world. In Europe, some 50 percent of adult females and 45 percent of adult males gain a higher education.Sub-Saharan Africa The figures for Latin America and East Asia are marginally higher thanAlso noteworthy is the fact that receive a secondary education in all regions except East Asia, but less likely to receive a tertiary education in all regions except Europe.。
剑桥雅思写作9分范文全文共四篇示例,供读者参考第一篇示例:剑桥雅思写作9分范文是许多考生梦寐以求的目标,因为在雅思考试中,写作部分是考生们最容易失分的一个环节,而如果能够获得9分的成绩,不仅可以为自己的留学梦想加分,还可以为自己的英语水平证明注入信心。
下面我将为大家分享一篇剑桥雅思写作9分范文,供大家参考。
雅思写作的主题通常是关于社会、文化、环境等方面的话题,以此来考察考生们对于当今社会问题的理解和分析能力。
以下是一篇经典的剑桥雅思写作9分范文:题目:现代社会中越来越多的年轻人选择过简单的生活方式,他们放弃了追求财富和名利的念头,转而追求简单而真实的生活。
请你谈谈对这种趋势的看法。
范文:In today's society, more and more young people are choosing to live a simple life. They are abandoning the pursuit of wealth and fame, instead opting for a simple and authentic lifestyle. This trend has sparked a heated debate among people.On the one hand, those who support this trend argue that the pursuit of simplicity can bring a sense of peace and contentment to individuals. In a fast-paced and materialistic society, many young people feel overwhelmed by the pressureto succeed and constantly compare themselves to others. By choosing to live a simple life, they can focus on what truly matters to them, such as personal relationships, health, and personal growth. Moreover, living a simple life can also have positive effects on the environment, as it involves consuming less and reducing waste.以上就是一篇经典的剑桥雅思写作9分范文,希望对大家有所帮助。

雅思作文之Task1范文The bar chart compares the amount of water used in the US for household, industrial and agricultural purposes for three different time periods: 2000, 2005 and 2010.(首先点明所描述的表格类型以及题目)Use of water for domestic purposes increased slightly over the ten-year period, from about 5000 litres of water in 2000 to 6500 in 2010. At the same time, growth was very steady, exactly 500 liters every five years.(由于时间原因,描述图表的时候关注极值和趋势)Industrial use also increased over this period and the most dramatic growth was from 2005 to 2010, when it rose by 3000 litres. In fact, industrial use was much higher than either agricultural or domestic use. For instance, in 2005 industrial use, which was 12,000 litres, was almost as high as agricultural and domestic use put together, and in 2010 it was more. While 15,000 litres of water went to industry in that year, only 11,000 litres were used for other purposes.By contrast, agricultural use decreased slightly and steadily, at 500 litres per 5 year period. 7000 litres of water went to farming in 2000, whereas only 6000 litres were used in 2010. In fact, the amount of water used for agriculture dropped lower than that used for households in 2010, even though it had been higher before that.Overall, usage of water in the US is increasing from about 20,000 litres in 2000 to almost 30,000 litres in 2010.该小作文在用词方面比较多变,比如“增加”,考生用了"incereased", "rose", "growth", 用"decreased"和"dropped"来表示减少。
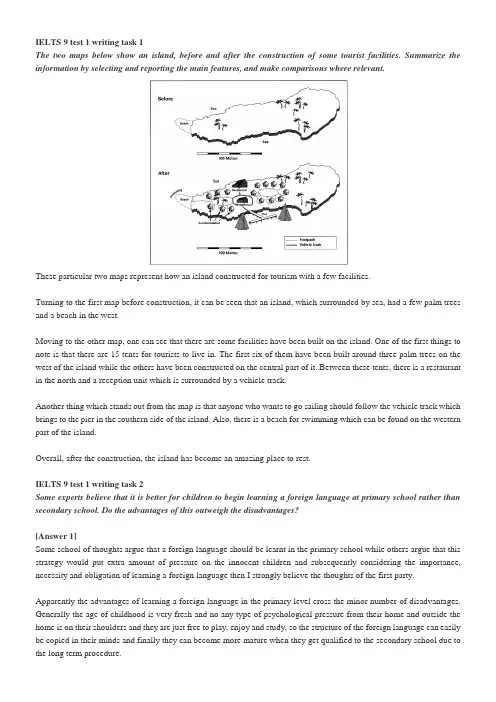
IELTS 9 test 1 writing task 1The two maps below show an island, before and after the construction of some tourist facilities. Summarize the information by selecting and reporting the main features, and make comparisons where relevant.These particular two maps represent how an island constructed for tourism with a few facilities.Turning to the first map before construction, it can be seen that an island, which surrounded by sea, had a few palm trees and a beach in the west.Moving to the other map, one can see that there are some facilities have been built on the island. One of the first things to note is that there are 15 tents for tourists to live in. The first six of them have been built around three palm trees on the west of the island while the others have been constructed on the central part of it. Between these tents, there is a restaurant in the north and a reception unit which is surrounded by a vehicle track.Another thing which stands out from the map is that anyone who wants to go sailing should follow the vehicle track which brings to the pier in the southern side of the island. Also, there is a beach for swimming which can be found on the western part of the island.Overall, after the construction, the island has become an amazing place to rest.IELTS 9 test 1 writing task 2Some experts believe that it is better for children to begin learning a foreign language at primary school rather than secondary school. Do the advantages of this outweigh the disadvantages?[Answer 1]Some school of thoughts argue that a foreign language should be learnt in the primary school while others argue that this strategy would put extra amount of pressure on the innocent children and subsequently considering the importance, necessity and obligation of learning a foreign language then I strongly believe the thoughts of the first party.Apparently the advantages of learning a foreign language in the primary level cross the minor number of disadvantages. Generally the age of childhood is very fresh and no any type of psychological pressure from their home and outside the home is on their shoulders and they are just free to play, enjoy and study, so the structure of the foreign language can easily be copied in their minds and finally they can become more mature when they get qualified to the secondary school due toOn the other hand some school teachers devise quiet complicated teaching methodologies for teaching students and in the result the children get bored and failed in clearing the examinations of the foreign language. Therefore students could get mentally confused and discouraged to follow up the other school subjects as well. For instance my cousin was trying hard to learn the English language but not succeeded to pass the very basic English language examinations and he also complained the identical reason.To sum up all the observations then we can get a perception that teaching a foreign language to the students of the primary school is the best idea and beneficial for the future of the students but meanwhile a very slow and progressive, enjoyable and transparent teaching strategies should be planned in order to provide a very delightful environment to the lower aged students.[Answer 2]Some experts claim that learning a foreign language at primary school is better than secondary school. While it has some undeniable drawbacks, I could suggest that the children should begin learning the second language from being at primary school.Starting learning foreign language at the early age has many advantages for the primary students. Firstly, learning any language other their mother tongue is just a process of repeating and repeating again the words, phrases, sentences and being also familiar with grammar. They are in control of them to remember and use them regularly in many situations to form natural reaction of that language. Otherwise, almost the primary students have no pressure to learn so hardly is there treat in exam instead really learn. Secondly, it is better for the children to have more time to practice when they approach the foreign language soon. Those students will own completely that second language better than others starting at the secondary school. Additional, children have more chances in their life to take advantage of the foreign language which they master.Nevertheless, we cannot deny some disadvantages of learning a foreign language at secondary school. If teachers at primary school are not good enough to teach, children easily have some fundamental mistakes which are very difficult to fix. In another hand, the children at primary school does not have as much awareness of the importance of owning the second language as those of secondary school.In conclusion, learning a foreign language at secondary school have some shortcoming above but I truly believe that the children should start learning other language at primary.IELTS 9 test 2 writing task 1The chart below shows the total number of minutes (in billions) of telephone calls in the UK, divided into three categories, from 1995--2002. Summarize the information by selecting and reporting the main features, and make comparisons where relevant.This chart provides information about the total number of minutes of telephone calls, given in billion minutes, by three different type of call in the UK from 1995-2002. The date can be divided into two groups; one group experienced an increase, while the other group showed fluctuation.With respect to the former group, it can be seen that the national and international fixed line were increase gradually It start at about 38 billion minutes in 1995 and went up to 60 billion minutes in 2002. Likewise, the mobiles also showed the upward trend but the change was significantly. It jumped from about 3 billion minutes in 1995 to about 42 billion minutes in 2002.However, the latter group experienced the highest proportion of the number of minutes of telephone calls but fluctuated. It rose slightly from 70 billion minutes from 1995 to 1999, before falling slightly to the same point in 2002.Overall, over the 8 years observed the most use of the telephone call in the UK was still the local fixed line, while the other 2 groups became more popular.IELTS 9 test 2 writing task 2Some people believe that unpaid community service should be a compulsory part of high school programmes (for example working for a charity, improving the neighborhood or teaching sports to younger children). To what extent do you agree or disagree?Community service and pursuits such as charity work are praiseworthy and important ventures. There are both benefits for the individuals who are helped as well as for the volunteers. However, the issue of obligatory community service raises questions as to the extent of the advantages it would provide.If a high school student had to undertake an unpaid position working for a charity, then there may well be a certain amount of resentment on behalf of the student due to the lack of choice and the sacrifices they would have to make in terms of their free time. This could lead to the opposite effect of the programme's intention; to teach teenagers valuable life lessons, such as respect and empathy for others. Conversely, a compulsory volunteering project could have a positive effect on high school pupils as it would become a commonplace and expected situation. As these teenagers grow up, the attributes that they gain from community services could help to shape a better, more caring society.The opportunity to understand hard work, self-discipline and the duty of care that all individuals have is clearly ofmaintain a part-time job in order to support their families or save for their future. Compulsory community service would severely disrupt the requirements of these students and be incompatible with their lives and schedules.To exploit the various advantages that community service offers, it should be available in schools but not be obligatory. If improving the area by picking up litter, for example, was rewarded and respected by institutions, then teenagers would be more likely to happily engage in such activities. In a similar way, if schools were able to provide charitable pursuits that matched an individual's future aspirations, then this would be a better path to follow.In conclusion, I am convinced that offering well-respected and useful opportunities to do community service to high school students is far more beneficial than forced participation.IELTS 9 test 3 writing task 1The charts below give information on the ages of the populations of Yemen and Italy in 2000 and projections for 2050. Summarize the information by selecting and reporting the main features, and make comparisons where relevant.The pie charts illustrate the changes in different ageing sectors of populations in two countries, Yemen and Italy, in the period from 2000 and 2050.In general, the changing patterns of these countries are relatively different. For Yemen, a number of people ageing from 0 to 14 year olds accounted for half of population in 2000, are projected to decrease substantially to just over a third (37%)in 2050. In contrast, 15-19 age group, which just make up 46.3% in 2000, increase to a anticipated high percentage of population in 2050, with 57.3%. Leaving 60-plus category remain almost stable, rising slightly from 3.6% to 5.7% over the same period.On the other hand, Italy shows a opposite pattern of changes, where the aged( 60+ years) tend to more popular, with the predicted dramatic increase from about a fourth to 42,3% from 2000 to 2050. Whilst, people ageing from 15-59 are predicted to decline significantly from nearly two thirds to only 26,2% over the same period, Similarly, young people (0-14 years)also decrease, albeit insignificantly, from 14.3% to 11.5%.Overall, the charts show the two distinctive models of population in two countries: The ageing and young ones.IELTS 9 test 3 writing task 2however, say that this would have little effect on public health and that other measures are required. Discuss both these views and give your own opinion.Health is the most important thing in a person life. Some people believe that the standard of public health can be improved by increasing the number of sports facilities, while others refute this statement and emphasis for other methods. These points of view will be discussed in this order.Firstly, it is considered by many persons that the given solution will help people to do the exercise with fun, so more souls will attract to take part in the work out, which is beneficial for health, in their life. For example, in the India, there is a town, ‘Banga’, which has many physical recreation options, such as many grounds, parks and sports clubs. As the result of this, the young and old generations keep busy themselves in the playing and exercising. Consequently, this city has low rate of obesity cases in its region. It is clear from the above instance that the proposed method benefits a city, which leads to the superior public fitness. Thus, it is the reason that many thinkers gravitate towards this suggestion.On the other hand, many individuals disapprove this view and emphasis for the necessity of other ways to improve the health level. For example, they argue that in the 21st century, the life style of humans is very busy, so the people do not have the leisure time to involve themselves into sports activities. Therefore, they prefer other formulas tackle this problem such as the education: the consumption of fast food can be decreased by educating the creatures about the harmful impacts of junk food, and this step contributes in the improvement of the degree of public soundness automatically. Thus, that’s why many people are in the favor of this point of view.From the causes related to the reduction of fatness, time-shortage and education, the issue of increasing the sum of sports facilities has been supported and refuted. However, after the examination of above given facts, it is clear that the other measures are required to raise the level of public health. I strongly believed that the government should take some steps to find the more tactics to improve the level of citizen’s well-being. (Band: 7.4)IELTS 9 test 4 writing task 1The graph below gives information from a 2008 report about consumption of energy in the USA since 1980 with projections until 2030. Summarize the information by selecting and reporting the main features, and make comparisons where relevant.The line graph illustrates the amount of energy consumed in the USA since 1980 with prevision until 2030 according to a 2008 report.The general overview here is that the consumption by renewable energy as Nuclear, Solar/Wind, Hydro power is always surpassed by fossil fuel as Petrol and Oil, Coal, Natural gas.To specify, in the fossil fuel group, the amount of consumed Petrol and Oil fluctuated in the first fifteen year from 35 quadrillion units to 33 quadrillion units before a significant climb to 47 quadrillion units in 2030. Similarly, after an unstable trend from 20 quadrillion units in 1980 to 25 quadrillion in 2014, the figure of Natural gas will stay unchanged until 2030. However, Coal had seen a considerable increase to 22 quadrillion units in the amount of consumption, followed by gradual rise to 28 quadrillion units in 2030.In comparison, in the rest group, the amount of energy consumed by nuclear increased slightly from 4 quadrillion units to 6 quadrillion units in 2006, before keeping unchanged until 2025, and the figure will go up to 7 quadrillion in 2030. On the contrary, the consumption of Solar/Wind and Hydro power fluctuated to 4 and 3 quadrillion units in 2010, followed by an unchanged trend until 2030.IELTS 9 test 4 writing task 2Every year several languages die out. Some people think that this is not important because life will be easier if there are fewer languages in the world. To what extent do you agree or disagree this opinion?Nowadays, several languages die out every year. Some people think that this is not important because life will be easier if there are fewer languages in the world. I agree with mixed of these opinions. I think if we have fewer or one popular language in word, it will be help us to communicate easier to each other in many fields. But in other hand, it cause ruin many thing such as cultures, religions, costumes and indigenous languages. I try to illustrate these aspects in following paragraphs.To begin with, at the present time, world goes to globalization, and many people in world have to communicate to each other. They have to trade, voyage, and go to university and migration to other countries. Clearly if there is one common and popular language in world, this is very easier for them to go to other countries or have trading with other people in the world. For example, my dad is manager of Car Company; he went to Germany for management courses in last year. Now, he says if I did not have good base on Germany language I could not pass those courses. Hence, a common language could be helpful for all people.In the other hand, extinction of indigenous language cause to ruin many cultures, costumes, religions and literatures. These facts build many people and countries histories. These histories were built along many years and so many wars. For example, Greece language is common language in the old Greek. Greece people do many wars for conquering to other people. But now, with death of Greece language those attempts are destroy. Thus, it is very important to protect old and indigenous languages.To put it in a nut shell, I think it is very good to have a common language in the world, but we should respect to protect indigenous languages from forgetting. We should save our wealthy costumes, cultures and literatures.General training test A (Task 1)You are working for a company. You need to take some time off work and want to ask your manager about this. Write a letter to your manager. In your letter.explain why you want to take time off work.give details of the amount of time you need.suggest how your work could be covered while you are awayDear Mr Smith,This is one of your employees in the research section, Fereshteh Dayani. I am writing to request a one-week off work from 22nd to 29th of August.Unfortunately, my aunt had heart attack last night. We took her to a hospital and luckily she narrowly avoided the risk, but she has to be hospitalized for one week. As she has two little children and her husband is on a trip now, I have to look after my aunt’s two children during this week. Therefore I would appreciate your kindness and consideration if you accept my request for one-week off work.However, I will figure out some parts of my work through the internet while I am at home, also I will send the results for the colleagues via email. In addition, I asked one of my co-workers to present the income of my research instead of me in the next meeting which is supposed to be held on Wednesday morning.I really appreciate your understanding and cooperation in advance.Yours Sincerely,Fereshteh DayaniGeneral training test A (Task 2)Being a celebrity-such as a famous film star or sports personality-brings problems as well as benefits.Do you think that being a celebrity brings more benefits or more problems?There is no doubt that every gold coin has two sides, in that fashion every famous person also has both the effects in their quotidian life, positive and negative. Undoubtedly, as social icon celebrities are belongs to privilege class. Therefore, they enjoy much higher benefits that a common person. However, problems are not avoidable. Nevertheless, their natural life is not easy like others.Celebrities are belongs to diamond class of our society. They normally do not have economic problems and additionally the famous persons are having very good social, political and administrative contacts. Hence, they do enjoy many advantages without any pain, on the other hand, a simple man has to struggle quite a hard for the same facility. For instance, a child of a famous personality can get an admission to a top class school or college without any hindrance, perhaps, without any pretest or examination. Nonetheless, a common person will not get entry for his/her child in the same school or college, no matter how good the student is.Most importantly, celebrities are leading much secure life. Securities are allows securing a celebrities life and assets from strangers. Additionally, a famous person and his family are highly restricted from a common crowd.However, a celebrity con not lives his/her natural life for his iconic personality and security arrangements, deployed for him. Celebrities are allows surrounded by media, therefore, iconic people do not spend quality time publically. Additionally, famous personalities are role model for many people. Hence, each and every moves of a social icon is ac countable for judgment, for society’s benefits. In this situation, no human being can lead his/her life comfortable.In conclusion, being a celebrity, famous people have much stronger responsibilities towards the nation. Therefore, their life is protected and restricted too. However, being a famous personality, people do enjoy more benefits then hindrance. However, problems are not ignorable.General training test B (Task 1)On a recent holiday you lost a valuable item. Fortunately you have travel insurance to cover the cost of anything lost. Write a letter to the manager of your insurance company. In your letter.describe the item you lost.explain how you lost it.tell the insurance company what you would like them to doDear Sir/Madam,I am writing this letter to you regarding my loss of a valuable item: ‘an Apple iPhone 4S of white color’, during the vacatio n time last week. Allow me to describe the whole situation for you.7 days ago, I was in the London on a holiday trip with my family. At the June 27, a movie , Transformer : Age of Extinction, was being watched by us in a famous London cinema, then the cell phone slipped from my pocket on the theater’s sitting seat, and I was unaware about the happening of this unfortunate event, until we reached our hotel room. Then, the whole matter was come into my notice, and the enquiry was done by me immediately, but it was too late.Given the circumstances, now, it would be greatly appreciated by me if your company could give the claim, which the price, 400$, of the mobile phone, as soon as possible, so that a new cell phone can be bought by me. I shall be very thankful to you for this.Yours faithfully,James Smith.General training test B (Task 2)Some people think that the teenage years are the happiness times of most people’s lives. Others think that adult life brings more happiness, in spite of greater responsibilities. Discuss both these views and give your own opinion.[Answer 1]Every person wants to enjoy each stage of life happily. Some people believe that the best phase of life is teenage, while others perceive that adulthood is the happiest period.Adults can live joyfully in the following ways. Firstly, they can use the money earned in their profession to buy things which enable them to lead quality life. Further, they can have peace of mind as they start saving for future. Secondly, they are matured enough to understand what really makes them cheerful on a sustained basis with minimal effort. Due to this, they can rejoice every moment of their life as they could foresee and adjust accordingly. Thirdly, they can experience wide variety of events such as becoming a husband, father etc. Hence, they can enjoy life to the fullest possible extent. For instance, I became much happier and enjoying the role of husband after getting life partner. On the whole, adulthood provides plenty of opportunities to please ourselves.On the other hand, teenage is also pleasurable in several ways. Primarily, teenage people do not have any obligations or duties, therefore they can find free time to play the sports they like. Secondarily, the mistakes made by them are forgiven easily as they do not have maturity. Consequently, they can explore novel things which intrigue them. Nevertheless, sometimes they may get addicted to harmful habits such as smoking due to lack of mental maturity.To conclude, I opine that, adulthood is more enjoyable compared to teenage as they can experience diverse things which make life fulfilling despite the responsibilities, whilst teenagers can enjoy only a limited and specific set of things.[Answer 2]A popular topic talked about by people in all walks of life is which the most enjoyable age is. Some people say that it is school life whereas others prefer mature life. This essay will discuss both of these responses. However, in my opinion, adult age outweigh adolescent age.Regarding the young age, clearly its advantages come mainly from the low degree of responsibilities. First, people in thisfrom schools early leading to have a great amount of leisure time, unlike adults who tend to have short rest time because of work. In addition, due to their parent's support, these juveniles have only few things to be concerned about. To illustrate, when they get ill, they could stay on beds, because their parents will look after them. Therefore, they are likely to have a great number of pleasant days.On the other hand, although they are responsible for a variety of tasks, people in working age have two major benefits. Obviously, they earn money for themselves causing them to be able to afford more favorite items. A good example is expensive toys which could not be had in the past because parents though they were extravagant. They can buy it easily when they work. Similarly, adults are likely to be independent from any ones, particularly parents. Thus, they can do what they are keen on without limitations. For instance, sport lovers can come home very late in order to do exercise for long hours. This situation would be difficult to happen if they were children.To conclude, it is unfair to claim any side as a totally correct answer, because this is a subjective question. However, I missed several things in the past resulting from my parent's strictness. Hence, I prefer mature time to teenagers.。
•经济上,发展中国家的劳动力被剥削,资源被取用,而产品却不能够进人发达国家,国内产业受到外商和外企的冲击;•社会上,外国的产品流人一个国家,会改变人们的生活习惯和购买习惯;年轻人比较喜欢外同产品,比如说食品、衣服、电子产品和娱乐方式;•文化上,本土文化会被削弱,本土语言会受到威胁,文化多样性会逐步损失;•环境上,工业化生产和交通量的加大会增加温室气体的排放;游人的增多会对自然环境构成威胁。
Topic 1: Increasing travels between countries enable people to learn different cultures or to increase tension between people from different countries?外来人口的增加有利于文化的交流:•游客或者移民都具备经济利益和价值(commercial interest and economic value);而外同人的停留时间是和东道国的合作密切相关的(The length of stay depends on the cooperation of the host society.);很多当地人因此表现得非常好客和友好,这有助于文化的交流(Many local people are very friendly and hospitable, which promote the cultural communications.);•对其他的文化和人民更为了解(a better understanding of other cultures and other peoples),改变人们对其他民族和文化的态度(alter one's attitudes towards another people or culture);人们因此可以接受不同的文化和价值观(embrace different values and cultures),可以和平共处(create motivation to coexist peacefully), 并促进对"多元文化的理解(promote multi-cultural understanding);•促进文化的融合(promote integration),消除文化障碍(remove cultural barriers), 外来人口的增加导致冲突:•违反当地的习俗会激怒当地人(breach of local customs can irritate the locals);•不同文化的人看待同一事物总有不同的角度(harbour different perceptions),并给予不同的解释(different interpretations),比如对手势、衣服、言行举止有不同的理解;举止不当会引起当地人意想不到的反应(provoke unanticipated responses); •外国游客增多会对当地环境造成压力,甚至破坏环境,而移民增多可能导致工作机会减少,致使竞争更加激烈,这些都有可能引起当地人的反感(cause resentment in local communities).Globalization is a catch-all term that refers to any activity that involves more than one country, for example, travel from one country to another. The dramatic increase in transnational travel in recent years has sparked controversy over the potential impacts of this trend on individual countries especially those new member states of globalization. Some people are concerned that the upsurge in new arrivals will prompt local hostility against visitors instead of promoting their understanding on mutual cultural background. This notion should be rejected as one can see many facts in favour of this development between countries.The first reason why international travels would never bring conflict is rooted in the fact that both visitors and locals are economically motivated. International travel opens up opportunities for business development throughout the world. Entrepreneurs are interested not only in the domestic market but also in the oversea market. Foreigners should learn the culture of a country before winning over the local people. In turn, locals should show their hospitality to visitors in exchange for their trust. They share a view that acceptance of each other's cultural background is a necessary condition for cooperation.Understanding a culture has other implications. Differences in social background, cultural values and religious belief might make the discrepancy of foreigners and local inhabitants on some issues indelible; however, the higher interaction, the higher level of communication and understanding. Arabians, for example, used toconsider westerners as their foes. Now they have concrete relations with their western allies in many fields. In the initial stage, their divergence seemed inherent but over time, with better mutual understanding, they take the same position on many issues.Undeniably, it is likely that in some resorts, foreign visitors repel the local community with their scant regard for the local environment and conventions when they first arrive. However, it should be noted that most offense is accidental, rather than intentional. Instead, visitors disobey rules and conventions simply because they have no knowledge of them. This situation is expected to be improved with the passing of time when visitors from different countries increase their knowledge of a local culture.According to the above analysis, we can observe that the increase in the international travel should not be taken as the cause of any conflict that arises between two countries. Alternatively, one should recognize its role in improving mutual understanding between two countries.1. catch-all = all-embracing:包罗甚广的;包括一切的2. hostility=enmity=resentment:敌意,怨'恨,愤恨3. rooted in=derived from=based on:基于4. entrepreneur=tycoon=mogul=industrialist:企业家,实业家5. discrepancy=disagreement=difference=divergence:分歧,矛盾6. foe=enemy=rival:敌人,竟争对手7. concrete=tangible=solid:具体的,实际的8. overtime=in due course=sooner or later:最终,早9. resort:胜地;tourist resort:旅游胜地;holiday resort:度假胜地;beach resort:海边度假胜地;scenic spot:景观;place of interest: 旅游景点10. repel=revolt=repulse:使厌恶,憎恶11. scant=limited=scarce:缺乏的,不足的Topic2: When international media (including movies, fashion shows, advertisements and other TV programs) convey the same messages to the global audience, people argue that the expansion of international media has negative impacts on cultural diversity. What is your opinion?媒体信息一致的缺点:• 国际媒体(global media)—般掌握在少数几个有实力的机构手中(in the hands of a few, large, powerful organizations);有了媒体的宣传(propaganda)后,西方文化成了主流(domineering force),大规模的、有吸引力的广告(mass seductive advertising )唤起了落后地区人们对物质新的向往(create fresh desires),经济联系增强(strong economic ties),西方产品取代了本地产品,使人们更加向往西方的文化;• 文化开始融合在一起(mingle),人们被新的价值观所围绕(bombarded with new values),对自己的文化失去信心和自豪感(confidence and pride),拒绝接受自己的文化传统(rejection of their cultural heritage)转而接受西方的文化习惯(adoption of Western cultural practices);西方媒体削弱了民族的特征(ethnic identity)和社会的凝聚力(social cohesion);因为担心失去观众(a loss of viewers),当地的电视台也开始播放西方的电视节目(television shows),• 国际媒体的普遍会降低世界文化的品质和多样性(degrade the quality and diversity of world culture);文化被商业化(commercialized), —些文化产品(cultural goods),如音乐、服装,都变成了商品(commodities in the marketplace)。
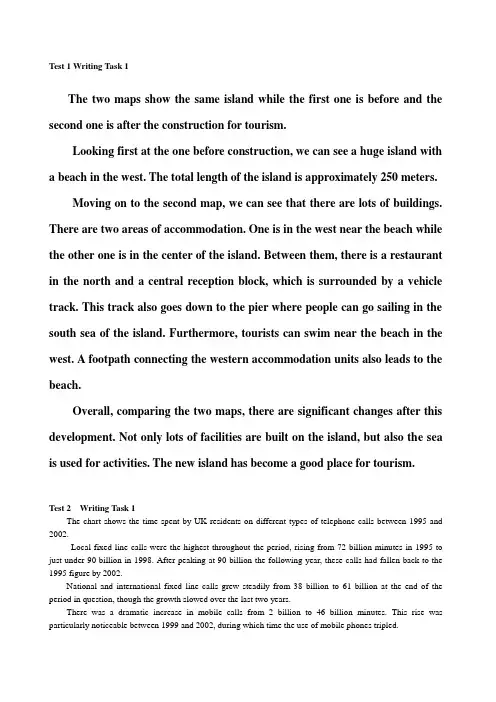
Test 1 Writing Task 1The two maps show the same island while the first one is before and the second one is after the construction for tourism.Looking first at the one before construction, we can see a huge island with a beach in the west. The total length of the island is approximately 250 meters.Moving on to the second map, we can see that there are lots of buildings. There are two areas of accommodation. One is in the west near the beach while the other one is in the center of the island. Between them, there is a restaurant in the north and a central reception block, which is surrounded by a vehicle track. This track also goes down to the pier where people can go sailing in the south sea of the island. Furthermore, tourists can swim near the beach in the west. A footpath connecting the western accommodation units also leads to the beach.Overall, comparing the two maps, there are significant changes after this development. Not only lots of facilities are built on the island, but also the sea is used for activities. The new island has become a good place for tourism.Test 2 Writing Task 1The chart shows the time spent by UK residents on different types of telephone calls between 1995 and 2002.Local fixed line calls were the highest throughout the period, rising from 72 billion minutes in 1995 to just under 90 billion in 1998. After peaking at 90 billion the following year, these calls had fallen back to the 1995 figure by 2002.National and international fixed line calls grew steadily from 38 billion to 61 billion at the end of the period in question, though the growth slowed over the last two years.There was a dramatic increase in mobile calls from 2 billion to 46 billion minutes. This rise was particularly noticeable between 1999 and 2002, during which time the use of mobile phones tripled.To sum up, although local fixed line calls were still the most popular in 2002, the gap between the three categories had narrowed considerably over the second half of the period in question.Test 3 Writing Task 1The diagrams show statistic information regarding the ages of the habitats of Yemen and Italy in 2000 and also an estimative for 2050.We can see that in 2000 the majority of people in Yemen was between 0 and 14 years old, with 50.1%, whereas in Italy most of the population was between 15 and 59 years old(61.1%, in the same year. On the other hand, just 3.6% of the people in the former country was 60 years old or more in 2000, while in the latter country this figure is represented with 24.1%.The projections for 2050 show that the number of people with 15-59 years and 60 years or more will increase in Yemen, reaching 57.3% and 5.7% respectively. In contrast, in Italy the population with 15-59 years will decrease to 46.2%, while people with 60 years or more will grow to 42.3%.Overall, it is possible to see that there is an upward tread on the rates people with 60 years or more in both countries.Test 4 Writing Task 1The graph shows energy consumption in the US from 1980 to 2012, and projected consumption in 2030.Petrol and oil are the dominant fuel sources throughout this period, with 35 quadrillion units used in 1980, rising to 42q in 2012. Despite some initial fluctuation, from 1995 there was a steady increase. This is expected to continue, reaching 47q in 2030.Consumption of energy derived from natural gas and coal is similar over the period. From 20q and 15q respectively in 1980, gas showed an initial fall and coal a gradual increase, with the two fuels equal between 1985 and 1990. Consumption has fluctuated since 1990, but both now provide 24q. Coal is predicted to increase steadily to 31q in 2030, whereas after 2014, gas will remain stable at 25q.In 1980, energy from nuclear, hydro-and solar/wind power was equal at only 4q. Nuclear has risen by 3q, and solar/wind by 2. After slight increase, hydro power has fallen back to the 1980 figure. It is expected to maintain this level until 2030, while the others should rise slightly after 2025.Overall, the US will continue to rely on fossil fuels, with sustainable and nuclear energy sources remaining relatively insignificant.Test 1 Task 2Some experts believe it is better f or children to begin learning a foreign language at primary school rather than secondary school. Do the advantages of this outweigh the disadvantages?Traditionally, children to study foreign languages at secondary school, but introducing them earlier is recommended by some educationalists. This policy has been adopted some educational authorities or individual schools with both positive and negative outcomes.The obvious argument in its favor is that young children pick up languages much more easily than teenagers. Their brains are still programmed to acquire their mother tongue, which facilities learning another language, and unlike adolescents, they are not inhibited by self-consciousness.The greater flexibility of the primary timetable allows for more frequent, shorter sessions and for a play-centered approach, thus maintaining learners’ enthusiasm and progress. Their command of the language in later life will benefit from this early exposure, while learning other languages subsequently will be easier for them. They may also gain a better understanding of other cultures.There are, however, some disadvantages. Primary school teachers are generalists, and may not have thenecessary language skills themselves. If specialists have to be brought in to deliver these sessions, the flexibility referred to above is diminished. If primary language teaching is not standardized, secondary schools could be faced with a great variety of levels in different languages within their intake, resulting in a classroom experience which undoes the earlier gains. There is no advantage if enthusiastic primary pupils become demotivated as soon as they change schools. However, these issues can be addressed strategically within the policy adopted.Anything which encourages language learning benefits society culturally and economically, and early exposure to language learning contributes to this. Young children’s innate abilities should be harnessed to make these benefits more achievable.Test 2 Task 2Some people believe that unpaid community service should be a compulsory part of high school program ( for example workingfor a charity, improving the neigbiurhood or teaching sports to younger children). To what extent do you agree ordisagree?It has been suggested that high school students should be involved in unpaid community service as a compulsory part of high school programs. Most of the colleges are already providing opportunities to gain work experience, however there are not compulsory. In my opinion, sending students to work in community service is a good idea as it can provide them with many lots of valuable skills.Life skills are very important and by doing voluntary work, students can learn how to communicate with others and work in a team but also how to manage their time and improve their organizational skills. Nowadays, unfortunately, teenagers do not have many after-school activities. After-school clubs are no longer that popular and students mostly go and sit in front of the TV, browse internet or play video games.By giving them compulsory work activities with charitable or community organizations, they will be encouraged to do something more creative. Skills gained through compulsory work will not only be an asset on their CV but also increase their employability. Students will also gain more respect towards work and money as they will realize that it is not that easy to earn them and hopefully will learn to spend them in a more practical way.Healthy life balance and exercise are strongly promoted by the NHS, and therefore any kind of spare time charity work will prevent from sitting and doing nothing. It could also possibly reduce the crime level in high school age group. If students have activities to do, they will not be bored and come up with silly ideas which can be dangerous for them or their surroundings.In conclusion, I think this is a very good idea,a and I hope this program will be put into action for high schools/colleges shortly.Test 3 Task 2Some people say taht the best way to improve public health is by increasing the number of sports facilities. Others, however, say this would have little effect onpublic health and other measures arereqired.Discuss both these views and give your opinion.A problem of modern society is the declining level of health in the general population, with conflicting views on how to tackle this worrying tread. One possible solution is to provide more sports facilities to encourage a more active lifestyle.Advocates of this believe that today’s sedentary lifestyle and stressful working conditions mean that physical activity is no longer part of either our work or our leisure time. If there were easy-to reach local sports centers, we would be more likely to make exercise a regular part of our lives, rather than just collapsing in front of a screen every evening. The variety of sports that could be offered would cater for all ages, levels of fitness and interests: those with painful memories of PE at school might be happier in the swimming pool than on thefootball pitch.However, there may be better ways of tackling this problem. Interest in sport is not universal, and additional facilities might simply attract the already fit, not those who most need them. Physical activity could be encouraged relatively cheaply, for example, by installing exercise equipment in parks, as my local council has done. This has the added benefit that parents and children often use them together just for fun, which develops a positive attitude to exercise at an early age.As well as physical activity, high tax penalties could be imposed on high-fat food products, tobacco and alcohol, a excessive consumption of any of these contributes to poor health. Even improving public transport would help: it takes longer to walk to the bus stop than to the car.In my opinion, focusing on sports facilities is too narrow an approach and would not have desired results. People should be encouraged not only to be more physically active but also to adopt a healthier lifestyle in general.。
雅思作文simon9分范文合集英文回答:Task 1:Bar Graph.The bar graph illustrates the percentage of people who use different modes of transportation to commute to work in a particular city.The most popular mode of transportation is public transportation, which accounts for 45% of commuters.The second most popular mode is driving alone, with 30% of commuters.Walking or cycling is the third most popular mode,with 15% of commuters.The least popular mode is carpooling or ridesharing, with only 10% of commuters.Task 2:Discuss the benefits and drawbacks of social media for young people.Benefits:Social media provides young people with a platform to connect with friends and family, which can be especially beneficial for those who live far apart.It allows them to share their experiences, ideas, and opinions with others.Social media can also be used as a tool for education and learning.Drawbacks:Social media can be addictive, and young people may spend excessive amounts of time on these platforms.It can lead to cyberbullying and other forms of online harassment.Social media can also create unrealistic expectations and promote a culture of comparison.Overall Conclusion:Whether the benefits of social media outweigh the drawbacks is a matter of debate. However, it is important for young people to be aware of both the positive and negative aspects of social media so that they can use it in a healthy and responsible way.中文回答:任务 1:条形图。
雅思作文9分范文9分考官级雅思大作文范文之幸福如何定义It is no doubt true that the majority of people would like to be happy in their lives. While the personalnature of happiness makes it difficult to describe, there do seem to be some common needs that we all share with regard to experiencing or achieving happiness.Happiness is difficult to define because it means something different to each individual person. Nobody can fully understand or experience another person's feelings, and we all have our own particular passions from which we take pleasure. Some people, for example, derive a sense of satisfaction from earning money or achieving success, whereas for others, health and family are much more important. At the same time, a range of other feelings, from excitement to peacefulness, may be associated with the idea of happiness, and the same person may therefore feel happy in a variety of different ways.Although it seems almost impossible to give a precise definition of happiness, most people would agree that there are some basic preconditions to achieving it. Firstly, it is hard for a person to be happy if he or she does not have a safe place to live and enough food to eat. Our basic survival needs must surely be met before we can lead a pleasant life.Secondly, the greatest joy in life is usually found in shared experiences with family and friends, and it is rare to find a person who is content to live in completeisolation. Other key factors could be individual freedom and a sense of purpose in life.In conclusion, happiness is difficult to define because it is particular to each individual, but I believe that our basic needs for shelter, food and company need to be fulfilled before we can experience it.(292 words, band 9)。

雅思写作9分(1)份雅思写作9分 1范文:It is true that foreign films are more popular in many countries than domestically produced films. There could be several reasons why this is the case, and I believe that governments should promote local film-making by subsidising the industry.There are various reasons why many people find foreign films more enjoyable than the films produced in their own countries. Firstly, the established film industries in certain countries have huge budgets for action, special effects and to shoot scenes in spectacular locations. Hollywood blockbusters like ‘Avatar’ or the James Bond films are examples of such productions and the global appeal that they have. Another reason why these big-budget films are so successful is that they often star the most famous actors and actresses, and they are made by the most plished producers and directors. The poor quality, low-budget filmmaking in many countries suffers in parison.In my view, governments should support local film industries financially. In every country, there may be talented __ film-makers who just need to be given the opportunity to prove themselves. To pete with big-budget productions from overseas, these people need money to pay for film crews, actors and a host of other costs related to producing high-quality films. If governments did help with these costs, they would see an increase in employment in the film industry, e from film sales, and perhaps even a rise in tourist numbers. New Zealand, for example, has seen an increase in tourism related to the 'Lord of the Rings' films, which were partly funded by government subsidies.In conclusion, I believe that increased financial support could help to raise the quality of locally made films and allow them to pete with the foreign productions that currently dominate the market.(295 words, band 9)。
雅思写作9分范文分享雅思写作9分范文分享,详细包括了考题类型以及范文内容。
雅思写作想要获得高分的话技巧和素材的积累一定不可以少,希望今天的内容可以给大家带来一定的帮助。
雅思写作考题类型雅思大写作Task1备考题型一级准备:分析某事物(开展、现象、趋势)的优缺点/利弊/积极消极影响;分析某问题并提供解决方法二级准备:对两个对立观点进行讨论,并给出你的观点备考题型分析首先建议同学们需要关注的是“分析某事物(开展、现象、趋势)的优缺点/利弊/积极消极影响〞这个题型。
这个题型在雅思写作考试中,题目中常以“positive or negative〞或者“advantage or disadvantage〞,有时还会以“the advantages/disadvantages outweigh the disadvantages/advantages〞这样的字眼出现。
其次,同学们需要关注的是“分析某问题并提供解决方法〞这类题型在雅思写作考试中,最常出现的字眼是“What are the causes for……Can you offer some solutions to deal with……?〞或者“What the main reasons for……What can countries do to……?〞备考场景一级准备:政府和国家;教育二级准备:科技三级准备:弱势群体雅思写作9分范文分享:题目:Some people believe that studying at university or college is the best route to a successful career, while others believe that it is better to get a job straight after school. Discuss both views and give your opinion.范文:When they finish school, teenagers face the dilemma of whether to get a job or continue their education. While there are some benefits to getting a job straight after school, I would argue that it is better to go to college or university.The option to start work straight after school is attractive for several reasons. Many young people want to start earning money as soon as possible. In this way, they can become independent, and they will be able to afford their own house or start a family. In terms of their career, young people who decide to find work, rather than continue their studies, may progress more quickly. They will have the chance to gain real experience and learn practical skills related to their chosen profession. This may lead to promotions and a successful career.On the other hand, I believe that it is more beneficial for students to continue their studies. Firstly, academic qualifications are required in many professions. For example, it is impossible to become a doctor, teacher or lawyer without having the relevant degree. As a result, university graduates have access to more and better job opportunities, and they tend to earn higher salaries than those with fewer qualifications. Secondly, the job market is becoming increasingly competitive, and sometimes there are hundreds of applicants for one position in a company. Young people who do not have qualifications from a university or college will not be able to compete.For the reasons mentioned above, it seems to me that students are more likely to be successful in their careers if they continue their studies beyond school level.(271 words, band 9)雅思写作一定要选择适宜的语法结构这样子才可以使文章表达的更为精确和简练,雅思写作9分范文分享就到这里,更多雅思写作资讯请继续关注。
最新雅思Task1写作范文最新雅思Task1写作范文,地图题之村庄变迁,今天就给大家带来了最新雅思Task1写作范文,希望能够帮助到大家,下面就和大家分享,来欣赏一下吧。
最新雅思Task1写作范文地图题之村庄变迁The map shows the village of Chorleywood showing development between 1868 and 1994该地图展示村庄Chorleywood 在1868到1994年间的发展。
请作答。
雅思图表小作文地图型9分范文:The map shows the growth of a village called Chorleywood between 1868 and 1994.It is clear that the village grew as the transport infrastructure was improved. Four periods of development are shown on the map, and each of the populated areas is near to the main roads, the railway or the motorway.From 1868 to 1883, Chorleywood covered a small area next to one of the main roads. Chorleywood Park and Golf Course is nowlocated next to this original village area. The village grew along the main road to the south between 1883 and 1922, and in 1909 a railway line was built crossing this area from west to east. Chorleywood station is in this part of the village.The expansion of Chorleywood continued to the east and west alongside the railway line until 1970. At that time, a motorway was built to the east of the village, and from 1970 to 1994, further development of the village took place around motorway intersections with the railway and one of the main roads.(174) 附雅思小作文考官范文基本套路段一:话题重述段二:概括话题数据的主要特征或规律段三:详述特征规律一段四:详述特征规律二注意:simon考官主张雅思小作文无须总结!大家可留心这一点。
雅思写作9分范文Title: Effects of Social Media on SocietyIntroductionIn the past decade, the rise of social media platforms, such as Facebook, Twitter, and Instagram, has revolutionized the way people communicate and interact. While social media has undoubtedly brought numerous benefits, it has also triggered significant changes in society. This essay will explore the effects of social media, both positive and negative, on various aspects of human life and society.Body1. Communication and ConnectivityOne of the most obvious benefits of social media is its ability to connect people from different parts of the world. Social media platforms allow individuals to communicate instantaneously and easily share thoughts, ideas, and information. Friends and family members living in different countries can now stay connected, which facilitates greater social cohesion. It also leads to the formation of global communities where people with common interests can connect and collaborate. Furthermore, social media platforms provide a platform for marginalized groups to voice their opinions and find support.2. Information Sharing and AwarenessSocial media platforms have become key sources of news and information for many people. Traditional media outlets are no longer the sole gatekeepers of information. Social media allows individuals to share news, articles, and opinions, thereby expanding the diversity of information available. Moreover, social media has proven to be a powerful tool for raising awareness about important social and humanitarian issues. Movements like#BlackLivesMatter and #MeToo gained momentum on social media, shedding light on systemic injustices and mobilizing global support.3. Business and Career OpportunitiesBusinesses have recognized the potential of social media as a marketing tool. Social media platforms provide a cost-effective way of reaching millions of potential customers. Companies can now directly engage with their target audience, gather customer feedback, and build brand recognition. Additionally, social media has opened up new career opportunities in fields like social media management, content creation, and influencer marketing. Professionals can showcase their skills and expertise, connect with industry peers, and find job opportunities through networking on social media.4. Mental Health and Well-beingThough social media has its advantages, it also poses certain risks to mental health. The constant exposure to carefully curated images, posts, and updates on social media can lead to feelings of inadequacy and low self-esteem. Comparison with peers andunrealistic beauty standards portrayed on social media platforms can contribute to anxiety and depression. Furthermore, excessive use of social media has been linked to sleep disturbances, as individuals may spend late hours scrolling through their feeds. It is important to strike a balance and engage in healthy social media habits to protect mental well-being.5. Privacy and Security ConcernsThe widespread use of social media has raised serious concerns regarding privacy and security. Personal data shared on social media platforms is susceptible to exploitation by third parties for targeted advertising or even identity theft. Moreover, the ease with which false information can be spread on social media makes individuals vulnerable to spreading misinformation and fake news. Social media companies have a responsibility to ensure the security and privacy of user data and to combat the dissemination of false information.ConclusionSocial media has undoubtedly changed the way we live, communicate, and interact. Its positive impacts on communication, connectivity, access to information, and business opportunities cannot be denied. However, it is crucial to address the negative effects, such as mental health concerns and privacy issues. Society must navigate social media's benefits and limitations to ensure a healthy and balanced use of these powerful platforms. It is essential for individuals, as well as social media companies, to takeresponsibility for their actions and actively work towards harnessing the potential of social media for the greater good.。
雅思写作task1范文Task 1 of the IELTS writing exam requires candidates to describe and interpret visual data, such as charts, graphs, tables, and diagrams. This task assesses the test-taker's ability to report and compare data, describe the stages of a process, or explain how something works. In this article, we will provide a sample response for a task 1 question and analyze the key features of a high-scoring answer.The given bar chart presents the percentage of household expenditure on five different categories in a European country in 2016. The categories include housing, food and drink, transport, leisure and education, and finally, other goods and services. It is evident that housing accounted for the largest proportion of household spending, while leisure and education had the lowest share.To begin with, housing was the most significant expenditure for households, comprising approximately 35% of the total budget. This was followed by food and drink, which represented around 20% of the expenditure. Transport and leisure and education accounted for similar proportions, at approximately 15% and 10% respectively. Finally, other goods and services made up the smallest share, at just under 10%.In terms of the key features of a high-scoring response, it is essential to accurately describe the data presented in the visual, as well as make comparisons where relevant. This sample response provides a clear and concise overview of the main trends in the data, including the highest and lowest expenditure categories, as well as the similarities and differences between the other categories. Additionally, the response uses a range of appropriate vocabulary to describe the data, such as "comprising," "represented," and "proportions."Furthermore, the response is well-organized and logically structured, with a clear introduction, body paragraphs, and conclusion. The information is presented in a coherent and cohesive manner, with each paragraph building on the previous one and leading to a logical conclusion. This demonstrates the test-taker's ability to effectively organize and present information in a written format.In conclusion, the sample response provided effectively describes and interprets the visual data presented in the bar chart. It accurately reports the main trends and features of the data, uses a range of appropriate vocabulary, and is well-organized and logically structured. These key features are essential for achieving a high score in task 1 of the IELTS writing exam.。
雅思考试写作范文1there has long been controversy over the legality and apparent acceptance of tobacco in society .some hold that cigarettes and other tobacco containing products should be banned, that is, treated as agree with this point of view for the following reasons:although cigarettes do not offer as intense an effect as drugs like heroin and cocaine,they rank higher in the level of dependence it creates in the of smokers try to rid themselves of cigarettes but cannot,because of the physiological dependence they developed,chiefly imputable to its chemical explains why smokers continue their habit despite the numerous health warnings. furthermore,medical science has now proved beyond a doubt that smoking all the other causes of preventable deaths such as alcohol,illegal drugs,aids,suicide,road accidents,fire,and guns,cigarettes still account for more preventable deaths than all of those combined.more disturbingly,whilst the use of heroin is dangerous solely to the users,the use of tobacco endangers those who are in their vicinity as well. this phenomenon, known as passive smoking, nulls the counter-argument that putting one's own health at risk through smoking should be up to one's own individual have shown that the amount of second-hand smoke inhaled by a typical nonsmoker is equivalent to one cigarette smoked per day,and what is more,passive smoking can increase a nonsmoker's chance of getting cancer by ten to thirty two per cent.there are those who will say that the black market created by outlawing tobacco will produce deadlier cigarettes because the product standards of the bootleggers are not as should all bear in mind that legal cigarettes cause roughly four hundred thousand deaths a is hard to imagine the limited distribution provided by the criminal underworld could compete with this tragic figure.to sum up, the harm visited upon our society by tobacco usage is will be no solution other than to control tobacco much in the same way that the government now controls drugs which could allow people to remain attentive to the seriousness of the effects of these substances,and hopefully to prohibit their usage.雅思考试写作范文2Nowadays, the gap between the city and the countryside becomes more and more overt, which arouses colossal concerns. To understand t he solution, let’s take a closer look at the causes of the gap at first.The main reason of the gap is the unequal investment between city and rural area. China is a typical example. While more and more money is being invested to the coastal areas and big cities, such as Beijing and Shanghai, the lack of investment barriers greatly the society development of rural area and western regionsThe low education level partly sharps the gap. There is no doubt that the prime force of productivity is education. However, because of poverty, thousands of people go to work without graduating from primary school. The poorer, the few children go to school. This bad cycle finally leads to the dream of rich becoming a dream that is hard to realize.Moreover, the rural area is short of people with high quality. A survey proved that most of university students, whether they come from city or countryside, choose big cities instead of poor areas to work. The rural area can neither adept talent man nor attract talent man. No wonder the gap is increasing largely.Hence, The government ought to knock itself out to decrease the gap as soon as possible. First, balance the investment between city and rural area. In addition, the education level should be improved, especially pay attention on raising high quality people. Besides, let more people realize the latent capacity of rural area in order to attract talent and investment. The set up of CCTV channel12-western region channel is a good example.Only when the ways mentioned above are realized step by step, can the gap between the cities and the countryside be bridged.雅思考试写作范文3the birth of cars have made an enormous change to our the past,we travel from one place to another only by foot,nowaday,cars can do it .its goes withour saying that the invention of cars bring great benefit to all of as proverb goes:no garden without is not exception.owing a car has a lot of one thing,car provide us the most convient way of can get around freely without spenting a lot of always found driving is so another,its the comfortable to drive a always can stay warm and dry even in rainy whether,in addition,drivers are usually safe in their cars when they are out at night.Cars bring the human merits,their side-effects graudually come to the run a car need a lot of oil,which is getting less and increasing number of cars contribute the lacking of more and more cars are used,the traffic ecpecially in big cities is getting heaver and heavier,which lead to the serious social problem--traffic addition,the inceasing numbers of cars ,which excaust sent a huge quantities of carbon monoxide into make the air of cities unbreathabe,it strip people contact with frensh air.therefore,the new energy should be explored to replace the oil so that our envionmental pollution can be avioded .and the strick law should be issued to keep the numbers of cars under heavier traffic can be solluted!雅思考试写作范文4Private cars vs Public trafficAs traffic problems become more and more serious in many cities of developed and developing countries, their governments have to try hard and loads of money and energy have been spent to deal with them.Firstly, it is not efficient for the commuters to use their private cars to and back from their workplaces. Occasionally we can see they have to sit on the wheels wasting time and fuel in a heavy traffic jam. At the same time, through burning the fossil fuels, green house gas CO2, CO1, acid rain gas SO2, fumes and dusts are being released into the atmosphere, all of which heavily overload the environment. Thirdly, with the increase of private cars, the road trafficaccidents are also rise dramatically. For example, in a city with 5000 cars, there will be at least 250 accidents happening everyday, which also burden the public healthy services.On the contrary, expected public traffic may be an ideal solution to these problems. For example city buses and railways are widely used or being constructed by many cities. People can take buses easily, which can be found every 10 minutes or less in the peak time. Actually, Nottingham Transport Company is building its own light railway in the city, which is announced by the speak man of the company, “It will be completed in the next year, the tickets will be very competitive and at the same time the travel will be very safe and comfortable.”On the other hand, public traffic had its own disadvantages. Usually it cannot provide door-to-door service. It is inconvenient to go shopping by public vehicles. Sometimes you must wait a long time for the train. And quite a lot of people prefer to enjoy driving.In conclusion, developing the public traffic is a useful approach to deal with these difficulties. One possible way, if not the best, is to taxi private cars heavily and use these revenues to provide citizens cheaper public traffic services.雅思考试写作范文5Nowhere in the world has the issue of tobacco been so much debated as inour society. Nowadays, tobacco is more harmful than drug to people’shealth, therefore many people think that smoking is legal that is a direct andprimary reason to induce this kind of problem. The above point is certainlytrue; this essay will outline three reasons.The main reason is that tobacco is a silent killer to smokers. Tobacco isknown to be the probable cause of some 25 different diseases, and for some,such as lung cancer, bronchitis and emphysema, it is the main cause.According to a WHO report four million people die yearly from tobacco-related diseases, that is one death every eight seconds. Tobacco is significantlybecoming a greater cause of death and disability than any other single cause.Another reason is that more and more young people are under 18 years old who smoke cigarette have been blinded by the deceit of tobacconists. Tobacco among adolescents remains stubbornly persistent. Smoking among adolescents rose in the 1990s in several developed countries, such as China,Vietnam and Thailand . While new markets are being opened by the tobacco industry actions, old markets have not been closed. Tobacco is a global threat.Last but not the least reason is the increase in cigarette smuggling. Becauseof tobacco smuggling, the legal retailing and distribution systems are badlyaffected, and faced with increased lawlessness and heavy tax losses. This behavior severely affects the economy.In conclusion, the tobacco should be considered illegal. Perhaps a pack ofcigarettes is less harmful than another drug, but tobacco is actually thebiggest killer of all the drugs.雅思考试写作范文6travelling to a different culture can be an overwhelming,indeed,even an intimidating is very easy for misunderstandings to occur,and tourists are often deterred from places of cultural interest through fear of offending the indigenous would argue,it is up to the locals to accomodate visitors by speaking their language,serving their cuisine,and generally making them 'at home'.without doing this,local perple can be considered as unfriendly and viewed with suspicion by they are dissuaded from staying,which is ultimately detrimental to the local community,as the tourists take their spending-money with them.the counterview argues that acting naturally does not necessarily equate with being a local person wishes to live their life as his or her ancestors have done for centuries then visitors should show respect and allow them to do fact,many would argue that immersing one's self in a different culture is vital in order to truly appreciate is gained bytravelling,potentially,thousands of miles to experience the same language,food and culture that could have been found a few miles down the road from one's is a waste ofmoney,nothing is learned from the experience,and the memories saved will be less vivid. this is the point of view i it is vital for many countries' economies to welcome tourists,it does not have to imitate them so as to encourage their travellers have the right mind-set and show respect,all they need to do is to let the locals carry out their day-to-day lives to gain many insights into the this way,visitor and host can mutually benefit each other,through an increased income,and an enriching experience,respectively.雅思考试写作范文7Recent years, because traffic is convenient day-by-day, people have a more chance to travel around the world. The plane can make us reach any corner of the earth in a short time. Some people think visitors to others countries should imitated local custom and behaviors. Some people disagree; they think the host country should welcome culture different.As the a famous saying goes: Do as they do at Rome. The knowledge of local custom can help outside person adapt to the new environment rapidly. Moreover, each place has the own unique culture, may keep in touch more ideology and culture through the local folkways and customs. For instance, a Chinese people came to Britain, he can imitate British life style. Inthis way, He can understand British habit more thoroughly, thus, make himself live a more comfortable life in Britain.On the other hand, the outside thought has a lot of positive influence on local culture too. For example, the outside thought could bring the new theory and inject vigor into local culture. The exchanges of outside thought and traditional culture can help people to find out about the culture of other areas and countries.Making a general survey of human history, it is a positive trend that the nationality has been merging all the time. So, we should not only propagate local culture for the outside people but also study outside culture and custom. In this way, the earth would become a family, all the people would get along harmoniously.雅思考试写作范文8nowaday,the culture shock exists between the tourists and host people consider should try to model themselves on the local culture and totally agree with the above point.firstlly,by abserving and understanding of local culture,the tourists can reduce the chance of offending the locals and misunderstanding consiously and manchu area of china,people think the dog is their you come there,you must always show respects and love to dog,otherwise it will lead to the embarrassment and conflict.secondly,understanding and following the activites of local people can show our respects to doing things with their way,we will be easy to establish the good relationship with local residents often feel friendly when their culture are imitated and are unconsiously bring us into the members of them.in addition,imitating can let us gain insigts into other not only can know whats people's life is like in other counties,we also can be enlarged our knowledge and broaded our horizon,which will be cherish wealth in our life.to sum should adjust themselves adapt to the local habits and customs,which will make them fully enjoy their travel and live in harmony!雅思考试写作范文9Along with the mass use of computer technology in education circles, we are delighted to witness the uncountable conveniences be brought by computer. Some people even argue that teacher will not be important in classroom any more. Is this reasonable? Personal speaking, I oppose holding such a ridiculous conclusion.In the first place, the feature of teaching defines teachers as an essential part in education. It is well known that teaching is a process of mutual-communication: firstly, teachersimpart/initiate knowledge or ideas to students, then students should promptly transfer their feedback to teachers, moreover, teachers will give students the final interpretation according to their specific requirement. Besides, teachers also can (teach students in accordance of their aptitude). In contrast, what computers can do is merely to display materials which havealready stored in their EMS memory or mechanically execute operator’s commands. We actually can not image what our education will being if computers substitute teachers totally. As to another reason, it seems that teacher’s role as a supervis or is more and more overt. Computer is indeed a controversy, it not only can be an efficient education assistant, but also can become an addiction which includes too much violent and (pornographic propaganda). Youngsters do not mature fully in psychology, therefore, without teachers' supervision, many children would spend hours playing computer games or surfing unhealthy websites, which are regarded as a waste of valuable time and intelligence, instead of trying to have a good command of knowledge and skills.We never deny that computers are absolutely an available education implements, furthermore, the combination of teacher and computer technology will greatly improve our education quality. However, from all of the grounds of argument mentioned above, we can safely draw a conclusion that teacher will not be replaced by computer in the classroom. 雅思考试写作范文10Which element between nature and nurture plays the major role in children’s personality and development is always a controversial problem. Of course, which you prefer depends on your own experience, life style and emotional concern. Here, I would like to illustrate my point of view about it.Admittedly, different nature determines people have distinguished starting points in their lifetime. To beginning, i n light of medical research, a person’s blood type has considerable influence to his character. General speaking, for example, a person whose blood type is A means that his personality is amiable and tender probably. Besides, the physical condition, even a ppearance may influence a person’s development. Statistics shows that beautiful people are more confident than others, because they do not need to worry about the prejudice from public. Obviously, some parts of our personality have been decided when we born.On the other hand, although nature is important during the course of shaping personality, we cannot ignore another essential element, nurture. There are many factors which affect the development of children, both parental support and education being vital influence. It is reported that the kid whose parents are divorced is more likely has psychological troubles than those with a harmonious family. By contrast, as we all know, good education will positively cultivate a person’s personality and improve his self-restraint in a big way.In summary, from what has been discussed above, we may safely arrive at the conclusion that partly because of different nature, partly because of different nurture, people have their unique personality.雅思考试写作范文11The computer is widely used in education and some people think teachers are not playing an important role in the classroom. To what extend do you agree or disagree?With more and more extensive use of computers in education, some people claim that the importance attached to teachers has been jeopardized. Therefore, computers will replaceteachers in the classroom. However, it seems quite clear to me that learning from teachers is the most important way that cannot be substituted for students.Naturally, some people maintain that computer should instead of the old way of education. They hold that the strong function of the computer offers a new mode of education, which is more interesting, more vivid and more acceptable by children. The students will not face to the serious teachers and calm classes any more, which are replaced by a brand-new world offered by the Internet. In addition, this can decrease the investment on the foundational education and save the human resources and material resources.As an assistant, computers do help teachers with their work, but they can never replace the important role of a real teacher. The main functions of any computer are storage and calculation. It cannot think on its own anyway. All the teaching data stored in computers are the essence of teaching experience generalized by many teachers during their work. Hence, to assist education, what a computer can do is just to repeat the contents summarized by real teachers.In addition, each student has different talents and different defects, and accordingly, they may come across various problems during their study. Computer programmer designing the software, however, cannot predict these problems. Therefore, a single computer can never solve these problems without a teacher’s guidanceFurthermore, if the significance of teacher has been weakened, the number of teachers may be decreased, that is to say, many teachers may be laid-off. If such a case comes to reality, series of social problems will break out, such as the drop of working opportunity which will surely make the burden of whole society become heavier and heavier.In conclusion, although computer-aided-education has spread widely, teachers still play s crucial part in the classroom, which cannot and will not be replaced by computer.雅思考试写作范文12In this IT age, computers are widely used in the classroom in order to enrich the methods of teaching. This phenomenon gives some the illusion that the thing teaching students is no longer the teacher but a computer. Personally, I disagree with this opinion.As another machines, computer doesn’t enable to control itself. Though computers are capable of learning from their mistakes and improving on their performance, they need details instructions from human being in order to be able to operate. They can never, as it were lead independent lives, no mention teaching students. In case a computer lacks the control of a teacher, there is no difference between a computer and waste.Not only this, but computers, unlike a teacher, can’t solve a variety of new problems. Everything is developing in today’s society, including education. For example, a student suddenly asks a creative question that the computer isn’t programmed for, it can do nothing, while teacher can explain clearly though abundant teaching experience.Last but not least, the computer can’t communicate with students from emotion. Such as an eyesight or gesture of teacher can transfer his or her idea and feeling to students. In this way,students can feel more human touch in the class. In comparison, the computer is too dry and dusty to understand.All in all, no matter how nice a computer is, it can’t take the place of teacher. Of course, I don’t mean that computer is useless. In contrary, I believe it will become the most powerful assistants to teacher in further.雅思考试写作范文13Computer, the most exciting and significant invention in 20 century, will reshape our lives and our world. As a result, some people proclaim that computers should be involved into our classroom, and replace the roles of human teachers. However, I cannot agree with their point of view.Admittedly, as the useful tools, computers can become the optimum assistants for human teachers in the classroom. To beginning, vivid pictures shown on screen can motivate students’ interest and curiosity dramatically. Moreover, the combination of computers and Internet can provide children the abundant information. Although computers enjoy considerable merits, they cannot compare with human teachers for two main reasons. Among countless factors which influence my inclination, there is a most conspicuous one: computers are not as qualified as human teachers in academic fields. As we all know, students can get the final result of a mathematic question under the help of computers, however, they are still confused on the whole computing process. By contrast, our human teachers’ performance is much better in those cases. They not only can teach students how to analyze and compute the question, but also can remind them what are the possible errors that they may meet. Thus, human teachers are more adequate than computers in academic aspect. The second advantage of human teachers is they can guide students to deal with some psychological problems that they meet in schools. In China, sometimes, teachers even burden many responsibilities that students’ parents have. For example, as for the student with rebellious spirit, the important duty for teachers is to prevent the student from campus violence, even crime. Obviously, computers cannot do that.In summary, from what has been discussed above, we may safely arrive at the conclusion that the positions of human teachers are unshakable, and computers cannot take the places of them.。
ielts.雅思9分写作范文全集大家在备考雅思写作的时候需要参考一些高分范文,下面小编就给大家整理了一些ielts.雅思9分写作范文,希望大家喜欢。
雅思写作高分范文:close relationship of familiesYou should spend about 40 minutes on this task.Families are not as close as before. Give reasons for this change, and suggest some ways to bring families closer.You should write at least 250 words. You should use your own ideas of knowledge and experience and support your arguments with examples and relevant evidence.In the past, family was a very important concept in people’s minds, and it was the center of many people’s lives. Nowadays, however, the relationship between family members is not as close as before. But as to what factors contribute to this phenomenon, different people have diverse opinions. As far as I am concerned, it results from the following reasons.The first reason is that people spend more time on their study and work. Compared with the past, people face fierce competition and suffer from great pressure. Therefore, they have to devote more time and energy to their careers. Some people are too occupied to spare time for their family. What is more, many jobs require people to work in other cities and many children have to leave their parents at an early age to study or work elsewhere. As time passes, these people become emotionally estranged from their parents.Another reason is that there are more entertainment forms available. Nowadays high technology brings us more interesting things which can easily attract people’s attention, such as watching TV, surfing the Internet or plating video games. As aresult, people are indulged in these activities, totally neglecting the feelings of other family members.To bring families closer, people put forward various suggestions. Firstly, never bring your work home and leave it in your office. We should spare more time with family members no matter how occupied we are. Secondly, try to squeeze some time for a regular family dinner because dinner time is a perfect time and opportunity for people to exchange their feelings and ideas. Last but not least, we should teach the children the sense of family when they are still young.Family is the basic unit of a society. It plays a significant role in our lives. In order to enjoy a harmonious family life and maintain a stable society, we should take efforts to create a close family relationship. (342 words)雅思写作高分范文:economy and environmentSome people think that the urgent task is to develop economy on a large scale. First, they hold that many people, especially in rural areas, are living in poverty. As a result, many children drop out of school and can’t afford even the compulsory education. Second, they believe only by further balance and developing our economy can we get rid of poverty and gain the overall prosperity.On the other hand, many people insist that environment protection should be a top priority. First, they claim that we have only one mother earth, if our ecological environment is heavily polluted or ruined, we could not even survive on this planet. Second, they believe, it’s the rapid and advanced development of economy that leads to the present situation that most parts of the world are polluted. If the problem left unsolved, one day we may have nothing to drink, let alone develop our economy.In my opinion, both economy and environment protection are our urgent tasks now. Without economic development, we should remain backward. Moreover, we might be conquered or bullied by other powerful countries. And without environment protection, we should lose our home. Therefore, the best solution is to develop environment-protection-oriented industries and agriculture so as to kill two birds with one stone.雅思写作高分范文:education only for employment?You should spend about 40 minutes on this task.Some people think the university education is to prepare students for employment, others think it has other functions. Discuss and say what the other functions are?You should write at least 250 words.You should use your own ideas of knowledge and experience and support your arguments with examples and relevant evidence.Some people think the university education is to prepare students for employment. While we admit that preparation for employment is an important function of education, it is not the only one. We should see this issue with an all-sided view. In the perspective of society, education is for improvement. Students make use of what they have learned to create new theories and tools. This is the way in which our human society develops. And also, through education, government can teach people how to be appropriate citizens, thus in this way, people’s moralities and behaviors are constrained in a value system and the social stability can be maintained.In the perspective of individuals, education can enrich personal lives. Through education, we can explore different cultures and customs. Thus in this way education can open oureyes and broaden our mind. And education can also meet interests of each student.While of course, all the functions mentioned above have one common prerequisite: one can make a living in the first place. For this society is practical, many university students have studied for four years, but their ability to deal with practical things is too low to be acceptable. So education should provide the basic general knowledge to university students, so that they can be get employed and make a living. And if a nation wants to develop and to compete with other nations, it needs skilled workers to support economic development and to maintain the people creative, which can only be achieved through education.So it has some sense to realize that students’ preparation for employment is the function of education, but it has far more function which should not be neglected. (280 words) 雅思写作高分范文:examinationYou should spend about 40 minutes on this task.Some people think that examinations have some bad effects on both students and teachers. Some people say they do a good job in the evaluation of the students’ performance. What is your opinion?You should write at least 250 wordsYou should use your own ideas of knowledge and experience and support your arguments with examples and relevant evidence.From elementary schools to universities, students have to take many examinations. They even regard examinations as an indispensable part of their life. In most schools and colleges, examinations are used as a chief means of deciding whether a student succeeds or fails in a subject. However, although they dothe job efficiently, their side effects are also enormous.Examinations are unable to evaluate one’s true ability. They can only test memory or the skill of working rapidly under pressure. Sometimes the future of a candidate may be decided in a single examination. How can one do his best when he is under the extreme pressure? In other words, it does not mean that all of those who get high scores on examinations possess creativity in dealing with various problems. There are many stories that examinations failures turn out to be great scientists or successful entrepreneurs.Another effect is that examinations encourage bad study habits. Students tend to lay emphasis on the content which will be tested. They are encouraged to memorize rather than to think. Moreover, examinations induce cramming during the exam week. However after the examination, most children forget nearly all the information and facts they stuff into their heads.Examinations lower the standards of teaching as well. They deprive teachers of all freedom. Since teachers themselves are often judged by examination results, they have to train students in exam techniques instead of teaching their subjects. Furthermore, students are required to learn only what teachers tell them.In conclusion, even though examinations have been used in the past, they should no longer be used as the only means of evaluation. They cannot assess a student’s performance in learning and they also have negative impacts on both students and teachers. (290 words)雅思写作高分范文:education only for employment?You should spend about 40 minutes on this task.Some people think the university education is to preparestudents for employment, others think it has other functions. Discuss and say what the other functions are?You should write at least 250 words.You should use your own ideas of knowledge and experience and support your arguments with examples and relevant evidence.Some people think the university education is to prepare students for employment. While we admit that preparation for employment is an important function of education, it is not the only one. We should see this issue with an all-sided view. In the perspective of society, education is for improvement. Students make use of what they have learned to create new theories and tools. This is the way in which our human society develops. And also, through education, government can teach people how to be appropriate citizens, thus in this way, people’s moralities and behaviors are constrained in a value system and the social stability can be maintained.In the perspective of individuals, education can enrich personal lives. Through education, we can explore different cultures and customs. Thus in this way education can open our eyes and broaden our mind. And education can also meet interests of each student.While of course, all the functions mentioned above have one common prerequisite: one can make a living in the first place. For this society is practical, many university students have studied for four years, but their ability to deal with practical things is too low to be acceptable. So education should provide the basic general knowledge to university students, so that they can be get employed and make a living. And if a nation wants to develop and to compete with other nations, it needs skilled workers tosupport economic development and to maintain the people creative, which can only be achieved through education.So it has some sense to realize that students’ preparation for employment is the function of education, but it has far more function which should not be neglected. (280 words)。
001The chart and graph below give information about sales and share prices for Coca-Cola. Write a report for a university lecturer describing the information shown below.You should write at least 150 words.You should spend about 20 minutes on this task.The pie chart shows the worldwide distribution of sales of Coca-Cola in the year 2000 and the graph shows the change in share prices between 1996 and 2001.In the year 2000, Coca-Cola sold a total of 17.1 billion cases of their fizzy drink product worldwide. The largest consumer was North America, where 30.4 per cent of the total volume was purchased. The second largest consumer was Latin America. Europe and Asia purchased 20.5 and 16.4 per cent of the total volume respectively, while Africa and the Middle East remained fairly small consumers at 7 per cent of the total volume of sales.Since 1996, share prices for Coca-Cola have fluctuated. In that year, shares were valued at approximately $35. Between 1996 and 1997, however, prices rose significantly to $70 per share. They dipped a little in mid-1997 and then peaked at $80 per share in mid-98. From then until 2000 their value fell consistently but there was a slight rise in mid-2000.002The chart below gives information about global sales of games software, CDs and DVD or video.Write a report for a university lecturer describing the information.You should write at least 150 words.You should spend about 20 minutes on this task.The chart shows the changes in the sales of video material / DVDs, games software and CDs around the world in billions of dollars over a three-year period. It can be seen that the sales of videos / DVDs and games software have increased, while the sales of CDs have gone down slightly.Between 2000 and 2003, the sale of videos and DVDs rose by approximately 13 billion dollars. In 2000, just under 20 billion dollars worth of these items were sold, but in 2003, this figure had risen to a little over 30 billion dollars.The sales of games software also rose during this period, but less sharply. Sales increased from about 13 billion dollars in 2000 to just under 20 billion dollars three years later. By contrast, during the same time period, the sale of CDs fell from 35 billion dollars in 2000 to about 32.5 billion dollars in 2003.003The graphs below show the types of music albums purchased by people in Britain according to s3x and age.Write a report for a university lecturer describing the information shown below.You should write at least 150 words.You should spend about 20 minutes on this task.The three graphs provide an overview of the types of music people purchase in the UK. At first glance we see that classical music is far less popular than pop or rock music.While slightly more women than men buy pop music, the rock market is dominated by men with 30% buying rock, compared to 17% of women. From the first graph we see that interest in pop music is steady from age 16 to 44 with 20% of the population continuing to buy pop CDs after the age of 45.The interest in rock music reaches its peak among the 25 to 34 year olds, though it never sells as well as pop. Interest also drops off after the age of 35 with an even sharper fall from age 45 onwards, a pattern which is the opposite to the classical music graph.004You should spend about 20 minutes on this task.The graphs below show the numbers of male and female workers in 1975 and 1995 in several employment sectors of the republic of Freedonia.Write a report for a university teacher describing the information shown.You should write at least 150 words.The two decades between 1975 and 1995 brought significant changes in the representation of women in Freedonia's work force, according to the graphs.In 1975, for example, some 300 000 men and 250 000 women worked in the communications sector. Twenty years later, though the number of men remained unchanged, the number of women rose to 550 000.A similar situation was seen in the wholesale and retail trade sector, where the number of women rose from about 550 000 in 1975 to almost 800 000 two decades later. The number of men in this sector remained stable over the period, at around 700 000.Women also made gains in both the finance/banking industries and in the defence-related public sector. Whereas some 125 000 women worked in finance and banking institutions in 1975, the number increased to 450 000 by 1995. The number of men grew only marginally from 425 000 to 480 000 over the same period. In defence, the number of men declined from 225 000 to 200 000, while the number of women rose from 25 000 to over 100 000.Two sectors that retained stable employment numbers for both men and women were manufacturing, which had about 300 000 women and 650 000 men in both surveyed years, and the public sector (non-defence), which employed 650 000 women and 850 000 men.Thus, women appear to have made gains in the Freedonian work force but not at the expense of men.You should spend about 20 minutes on this task.Eating sweet foods produces acid in the mouth, which can cause tooth decay. (High acid levels are measured by low pH values)Describe the information below and discuss the implications for dental health.You should write at least 150 words.Anyone who has visited a dentist has been told that eating excessive amounts of sweets risks harming the teeth. This is because sweets lower pH levels in the mouth to dangerous levels.When the pH level in the mouth is kept above 5.5, acidity is such that teeth are unlikely to be in danger of decay. Sweet foods, however, cause pH in the mouth to drop for a time, and the longer pH levels remain below 5.5, the greater the opportunity for decay to occur.By comparing fruit sugar, cane sugar and honey, which are all common ingredients of sweet foods, we find that cane sugar lowers pH levels for the longest period, thus producing the greatest risk of the three. Approximately five minutes aftfter consuming cane sugar, pH levels drop to as little as pH 3.5. They then begin to rise slowly, but do not rise above pH 5.5 until at least 30 minutes have elapsed. By contrast, fruit sugar, which causes the mouth's acidity to fall to just above pH 4, poses a danger for a shorter period: tooth decay is unlikely 20 minutes after consumption. Honey appears an even less risky substance. Though acidity falls to about pH 4.75 within five minutes of consumption, it returns to above pH 5.5 in under fifteen minutes.The implications, then, are that people who insist on eating sweet foods should be aware of the ingredients, and that fruit sugar or honey appear preferable to cane sugar.The diagram below shows the typical stages of consumer goods manufacturing, including the process by which information is fed back to earlier stages to enable adjustment.Write a report for a university lecturer describing the process shown.You should write at least 150 words.You should spend about 20 minutes on this task.Most consumer goods go through a series of stages before they emerge as finished products ready for sale.Raw materials and manufactured components comprise the initial physical input in the manufacturing process. Once obtained, these are stored for later assembly. But assembly first depends upon the production planning stage, where it is decided how and in what quantities the stored materials will be processed to create sufficient quantities of finished goods. The production planning stage itself follows the requirements of the goods' design stage that proceeds from extensive research. After assembly, the products are inspected and tested to maintain quality control l Those units that pass the inspection and testing stages are then packaged, despatched and offered for sale in retail outlets. The level of sales, which is the end point of the manufacturing process, helps determine production planning.A product's design is not only the result of product research, but is also influenced by testing and market research. If the testing stage (after assembly and inspection) reveals unacceptable problems in the finished product, then adjustments will have to be made to the product's design. Similarly, market research, which examines the extent and nature of the demand for products, has the role of guiding product design to suit consumer demands which may change with time. Market research, while influenced by product sales, also serves to foster future sales by devising suitable advertising for the goods.Thus the reality of consumer goods manufacturing goes well beyond a simple linear production process.007The table below shows social and economic indicators for four countries in 1994, according to United Nations statistics.Describe the information shown below in your own words. What implications do the indicators have for the countries?You should write at least 150 words.Allow yourself 20 minutes for this task.A glance at four indicators of economic and social conditions in four countries, Canada, Japan, Peru and Zaire, in 1994 reflects the great differences that exist between wealthier and poorer nations.The table shows that Japan and Canada had annual incomes of $15 760 and $11 100 per person, respectively. These figures were overwhelmingly greater than the corresponding figures of $160 in Peru and $130 in Zaire.Health indicators, too, reflected overall levels of affluence in the four nations. Life expectancy at birth, for example, was higher among the more economically developed countries. Japan reported the highest life expectancy, 78. This was followed by Canada, 76; Peru, 51; and Zaire, 47; This suggests that richer societies are able to put more money into health care than poorer ones.The amount of calories consumed daily per person roughly followed the same ranking. Canadians each consumed some 3 326 calories per day while the Japanese took 2846 calories. The corresponding figures for Peru and Zaire were 1927 and 1749, respectively.Literacy rates among adults, too, were higher in wealthier countries, no doubt a reflection of ability to invest in education. Canada and Japan both reported literacy rates of 99%, while Peru claimed 68%. Zaire, the least economically developed of the four countries, had a literacy rate of 34%.The data appear to confirm the often cited link between national wealth and health and education standards.008The diagram below shows the average hours of unpaid work per week done by people in different categories. (Unpaid work refers to such activities as childcare in the home, housework and gardening.)Describe the information presented below, comparing results for men and women in the categories shown. Suggest reasons for what you see.You should write at least 150 words.You should spend about 20 minutes on this task.The diagram reveals that the number of hours per week spent in unpaid work is unequally distributed between men and women.In households where there are no children, women are reported to work some 30 hours per week in such tasks as housework and gardening. Men's contribution to these unpaid jobs averages a considerably lower 18 hours.When children enter the household, however, the inequality becomes even more pronounced. In families of 1 - 2 children, men maintain approximately the same number of hours of unpaid work as in childless households, but the number of hours women work in the home rises to 52 per week, much of it, on doubt, due to childcare responsibilities.Interestingly, when there are three or more children in the household, men are found to work even fewer hours around the house than before the appearance of the third child. Whereas women's unpaid hours rise to approximately 56 per week, the corresponding figure for men, 16, actually represents a decrease.The data suggest that the increased presence of women in the paid work force has yet to lead to an increased role for men in the home.009The chart below shows the amount of leisure time enjoyed by men and women of different employment status.Write a report for a university lecturer describing the information shown below.You should write at least 150 words.Allow yourself 20 minutes for this task.The chart shows the number of hours of leisure enjoyed by men and women in a typical week in 1998-9, according to gender and employment status.Among those employed full-time, men on average had fifty hours of leisure, whereas women had approximately thirty-seven hours. There were no figures given for male part-time workers, but female part-timers had forty hours of leisure time, only slightly more than women infull-time employment, perhaps reflecting their work in the home.In the unemployed and retired categories, leisure time showed an increase for both sexes, as might have been expected. Here too, men enjoyed more leisure time over eighty hours, compared with seventy hours for women, perhaps once again reflecting the fact that women spend more time working in the home than men.Lastly, housewives enjoyed approximately fifty-four hours of leisure, on average. There were no figures given for househusbands! Overall, the chart demonstrates that in the categories for which statistics on male leisure time were available, men enjoyed at least ten hours of extra leisure time.010Write a report for a university lecturer describing the information in the graph below.You should write at least 150 words.Allow yourself 20 minutes for this task.The graph compares the rate of smoking in men and women in Someland between the years 1960 and 2000. It can be clearly seen that the rate of smoking for both men and women is currently declining and that fewer women have smoked throughout the period.In 1960, 600 men in every 1,000 was smoking. This number decreased gradually to 500 by 1974 and continued to decrease but more steeply to 250 in 2000. In contrast, the rate of smoking in women in 1960 was very low at only 80 in every 1,000. By 1968 this increased to 170, and increased again but more steeply to 320 in 1977. The rate of female smokers then remained stable at 320 until 1984 at which point the figures began to decline and had dropped to 200 by 2000.In conclusion we can see that the rate of smoking in men dropped throughout the whole period but was always at a higher level than the female figures. The rate of smoking in women increased until 1977 but then decreased for the rest of the period.011Write a report for a university lecturer describing the information in the graphs below.You should write at least 150 words.Allow yourself 20 minutes for this task.The graphs compare the number of deaths caused by six diseases in Someland in 1990 with the amount of research funding allocated to each of those diseases. It can be clearly seen that the amount of research funding in many cases did not correlate with the seriousness of the disease in terms of numbers of deaths.In 1990 there were around 0.2 million deaths from AIDS, 0.1 million deaths from leprosy, 0.3 million deaths from tropical diseases, 0.5 million deaths from diarrhoea, 0.4 million deaths from malaria and 1.8 million deaths from TB. These figures can be contrasted with the amount of funding allocated for each disease. In 1990 AIDS received 180 million dollars in research funding, leprosy 80 million dollars in research funding, tropical diseases 79 million dollars in research funding, diarrhoea 60 million dollars in research funding, malaria 50 million dollars and TB 20 million dollars in research funding.In conclusion it is clear that funding allocation for disease research in Someland is not wholly determined by the number of deaths for which each disease is responsible in a given year.012Write a report for a university lecturer describing the information in the two graphs below. You should write at least 150 words.Allow yourself 20 minutes for this task.The pie charts compare the highest level of education achieved by women in Someland across two years, 1945 and 1995. It can be clearly seen that women received a much higher level of education in Someland in 1995 than they did in 1945.In 1945 only 30% of women completed their secondary education and 1% went on to a first degree. No women had completed post-graduate studies. This situation had changed radically by 1995. In 1995, 90% of women in Someland had completed secondary education and of those, half had graduated from an initial degree and 20% had gone on to postgraduate studies. At the other end of the scale we can see that by 1995 all girls were completing lower secondary, although 10% ended their schooling at this point. This is in stark contrast with 1945 when only 30% of girls completed primary school, 35% had no schooling at all and 35% only completed the third grade.In conclusion, we can see that in the 50 years from 1945 to 1995 there have been huge positive developments to the education levels of women in Someland.013Write a report for a university lecturer describing the information in the table below.You should write at least 150 words.Allow yourself 20 minutes for this task.The table shows how people in different age groups spend their leisure time in Someland over the course of a year. It can be clearly seen that the amount of leisure time available varies considerably across the age groups and that people of different age levels have very different ways of spending their leisure time.According to the figures, as people age in Someland their social lives reduce. Teenagers and people in their twenties spend on average 500 hours per year on socialising and 350 hours of that time is with a group of more than 4 people. Although the total hours of socialising in their 30s, 40s, 50s and 60s is fairly constant (between 300-350), socialising with more than 4 people drops dramatically to 50 hours in the 30s and 40s age groups and only 25 from 50 years old. Group and individual exercise follow a similar pattern.People of all ages spend a good part of their leisure time on entertainment such as TV/video viewing and cinema. In both cases, teenagers and retired people spend around twice as much time as those who are at working age. Home entertainment ranges from just over a thousand hours for teenagers and retired people and an average of 600 hours for everyone else. Cinema accounts for 100 hours o f the teenagers and retired people’s leisure time and 25-50 hours for the rest.In conclusion we can see there is a significant trend towards solitary and smaller group activities as people grow older and that teenagers and retired people spend a lot more time on entertainment than those of working age do.014Write a report describing the information in the graph below.You should write at least 150 words.You should spend about 20 minutes on this task.The chart shows striking differences in the level of computer and Internet penetration in the Arab world.The UAE and Kuwait are by far the most computerized countries, with Lebanon a distant third. The UAE has over 150 computers for every 1000 inhabitants, compared to Kuwait's 130 and Lebanon's 60. In contrast, countries such as Egypt, Morocco and Syria have less than 20 computers per 1000 inhabitants.There are also great differences in Internet use and availability. The UAE has by far the highest proportion of users, with more than one-third of its population using the Internet. Kuwait and Lebanon are second and third again, with 100 users per thousand in Kuwait and 80 in Lebanon. In some countries the number using the Internet is negligible: Saudi Arabia has less than 20 users per thousand, and there are fewer than 5 users per thousand in Syria.One unusual feature of the graph is that Internet use does not seem to be directly related to the number of computers. In several countries (the UAE, Lebanon, Jordan and Oman), there are more Internet users per thousand people than computers. However, in other countries, such as Kuwait, Saudi Arabia and Syria, the number of Internet users is lower than the number of computers.In summary, there are major differences between computer use and Internet use in the Arab world, but the UAE clearly leads the area in both number of computers and number of internet users per capita.015The graph below shows the different modes of transport used to travel to and from work in one European city in 1960, 1980 and 2000.Write a report for a university lecturer describing the information below.You should write at least 150 words.You should spend about 20 minutes on this task.The graph shows the changing patterns in commuting by train, car, tube or bus for commuters in London in the years 1960, 1980 and 2000.The number of people using trains at first rose from just under 20% in 1960 to about 26% in 1980, but then fell back to about 23% in 2000.Use of the tube has been relatively stable, falling from around 27% of commuters in 1960 to 22% in 1980, but climbing back to reach 25% by 2000.On the other hand, the use of cars increased steadily from just over 5% in 1960 to 23% in 1980, reaching almost 40% by 2000, whereas the popularity of buses has declined since 1960, falling from just under 35% in 1960 to 27% in 1980 and only 15% in 2000.The graph indicates the growing use of cars for commuting to work between 1960 - 2000, and the corresponding decline in the popularity of buses from being the most popular mode of transport in 1960 to the least popular in 2000.016Write a report for a university lecturer describing the information below.You should write at least 150 words.You should spend about 20 minutes on this task.The graphs show health and education spending and changes in life expectancy and infant mortality in the UAE. Overall, as the percentage spent on health and education increases, infant mortality and life expectancy improve.Graph 1 shows the percentage of GDP spent on health and education between 1985 and 1993. There were big increases in both areas. Health spending stood at about 8% in 1985 but rose to 9% in 1990 and 10% in 1993. Spending on education was even higher. It was 10% in 1985, and shot up to 14% in 1990 and 15% in 1993, a 50% increase in just 8 years.Graph 2 shows improvements in life expectancy and infant mortality between 1970 and 1992. Life expectancy was just 60 in 1970 but rose to almost 72 in 1992. In contrast, the number of babies dying dropped dramatically, from 60 per 1000 in 1970 to only 22 in 1992.In conclusion, people in the UAE are living longer and healthier lives because of the government's spending on education and medical facilities.017Write a report for a university lecturer describing the information below.You should write at least 150 words.You should spend about 20 minutes on this task.The graph shows weekly expenditure on fast food in Britain by food and income group. There are two main trends. First, the expenditure is directly related to income. Secondly, there are differences in the types of fast food eaten by each group.The amount of money spent on fast food is related to income. People in the high-income group spent the most - over 85 pence per person per week. People in the low-income group spent the least - less than half of what the high-income earners spent.The type of fast food eaten also depends on the group. High-income earners spent 3 times more on hamburgers than people in the low-income group. Pizza was generally the least favorite food. Fish and chips was the most popular food with the low-income group but consumption was fairly similar among all groups.018Write a report for a university lecturer describing the information below.You should write at least 150 words.You should spend about 20 minutes on this task.The pie charts show changes in American spending patterns between 1966 and 1996.Food and cars made up the two biggest items of expenditure in both years. Together they comprised over half of household spending. Food accounted for 44% of spending in 1966, but this dropped by two thirds to 14% in 1996. However, the outlay on cars doubled, rising from 23% in 1966 to 45% in 1996.Other areas changed significantly. Spending on eating out doubled, climbing from 7% to 14%. The proportion of salary spent on computers increased dramatically, up from 1% in 1996 to 10% in 1996. However, as computer expenditure rose, the percentage of outlay on books plunged from 6% to 1%.Some areas remained relatively unchanged. Americans spent approximately the same amount of salary on petrol and furniture in both years.In conclusion, increased amounts spent on cars, computers, and eating out were made up for by drops in expenditure on food and books.019Write a report for a university lecturer describing the information below.You should write at least 150 words.You should spend about 20 minutes on this task.The graph shows changes in the amount of fast food consumed in the UK between 1970 and 1990. Several trends are apparent. First, Britons are eating more and more fast food. Secondly, the type of fast food has changed.In 1970, the most popular fast food was fish and chips. Over 300g were consumed each week. By 1990, however, this had fallen to just over 200g - a 50% drop. Consumption of other fast foods such as pizza and hamburgers increased, however. The amount of pizza eaten shot up from about 20g a week to more than 270g, overtaking fish and chips in the late 1980s. Hamburger consumption also increased, rising from about 80g in 1970 to almost 300g in 1990.Accompanying this change in the choice of foods was an increase in the amount of fast food consumed. In 1970, British consumers ate about 450g a week of fast food. In 1990, on the other hand, this had more than doubled, to 1000g.Alternative answer:The graph shows the amount of fast food eaten between 1970 and 1990 in grams per person per week. Overall, the amount of fast food eaten more than doubled.The amount of fish and chips eaten declined slightly. In 1970, the consumption was about 300g/week. This fell to 220g/week in 1990.In contrast, sales of hamburger and pizza rocketed. In 1970, very little pizza was eaten - less than 50g/week. This rose to 280g/week by 1990. In the same period, hamburger sales shot up by more than 500%, from 100g/week in 1970 to 500 grams in 1990.In conclusion, although there was a big increase in the consumption of pizza and hamburger, sales of fish and chips decreased.020Write a report describing the information in the graph below.You should write at least 150 words.You should spend about 20 minutes on this task.The chart shows striking changes in the fertility rate of women in six Gulf countries – Saudi Arabia, the UAE, Oman, Qatar, Kuwait and Bahrain between 1990 and 2000.In the ten year period, there was a decline in the number of births per woman in all countries. The biggest declines were in two countries which had low fertility rates at the start of the decade, Bahrain and the UAE.Fertility rates vary greatly between the six countries. Oman and Saudi Arabia had the highest rates, with over seven births per woman in 1990. This compared with around 4 births per woman in Bahrain and the UAE, and just 3.75 in KuwaitBy 2000, the rate had fallen below three births per woman in Kuwait, Bahrain and the UAE, with a drop of over 25% in a decade in the UAE. However, in Saudi Arabia and Oman, the rates fell by just 20%, from 7.0 to 5.5.In summary, there were major decreases in birth rates in all countries, but some countries in the region have double the fertility rate of others.021The chart below shows the amount spent on six consumer goods in four European countries. Write a report for a university lecturer describing the information shown below.You should write at least 150 words.You should spend about 20 minutes on this task.The chart shows that Britain, among the four European countries listed, has spent most heavily on the range of consumer goods included. In every case, British spending is considerably higher than that of other countries; only in the case of tennis racquets does another country, Italy, come close.In contrast, Germany is generally the lowest spender. This Is most evident in photographic film, where Germany spends much less than Britain. Germany only spends more than another country, France, in two cases; tennis racquets and perfumes.。