
Day1_SIG_GenCoord
- 格式:pdf
- 大小:2.88 MB
- 文档页数:39

2.1数据交换文件详述基线精度的分析及检核都需要基线解的信息,而在TGO数据交换文件就存储着基线向量等我们感兴趣的信息,其中有项目信息、测站信息、基线向量信息等。
具体详细信息在文件[General]、[Stations]、[Keyed In Coordinates]、[Observed Coordinates]、[GPS]、[Terrestrial]、[Laser]、[Level Run]、[Reduced Observations]、[Azimuths]模块中可见。
在每个模块中信息是以行记录的,各行中的信息是以分号为分割的,各个模块的信息在下文中详细介绍。
在[General]中记录项目的基本信息,有项目的名称、投影基准、坐标系统、大地水准面模型、坐标单位、距离单位、高度单位等信息。
在[Stations]中存储着GPS点的名称、经度、纬度、所在坐标系统下的三维坐标,及该GPS点是否作为已知点还是待求点。
其中,已知点标示方式有固定平面、高度、高程。
在此模块中可看出是否进行了约束平差,下面为此模块中的部分信息示例:“Station=2:?:G0:13.321107367N:44.281843018E:1552.7786:1473615.641:422176.32 5:1562.4080:1:0:1::”其中,第3位:点名,GPS点的名称,如G0。
第4位:纬度,GPS点的纬度,如13.321107367N。
第5位:经度,GPS点的经度,如44.281843018E。
第6位:高度,GPS点的大地高,如1552.7786。
第7位:北坐标,GPS点在项目已定坐标系统下的北坐标,如1473615.641。
第8位:东坐标,GPS点在项目已定坐标系统下的东坐标,如422176.325。
第9位:高程,GPS点在项目已定坐标系统下的高程,即H,如1562.4080。
第10位:东、北坐标的固定状态,当为1时为固定,当为0时未固定。

Package‘gggenes’September5,2023Title Draw Gene Arrow Maps in'ggplot2'Version0.5.1Description A'ggplot2'extension for drawing gene arrow maps.Depends R(>=3.6)Imports grid(>=3.3.0),ggplot2(>=2.2.1),ggfittext(>=0.8.0),rlang(>=0.2.0)License GPL-2LazyData trueRoxygenNote7.2.3URL https:///gggenes/BugReports https:///wilkox/gggenes/issues/Suggests testthat,knitr,rmarkdown,vdiffr,spellingVignetteBuilder knitrEncoding UTF-8Language en-USNeedsCompilation noAuthor David Wilkins[aut,cre],Zachary Kurtz[ctb]Maintainer David Wilkins<****************>Repository CRANDate/Publication2023-09-0511:50:10UTCR topics documented:example_dummies (2)example_features (2)example_genes (3)geom_feature (4)geom_feature_label (5)12example_features geom_gene_arrow (7)geom_gene_label (8)geom_subgene_arrow (10)geom_subgene_label (11)make_alignment_dummies (13)theme_genes (14)Index15 example_dummies A set of example dummy alignment genes.DescriptionDummy genes,similar to those generated with make_alignment_dummies(),for example purposes only.Usageexample_dummiesFormatA data frame with eight rows and three variables:molecule the genomestart the start position of the dummyend the end position of the dummygene the name of the dummy geneexample_features A set of example genetic features.DescriptionGenetic features for example purposes only.Usageexample_featuresexample_genes3 FormatA data frame with23rows andfive variables:molecule the genomename the name of the featuretype the type of the featureposition the position of the featureforward is the feature oriented,and if so in the forward direction?example_genes A set of example genes.DescriptionGenes for example purposes only.Usageexample_genesexample_subgenesFormatA data frame with72rows and six variables:molecule the genomegene the name of the genestart the start position of the geneend the end position of the genestrand the strand of the geneorientation the orientation of the geneexample_subgenes(143rows)also contains:subgene the name of the subgenefrom the start position of the subgene segmentto the end position of the subgene segmentAn object of class data.frame with143rows and9columns.4geom_feature geom_feature A’ggplot2’geom to draw point genetic featuresDescriptiongeom_feature()draws lines to indicate the positions of point genetic features,for example restric-tion sites,origins of replication or transcription start sites.Usagegeom_feature(mapping=NULL,data=NULL,stat="identity",position="identity",na.rm=FALSE,show.legend=NA,inherit.aes=FALSE,feature_height=unit(3,"mm"),feature_width=unit(3,"mm"),arrowhead_width=unit(2,"mm"),...)Argumentsmapping,data,stat,position,na.rm,show.legend,inherit.aes,...As standard for ggplot2.inherit.aes is set to FALSE by default,as features arenot likely to share any plot aesthetics other than y.feature_height grid::unit()object giving the height of a feature above the molecule line.Can be set as a negative value to draw features below the line.Defaults to3mm.feature_width grid::unit()object giving the width of a feature(distance from the elbow to the tip of the arrow).Only relevant for oriented features.Defaults to3mm.arrowhead_widthgrid::unit()object giving the width of the arrowhead indicating the directionof an oriented feature.Only relevant for oriented features.Defaults to2mm.DetailsFeatures are drawn as vertical lines extending from the horizontal line representing the molecule.The position of the feature is expressed with the x aesthetic.Optionally,the forward aesthetic can be used to specific an orientation for the feature(e.g.the direction of transcription),in which case an angled arrowhead will be added.The forward aesthetic assumes that the x-axis is oriented in the normal direction,i.e.increasing from left to right;if it is not,the values in forward will need to be inverted manually.Aesthetics•x(required;position of the feature)•y(required;molecule)•forward(optional;if TRUE,or a value coercible to TRUE,the feature will be drawn with an arrowhead pointing right,if FALSE,pointing left,if NA,the feature will be drawn as a vertical line)•alpha•colour•linetype•sizeSee Alsogeom_feature_label()Examplesggplot2::ggplot(example_genes,ggplot2::aes(xmin=start,xmax=end,y=molecule,fill=gene))+ geom_gene_arrow()+geom_feature(data=example_features,ggplot2::aes(x=position,y=molecule,forward=forward))+ ggplot2::facet_wrap(~molecule,scales="free")geom_feature_label A’ggplot2’geom to add text labels to point genetic featuresDescriptiongeom_feature_label()adds text labels to features drawn with geom_feature().Usagegeom_feature_label(mapping=NULL,data=NULL,stat="identity",position="identity",na.rm=FALSE,show.legend=FALSE,inherit.aes=FALSE,feature_height=unit(4,"mm"),label_height=unit(3,"mm"),...)Argumentsmapping,data,stat,position,na.rm,show.legend,inherit.aes,...As standard for ggplot2.inherit.aes is set to FALSE by default,as features arenot likely to share any plot aesthetics other than y.feature_height grid::unit()object giving the height of the feature being labelled,and hence the distance of the label above or below the molecule line.Can be set as anegative value for features drawn below the line.Defaults to4mm,to alignlabels with the default height of geom_feature().label_height grid::unit()object giving the height of the label text.Defaults to3mm.DetailsStandard’ggplot2’aesthetics for text are supported(see Aesthetics).Aesthetics•x(required;position of the feature)•y(required;molecule)•label(required;the label text)•forward(optional;will draw text in the appropriate location for features with angled arrow-heads)•colour•size•alpha•family•fontface•angleSee Alsogeom_feature()Examplesggplot2::ggplot(example_genes,ggplot2::aes(xmin=start,xmax=end,y=molecule,fill=gene))+ geom_gene_arrow()+geom_feature(data=example_features,ggplot2::aes(x=position,y=molecule,forward=forward))+ geom_feature_label(data=example_features,ggplot2::aes(x=position,y=molecule,label=name,forward=forward))+ggplot2::facet_wrap(~molecule,scales="free")geom_gene_arrow7 geom_gene_arrow A’ggplot2’geom to draw genes as arrowsDescriptiongeom_gene_arrow()draws genes as arrows,allowing gene maps to be drawn.Usagegeom_gene_arrow(mapping=NULL,data=NULL,stat="identity",position="identity",na.rm=FALSE,show.legend=NA,inherit.aes=TRUE,arrowhead_width=grid::unit(4,"mm"),arrowhead_height=grid::unit(4,"mm"),arrow_body_height=grid::unit(3,"mm"),...)Argumentsmapping,data,stat,position,na.rm,show.legend,inherit.aes,...As standard for ggplot2.arrowhead_widthgrid::unit()object giving the width of the arrowhead.Defaults to4mm.Ifthe gene is drawn smaller than this width,only the arrowhead will be drawn,compressed to the length of the gene.arrowhead_heightgrid::unit()object giving the height of the arrowhead.Defaults to4mm.arrow_body_heightgrid::unit()object giving the height of the body of the arrow.Defaults to3mm.DetailsThis geom draws genes as arrows along a horizontal line representing the molecule.The start and end locations of the gene are expressed with the xmin and xmax aesthetics,while the molecule can be specified with the y aesthetic.Optionally,an additional forward aesthetic can be used to reverse the orientation of some or all genes from that implied by xmin and xmax.Unless the plot is faceted with a free x scale,all the molecules will share a common x axis.This means that if the locations are very different across different molecules,the genes might appear very small and squished together with a lot of unnecessary empty space.To get around this,eitherfacet the plot with scales="free_x",or normalise the gene locations if their exact locations are not important.See make_alignment_dummies()for a method to align genes between molecules.Aesthetics•xmin,xmax(start and end of the gene;will be used to determine gene orientation)•y(molecule)•forward(if any value that is not TRUE,or coercible to TRUE,the gene arrow will be drawn in the opposite direction to that determined by xmin and xmax)•alpha•colour•fill•linetype•sizeSee Alsotheme_genes(),make_alignment_dummies(),geom_gene_label()Examplesggplot2::ggplot(example_genes,ggplot2::aes(xmin=start,xmax=end,y=molecule,fill=gene))+ geom_gene_arrow()+ggplot2::facet_wrap(~molecule,scales="free")geom_gene_label A’ggplot2’geom to add text labels to gene arrowsDescriptiongeom_gene_label()can be used to add a text label to genes drawn with geom_gene_arrow().Usagegeom_gene_label(mapping=NULL,data=NULL,stat="identity",position="identity",na.rm=FALSE,show.legend=FALSE,inherit.aes=TRUE,padding.x=grid::unit(1,"mm"),padding.y=grid::unit(0.1,"lines"),align="centre",min.size=4,grow=F,reflow=F,height=grid::unit(3,"mm"),...)Argumentsmapping,data,stat,position,na.rm,show.legend,inherit.aes,...Standard geom arguments as for ggplot2::geom_text().padding.x,padding.ygrid::unit()object,giving horizontal or vertical padding around the text.De-faults to1mm and0.1lines respectively.align Where inside the gene to place the text label.Default is’centre’;other options are’left’and’right’.min.size Minimum font size,in points.If provided,text that would need to be shrunk below this size tofit inside the gene arrow will not be drawn.Defaults to4pt.grow If TRUE,text will be grown as well as shrunk tofill the arrow.reflow If TRUE,text will be reflowed(wrapped)to betterfit the arrow.height grid::unit()object giving the maximum height of the text.Defaults to3mm, which is the default height of gene arrows drawn with geom_gene_arrow(). Detailsgeom_gene_label()uses the’ggfittext’package tofit text to genes.All text drawing options available in ggfittext::geom_fit_text()(growing,reflowing,etc.)are also available here.For full details on how these options work,see the documentation for ggfittext::geom_fit_text().Standard’ggplot2’aesthetics for text are supported(see Aesthetics).Aesthetics•xmin,xmax(start and end of the gene;required)•y(molecule;required)•label(the label text;required)•colour•size•alpha•family•fontface•angle10geom_subgene_arrowSee Alsogeom_gene_arrowExamplesggplot2::ggplot(example_genes,ggplot2::aes(xmin=start,xmax=end,y=molecule,fill=gene,label=gene))+geom_gene_arrow()+geom_gene_label()+ggplot2::facet_wrap(~molecule,ncol=1,scales="free")+theme_genes()geom_subgene_arrow A’ggplot2’geom to draw subgene segments of gene arrowsDescriptiongeom_subgene_arrow()draws subgenes segments within gene arrows drawn with geom_gene_arrow(). Usagegeom_subgene_arrow(mapping=NULL,data=NULL,stat="identity",position="identity",na.rm=FALSE,show.legend=NA,inherit.aes=TRUE,arrowhead_width=grid::unit(4,"mm"),arrowhead_height=grid::unit(4,"mm"),arrow_body_height=grid::unit(3,"mm"),...)Argumentsmapping,data,stat,position,na.rm,show.legend,inherit.aes,...As standard for’ggplot2’.arrowhead_widthgrid::unit()object giving the width of the arrowhead.Defaults to4mm.Ifthe gene is drawn smaller than this width,only the arrowhead will be drawn,compressed to the length of the gene.arrowhead_heightgrid::unit()object giving the height of the arrowhead.Defaults to4mm.arrow_body_heightgrid::unit()object giving the height of the body of the arrow.Defaults to3mm.DetailsThe start and end locations of the subgene are given with the xsubmin and xsubmax aesthetics.geom_subgene_arrow()requires some information about the’parent’gene,provided with thesame aesthetics used for geom_gene_arrow():start and end locations of the’parent’gene withthe xmin and xmax aesthetics,the molecule with the y aesthetic,and optionally the direction withthe forward aesthetic.If the geometry of the parent gene has been changed with arrowhead_width,arrowhead_height or arrow_body_height,identical parameters should be given to geom_subgene_arrow().Aesthetics•xmin,xmax(start and end of the gene;will be used to determine gene orientation)•xsubmin,xsubmax(start and end of subgene segment).Should be consistent with xmin/xmax•y(molecule)•forward(if FALSE,or coercible to FALSE,the gene arrow will be drawn in the oppositedirection to that determined by xmin and xmax)•alpha•colour•fill•linetype•sizeSee Alsogeom_gene_arrow(),geom_subgene_label()Examplesggplot2::ggplot(example_genes,ggplot2::aes(xmin=start,xmax=end,y=molecule))+geom_gene_arrow()+geom_subgene_arrow(data=example_subgenes,ggplot2::aes(xmin=start,xmax=end,xsubmin=from,xsubmax=to,y=molecule,fill=gene))+ggplot2::facet_wrap(~molecule,scales="free")geom_subgene_label A’ggplot2’geom to add text labels to subgenesDescriptiongeom_subgene_label()can be used to add a text label to subgenes drawn with geom_subgene_arrow().Usagegeom_subgene_label(mapping=NULL,data=NULL,stat="identity",position="identity",na.rm=FALSE,show.legend=FALSE,inherit.aes=TRUE,padding.x=grid::unit(1,"mm"),padding.y=grid::unit(0.1,"lines"),align="centre",min.size=4,grow=F,reflow=F,height=grid::unit(3,"mm"),...)Argumentsmapping,data,stat,position,na.rm,show.legend,inherit.aes,...Standard geom arguments as for ggplot2::geom_text().padding.x,padding.ygrid::unit()object,giving horizontal or vertical padding around the text.De-faults to1mm and0.1lines respectively.align Where inside the subgene to place the text label.Default is’centre’;other op-tions are’left’and’right’.min.size Minimum font size,in points.If provided,text that would need to be shrunk below this size tofit inside the subgene will not be drawn.Defaults to4pt.grow If TRUE,text will be grown as well as shrunk tofill the subgene.reflow If TRUE,text will be reflowed(wrapped)to betterfit the subgene.height grid::unit()object giving the maximum height of the text.Defaults to3mm, which is the default height of gene arrows(and therefore of subgenes)drawnwith geom_gene_arrow().Detailsgeom_subgene_label()uses the’ggfittext’package tofit text to genes.All text drawing options available in ggfittext::geom_fit_text()(growing,reflowing,etc.)are also available here.For full details on how these options work,see the documentation for ggfittext::geom_fit_text().Standard’ggplot2’aesthetics for text are supported(see Aesthetics.)Aesthetics•xsubmin,xsubmax(start and end of the subgene;required)make_alignment_dummies13•y(molecule;required)•colour•size•alpha•family•fontface•anglemake_alignment_dummiesPrepare dummy data to visually align a single gene across facetedmoleculesDescriptionmake_alignment_dummies()helps you to visually align genes across molecules that have been faceted with a free x scale.The output of this function is a data frame of dummy genes.If these dummy genes are added to a’ggplot2’plot with ggplot::geom_blank(),they will extend the x axis range in such a way that the start or end of a selected gene is visually aligned across the facets. Usagemake_alignment_dummies(data,mapping,on,side="left")Argumentsdata Data frame of genes.This is almost certainly the same data frame that will later be passed to ggplot2::ggplot().mapping Aesthetic mapping,created with ggplot2::aes().Must contain the following aesthetics:xmin,xmax,y,and id(a unique identifier for each gene).on Name of gene to be visually aligned across facets.This gene must be present in ’data’,in the column mapped to the id aesthetic.side Should the visual alignment be of the’left’(default)or’right’side of the gene? Examplesdummies<-make_alignment_dummies(example_genes,ggplot2::aes(xmin=start,xmax=end,y=molecule,id=gene),on="genE")ggplot2::ggplot(example_genes,ggplot2::aes(xmin=start,xmax=end,y=molecule,fill=gene))+geom_gene_arrow()+ggplot2::geom_blank(data=dummies)+ggplot2::facet_wrap(~molecule,scales="free",ncol=1)14theme_genes theme_genes A’ggplot2’theme for drawing gene mapsDescriptionThis theme removes extraneous plot elements for drawing an’arrows-on-a-string’style gene map in’ggplot2’.theme_genes_flipped()is like theme_genes(),but forflipped coordinates. Usagetheme_genes()theme_genes_flipped()DetailsThis theme removes strip text(the text that labels facets when you use ggplot2::facet_wrap()or ggplot::facet_grid()).This makes it easier to draw molecules on different x scales by setting the y aesthetic to the molecule,then faceting with facet_grid(~molecule,scales="free"). See Alsogeom_gene_arrow()Examplesggplot2::ggplot(example_genes,ggplot2::aes(xmin=start,xmax=end,y=molecule,fill=gene))+ geom_gene_arrow()+ggplot2::facet_wrap(~molecule,scales="free")+theme_genes()Index∗datasetsexample_dummies,2example_features,2example_genes,3example_dummies,2example_features,2example_genes,3example_subgenes(example_genes),3geom_feature,4geom_feature(),6geom_feature_label,5geom_feature_label(),5geom_gene_arrow,7geom_gene_arrow(),11,14geom_gene_label,8geom_gene_label(),8geom_subgene_arrow,10geom_subgene_label,11geom_subgene_label(),11make_alignment_dummies,13make_alignment_dummies(),8theme_genes,14theme_genes(),8theme_genes_flipped(theme_genes),1415。

陆地测站地面天气报告电码(GD-01Ⅲ)本电码经国家气象局批准,以国气候[1991]11号通知颁发,自1991年11月1日开始执行。
一、电码型式SYNOP0段AAXX YYGG1/(SMG)(SiG)1段IIiii i R i X hVV Nddff 1s n TTT 2s n T d T d T d3P0P0P0P0 4PPPP 5appp 6RRR1 7wwW1W28N h C L C M C H9GGgg 3段 333××0P24P24T24T241s n T X T X T X2s n T n T n T n3s n T g T g T g7R24R24R24R249S P S P s P s P二、编报总则2.1 SYNOP是世界气象组织规定的国际通用的陆地测站地面天气报告(以下简称天气报)电码名称。
报告中一律不编报此字码。
2.2本电码中除0段的YYGG、G和1段的GGgg使用世界时外,其余一律以北京时为准。
2.3本电码用来编报每日02、08、14、20时四次基本地面天气报和05、11、17、23时四次补充地面天气报。
2.4本电码共分三段,各段的指示组、编报内容和要求如下表:2.5 每次报告必须在正点后三分钟内发出。
遇有下列情况之一时,发报时间可适当顺延,但不迟于正点后六分钟内发出:(1)临近正点前出现更严重的天气现象,天气报中的有关项目需要补测改报;(2)在观测编报的时间内出现航空危险天气现象而需要优先拍发危险报。
2.6 0段2.6.1经邮电公众电路发报的测站,在基本地面天气报时次编报(SMG)组;在补充地面天气报时次编报(SiG)组。
经气象部门内部电路发报的测站不编报本段。
2.6.2指定的气象中心在编辑对外传输用的同一时次的天气报之前加报AAXX、YYGG1两组,同时删去各测站报文中的(SMG)或(SiG)组。
2.7 1段段内各组的编报规定如下表:说明:(1)表中对发报站没有作特殊说明的,表示所有测站都要编发。
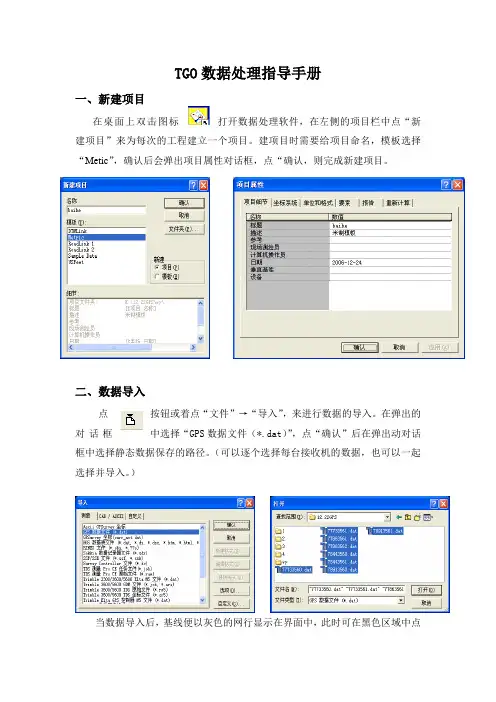
TGO数据处理指导手册一、新建项目在桌面上双击图标打开数据处理软件,在左侧的项目栏中点“新建项目”来为每次的工程建立一个项目。
建项目时需要给项目命名,模板选择“Metic”,确认后会弹出项目属性对话框,点“确认,则完成新建项目。
二、数据导入点按钮或着点“文件”→“导入”,来进行数据的导入。
在弹出的对话框中选择“GPS数据文件(*.dat)”,点“确认”后在弹出动对话框中选择静态数据保存的路径。
(可以逐个选择每台接收机的数据,也可以一起选择并导入。
)当数据导入后,基线便以灰色的网行显示在界面中,此时可在黑色区域中点右键,选择“点标记”来为测站点标注名称。
(将名称前面的勾打上)三、基线处理基线处理可分为两步:第一步:整体处理标注点名称后就进行处理。
不选择任何基线,点左侧的“处理”栏中的“处理GPS基线”或“测量”菜单下的“处理GPS基线”,都可以进行基线处理。
等基线全都处理完后,上图的“停止”按钮会自动变成“保存”,点击它对处理的基线进行保存,则第一步完成。
第一步处理完后,网中黄色的基线代表合格的,可以不用再进行处理;红色的基线代表也可以用,但是处理的不是很好;灰色的代表第一次处理没过关的基线。
(红色和灰色的基线都需要进行第二步的处理)第二步:逐条处理第一次处理完后,显示红色和灰色的基线,可以通过“禁止时间线”来进行处理。
时间线可以通过按钮或“视图”菜单下的“Timeline”展开。
展开时间线后,在黑色区域选中一条需要进行处理的基线,此时这条基线对应的时间线将以高亮度显示,展开后选择不好的“突起”或“断开”部分进行禁止,然后点“处理GPS基线”对此基线进行处理,处理完成后点“GPS基线处理报告”查看基线的“残差”,根据残差对照时间来进行时间线的精细禁止,此步可循环进行,直到基线处理成黄色即可。
(注:如果处理完基线后还是不能查看基线报告的残差图,则继续将部分目视判断不好的时间线禁止,直到可以查看报告后就根据报告开选择;然后精细处理了很多便后,基线还没有变成红色,但是“比率、参考变量、RMS”的值都超出设定值一点是,可以不必在花时间进行,因为此时已经跟合格后的基线差别不是很大了。