Parity non-conservation in nuclear excitation by circularly polarized photon beam
- 格式:pdf
- 大小:131.60 KB
- 文档页数:13

PHYSICAL REVIEW B94,241110(R)(2016)Hubbard band versus oxygen vacancy states in the correlated electron metal SrVO3S.Backes,1T.C.R¨o del,2,3F.Fortuna,2E.Frantzeskakis,2P.Le F`e vre,3F.Bertran,3M.Kobayashi,4R.Yukawa,4 T.Mitsuhashi,4M.Kitamura,4K.Horiba,4H.Kumigashira,4R.Saint-Martin,5A.Fouchet,6B.Berini,6Y.Dumont,6A.J.Kim,1F.Lechermann,7,8H.O.Jeschke,1M.J.Rozenberg,9R.Valent´ı,1,*and A.F.Santander-Syro2,†1Institut f¨u r Theoretische Physik,Goethe-Universit¨a t Frankfurt,Max-von-Laue-Strasse1,60438Frankfurt am Main,Germany 2CSNSM,Univ.Paris-Sud,CNRS/IN2P3,Universit´e Paris-Saclay,91405Orsay Cedex,France3Synchrotron SOLEIL,L’Orme des Merisiers,Saint-Aubin-BP48,91192Gif-sur-Yvette,France 4Photon Factory,Institute of Materials Structure Science,High Energy Accelerator Research Organization(KEK),1-1Oho,Tsukuba305-0801,Japan5SP2M-ICMMO-UMR-CNRS8182Universit´e Paris-Sud,Universit´e Paris-Saclay,91405Orsay Cedex,France 6GEMaC,Universit´e de Versailles St.Quentin en Y.-CNRS,Universit´e Paris-Saclay,Versailles,France7Institut f¨u r Theoretische Physik,Universit¨a t Hamburg,Jungiusstrasse9,20355Hamburg,Germany8Institut f¨u r Keramische Hochleistungswerkstoffe,TU Hamburg-Harburg,D-21073Hamburg,Germany 9Laboratoire de Physique des Solides,CNRS,Univ.Paris-Sud,Universit´e Paris-Saclay,91405Orsay Cedex,France(Received22February2016;published19December2016)We study the effect of oxygen vacancies on the electronic structure of the model strongly correlatedmetal SrVO3.By means of angle-resolved photoemission spectroscopy(ARPES)synchrotron experiments,we investigate the systematic effect of the UV dose on the measured spectra.We observe the onset of a spuriousdose-dependent prominent peak at an energy range where the lower Hubbard band has been previously reportedin this compound,raising questions on its previous interpretation.By a careful analysis of the dose-dependenteffects we succeed in disentangling the contributions coming from the oxygen vacancy states and from the lowerHubbard band.We obtain the ARPES spectrum in the limit of a negligible concentration of vacancies,wherea clear signal of a lower Hubbard band remains.We support our study by means of state-of-the-art ab initiocalculations that include correlation effects and the presence of oxygen vacancies.Our results underscore therelevance of potential spurious states affecting ARPES experiments in correlated metals,which are associatedwith the ubiquitous oxygen vacancies as extensively reported in the context of a two-dimensional electron gas atthe surface of insulating d0transition metal oxides.DOI:10.1103/PhysRevB.94.241110Introduction.A major challenge of modern physics is to understand the fascinating phenomena in strongly correlated transition metal oxides(TMOs),which emerge in the neighbor-hood of the Mott insulator state.Some preeminent examples that have gathered interest for almost30years are high temperature superconductivity,colossal magnetoresistance, heavy fermion physics,and,of course,the Mott metal-insulator transition itself[1].Significant theoretical progress was made with the introduction of dynamical meanfield theory (DMFT)and its combination with ab initio density functional methods[local density approximation(LDA)+DMFT],which allows treatment of the interactions promoting itinerancy and localization of electrons on equal footing[2–4].Among the most emblematic achievements of DMFT is the prediction of a Hubbard satellite,which separates from the conduction band of a metal.This satellite results from the partial localization of conduction electrons due to their mutual Coulomb repulsion. Early DMFT studies also showed that it is the precursor of the localized electronic states of a Mott insulator[5].Since then,these predictions promoted a large number of studies using photoemission spectroscopy,which is a technique to directly probe the presence of Hubbard bands.In this context, the TMO system SrVO3has emerged as the drosophila model system to test the predictions of strongly correlated electron *valenti@itp.uni-frankfurt.de†andres.santander@csnsm.in2p3.fr theories.In fact,SrVO3is arguably the simplest correlated metal.It is a simple cubic perovskite,with nominally one electron per V site,which occupies a threefold degenerate t2g conduction band.While the presence of a satellite in the photoemission spectra of Ni metal was already well known,in the context of correlated TMOs,the Hubbard band was originally reported in a systematic investigation of Ca1−x Sr x VO3[6],which was followed by many subsequent studies,including angle-resolved photoemission spectroscopy (ARPES)[7–9]and comparisons with theoretical predictions (see,for instance,Refs.[10–20],among others).One of the most salient features in SrVO3is the observation of a broad peak at an energy of about−1.5eV in angle integrated photoemission spectra(upper black curve in Fig.1), which is interpreted as a Hubbard satellite linked to the V t2g electrons.This feature is also seen in a large range of 3d1materials[21,22].The ratio of spectral strength between the quasiparticle(QP)state and the incoherent satellite in SrVO3is an important indicator of the magnitude of electron correlations[1,2].However,photoemission experiments using different photon energies or light brilliance have reported very dissimilar values for such a ratio[11],making the quantitative benchmarking of realistic ab initio theories for correlated electron systems difficult[6,11,18,23,24].Moreover,as shown in Fig.1,a broad peak at about the same energy is also observed in several d0TMO cubic perovskites,such as SrTiO3, KTaO3,or anatase TiO2.Nevertheless,in all these cases the feature has been clearly linked to the presence of oxygenS.BACKES et al.PHYSICAL REVIEW B94,241110(R)(2016)FIG.1.Integrated UV photoemission spectra for various per-ovskite oxides,showing a quasiparticle peak at E F and an in-gap state at energies between1and1.5eV.For SrVO3(upper black curve),a correlated-electron metal,the QP peak corresponds to the bulk conduction band,and as will be shown further,the in-gap state is a superposition of the lower Hubbard band and localized electronic states associated with oxygen vacancies.For the other d0 oxides,such as KTaO3(blue curve),anatase TiO2(green curve), or SrTiO3(red curve),the QP peak and in-gap state correspond respectively to a confined quasi-2D electron gas at the sample surface and to localized states,all formed by oxygen vacancies.The crystal orientation(normal to the samples’surface)is indicated in all cases. defects[25–32].Interestingly,recent ab initio calculations show that the spectral weight at−1.3eV in SrTiO3most likely is not of Ti t2g orbital character,but should be understood as an in-gap defect state with Ti e g character[33–36].Thus,we are confronted with the fact that at about1.5eV below the Fermi level(E F),wefind the lower Hubbard bands of d1systems as well as the in-gap states of oxygen-deficient d0systems.In view of these observations one may unavoidably wonder(and worry),despite the great success of DMFT methods,whether the putative Hubbard satellite of SrVO3might also originate from oxygen vacancy states.Moreover,one should also worry about the possibility of these extrinsic states affecting the features of the conduction band dispersion.In the present Rapid Communication we resolve these issues in a thorough manner.We present a systematic photoemission study of SrVO3,to demonstrate dramatic consequences in the spectra due to the creation of oxygen ing ARPES,we directly show that the UV or x-rays used for measurements can produce a large enhancement, of almost an order of magnitude,of the peak at−1.5eV, similar to the effect observed in d0oxide insulators[25–28,37].Despite these significant effects on the energy states around the Mott-Hubbard band,we are able to determine the bulk SrVO3photoemission spectrum in the limit of a negligible concentration of vacancies,where a clear signal of the dispersive correlated Hubbard band remains.We support the interpretation of the experimental data by means of state-of-the-art LDA+DMFT calculations on SrVO3with oxygen vacancies.Consistent with our experimental data,the calculations show that oxygen vacancies produce states(of e g symmetry)at energies near the Hubbard satellite.While our study provides definite evidence of a correlated Hubbard band in SrVO3as predicted by DMFT,it also underlines the significant effects due to oxygen vacancies,which may also affect photoemission data in other TMOs.Methods.The bulk-like relaxed,crystalline(001)oriented SrVO3thinfilms were grown by pulsed laser deposition (PLD)either at the GEMaC laboratory,then measured at the CASSIOPEE beamline of Synchrotron SOLEIL,or in a PLD chamber directly connected to the ARPES setup at beamline2A of KEK-Photon Factory(KEK-PF)[9,38,39]. To clean the surfaces in UHV prior to ARPES experiments at SOLEIL,the SrVO3thinfilms were annealed at550◦C for t=5–20min at pressures lower than2×10−8Torr.At KEK-PF,the PLD growth was performed under a pressure below10−7Torr,to obtain UHV-clean surfaces,using a Sr2V2O7target,which has excess oxygen with respect to SrVO3,thus minimizing the formation of vacancies during the growth.In all cases,the surface quality was confirmed right before ARPES measurements by low-energy electron diffraction(LEED).The thinfilms measured at KEK-PF showed a c(4×4)surface reconstruction,which does not affect the analysis and conclusions of this work.For the ARPES measurements we used linearly polarized photons in the energy range30–110eV and hemispherical electron analyzers with vertical slits at SOLEIL and horizontal slits at KEK-PF.The angular and energy resolutions were0.25◦and 15meV.The mean diameter of the incident photon beam was smaller than100μm.The UV light brilliance,measured using calibrated photodiodes,was≈5×10⁹photons s−1μm−2at SOLEIL,and about100times smaller at KEK-PF.The samples were cooled down to T=20K before measuring.Unless specified otherwise,all data were taken at that temperature. The results were reproduced on more thanfive samples.All through this Rapid Communication,directions and planes are defined in the cubic unit cell of SrVO3.We denote [hkl]the crystallographic directions in real space, hkl the corresponding directions in reciprocal space,and(hkl)the planes orthogonal to those directions.The indices h,k,and l of hkl correspond to the reciprocal lattice vectors of the cubic unit cell of SrVO3.The Supplemental Material[40]presents further details about the sample growth and measurements.Experimental results.Figure2(a)shows the integrated photoemission spectra of SrVO3as a function of the UV dose, measured at CASSIOPEE SOLEIL under the same conditions of light brilliance of any standard ARPES experiment at a third-generation synchrotron.The measurements were done by continuously irradiating the sample with hν=33eV photons while recording the spectra as a function of irradiation time, with an accumulation time of about2min per spectrum.The blue and black curves show spectra for the lowest and highest measured doses,obtained respectively after∼2min and∼2h of irradiation.These data clearly demonstrate that the very UV or x-rays used for photoemission experiments can produce radical changes in the measured spectra of SrVO3.Note in fact that a similar effect has been observed for VO2[41].In particular,from Fig.2(a)we observe that the amplitude ofHUBBARD BAND VERSUS OXYGEN V ACANCY STATES IN THE...PHYSICAL REVIEW B94,241110(R)(2016)FIG.2.(a)Photoemission spectra of SrVO3as a function of UV dose,measured at Synchrotron SOLEIL(hν=33eV).The energy distribution curves(EDCs)were extracted from raw ARPES data around the 002point integrated along the k= 010 direction.(b)Corresponding momentum distribution curves(MDCs)integrated over50meV below E F.Peaks in the MDCs indicate the Fermi momenta.(c),(d)Same as(a),(b)for SrTiO3(hν=47eV).Thefilling of a2DEG upon UV irradiation is evidenced by the formation of QP peaks in the EDCs and MDCs at E F[inset of(c)and(d),respectively].All data were taken at20K.the in-gap state at−1.5eV,and,more significantly,the ratio of in-gap to quasiparticle(QP)amplitudes,strongly increase with increasing UV dose,going from about1:3in a pristine sample to more than2:1in a heavily irradiated sample. Importantly,note that the QP peak position remains basically dose independent,implying that the carriers created by the UV or x irradiation do not significantly dope the conduction band,and form dominantly localized states.This is confirmed in Fig.2(b),which shows that the Fermi momenta of the QP band,given by the peak positions in the momentum distribution curves(MDCs)at E F,are also dose independent. Additional data presented in the Supplemental Material further demonstrate that our measurements yield the expected3D bulk Fermi surface of SrVO3.Thus,the observed increase in intensity of the in-gap state upon UV irradiation cannot be ascribed to a change infilling of the conduction band,which could have affected the electron correlations.Instead,this unambiguously shows the light-assisted formation of localized defect states at essentially the same energy as that of the expected intrinsic lower Hubbard band—which should then resemble the in-gap peak observed at the lowest UV doses.In fact,as mentioned previously,it is well established that strong doses of UV or x-rays create a large concentration of oxygen vacancies in several d0perovskites[25–32,42]. As illustrated in Figs.2(c)and2(d)for the case of SrTiO3, the progressive doping of the surface region with oxygen vacancies,due to synchrotron UV irradiation,has two effects: the formation of a very intense in-gap state at about−1.3eV, and,in contrast to SrVO3,the simultaneous creation of a sharp QP peak at E F corresponding to a confined quasi-2D electron gas(2DEG)at the samples’surface.The effective mass of such2DEG,precisely determined by ARPES,matches the mass expected from density functional theory calcula-tions[25,26,43,44].Thus,as in SrVO3,the increase in intensityof the in-gap state observed in SrTiO3upon UV or x irradiationcannot be due to an onset or increase of electron correlations,and should be ascribed to an extrinsic effect.We therefore conclude that,in SrVO3,exposure to syn-chrotron UV or x-rays creates oxygen vacancies,which are inturn responsible for the extrinsic increase in intensity of thein-gap state evidenced by our measurements.This effect canseriously obscure the determination of the spectral function ofthis model system,thus hampering the advancement of validtheories for correlated electron systems.Thefindings described above imply that the correct ex-perimental determination of the vacancy-free photoemissionspectrum of SrVO3should(i)use samples that from thebeginning have the lowest possible concentration of oxygenvacancies,and(ii)use doses of UV or x-ray light low enoughto avoid light-induced changes in the measured spectra.Tothis end,we measured SrVO3thinfilms grown directly insitu at beamline2A of KEK-PF.As mentioned before,the growth protocol of such thinfilms minimizes the formationof vacancies,while the UV light brilliance at KEK-PF is ∼100times smaller than the one in Figs.2(a)and2(b)from measurements at SOLEIL.We checked(see the SupplementalMaterial)that under these conditions the spectra did notchange with time,even after several hours of measurements.The resulting energy-momentum ARPES map,and its secondderivative,are presented in Figs.3(a)and3(b).One clearlyobserves the dispersing QP band along with an also dispersivein-gap state of weaker intensity,corresponding to the intrinsiclower Hubbard band,as reported in previous works[7].Theintrinsic spectral function of SrVO3will then be given by such aphotoemission spectrum,which approaches the vacancy-freelimit,modulo dipole-transition matrix elements,inherent toS.BACKES et al.PHYSICAL REVIEW B94,241110(R)(2016)FIG.3.(a)Energy-momentum ARPES intensity map measured at KEK-PF with a low UV dose on a SrVO3sample prepared in situ,using a well-established protocol to minimize the formation of oxygen vacancies(see the main text and Supplemental Material).Note that due to the choice of light polarization,the heavy bands along(100)are not observed and only the contribution of the light d xy band is detected.The data were acquired at hν=88eV around ¯103.(b)Second derivative(negative values)of the map in(a).The use of second derivatives allows a better visualization of the dispersion of both the quasiparticle and Mott-Hubbard bands on the same color plot.The dispersionless feature at E F is a spurious effect of such a second derivative on the Fermi-Dirac cutoff.(c),(d)Same as(a),(b)after a strong UV irradiation dose,measured at SOLEIL(hν=33eV),typical of modern third-generation synchrotrons.The measurements were done at hν=33eV close to 002.All data were taken at20K.Note that at constant photon energy,ARPES maps out the electronic structure at a spherical surface of three-dimensional (3D)k space,which can be locally approximated to a plane for all our measurements(details in the Supplemental Material).The different choice of photon energies and k-space positions for measurements at KEK-PF[(a)and(b)]and SOLEIL[(c)and(d)]was dictated by the different geometrical configurations and constraints of the beamlines in both synchrotrons.the photoemission process,which can still modulate the intensity of the QP peak relative to the Hubbard peak.A calculation of such matrix elements requires a full one-step calculation of the photoemission process,which is beyond the scope of this work.By contrast,Figs.3(c)and3(d) show the momentum-resolved electronic structure of a sample, measured at SOLEIL,that was intensively irradiated.There, the peak at−1.5eV becomes broader,more intense,and nondispersive—all characteristic signatures of a high random concentration of oxygen vacancies.Numerical calculations.To rationalize from a microscopic point of view the influence of oxygen vacancies on the electronic structure of SrVO3,we performed charge self-consistent LDA+DMFT calculations for bulk SrVO3and var-ious relaxed oxygen-deficient SrVO3supercells.The latter are computationally demanding calculations.We shall focus here on the case of a2×2×3supercell with two oxygen vacancies located at opposite apical sites of one vanadium atom,as shown in the inset of Fig.4(b).We use such a vacancy arrangement as it is the prototypical one for d0compounds[43].For our LDA+DMFT calculations we chose values of U= 2.5eV and J=0.6eV for vanadium and included the effects of bandwidth renormalization due to dynamically screened Coulomb interactions by following the prescription suggested in Ref.[45](the LDA+DMFT unrenormalized data are shown in the Supplemental Material).In Figs.4(a)and4(c)we show, respectively,the results of the k-integrated and k-resolved spectral functions for bulk SrVO3without oxygen vacancies. Wefind the expected features of a t2g quasiparticle peak at the Fermi level and a lower Hubbard band at negative energies of the same t2g nature,in agreement with the photoemission spectra in Fig.2(a)and Figs.3(a)and3(b).The light band at E F along k 100 [Fig.4(c)]consists of two degenerate bands of d xy and d xz characters,while the heavy band along the same direction has d yz character.While comparing with the measured k-resolved spectral function[Figs.3(a)and3(b)],HUBBARD BAND VERSUS OXYGEN V ACANCY STATES IN THE...PHYSICAL REVIEW B94,241110(R)(2016)FIG.4.LDA+DMFT results for SrVO3including bandwidth renormalization effects[45].(a)k-integrated spectral function for bulk SrVO3.The V t2g orbitals show a quasiparticle peak at E F and a lower Hubbard band at−1.6eV.(b)Spectral function for the2×2×3supercell of SrVO3with two oxygen vacancies.An additional nondispersive V e g vacancy state originating from the V atom neighboring the oxygen vacancies leads to a sharp peak below the Fermi level at∼−1.0eV.The V t2g orbitals show a quasiparticle peak at E F and a lower Hubbard band at−1.8eV.(c)and(d)show the corresponding spectral functions(multiplied by a Fermi-Dirac function at20K)along the X- -X path.one should bear in mind that along -X(or -Y)the heavy d yz(or d xz)bands are silenced by dipole-transition selection rules in the experiment[25].Inclusion of bandwidth renormalization[45]renders the lower Hubbard band at an energy(−1.6eV)in reasonable agreement with experiment (−1.5eV).We adopted typical values for U and J from the literature.We did not attempt to further optimize the values to get a better quantitative agreement with the experimental data, for two reasons:First is the heavy numerical cost,and second, as we show next in the calculations with oxygen vacancies, the adopted values facilitate the distinct visualization of the contributions from the Hubbard and localized states to the incoherent peak at∼−1.5eV.The removal of oxygen atoms in the system leads to the donation of two electrons per oxygen to its surrounding. Already at the level of density functional theory(DFT)in the local density approximation(LDA)(see the Supplemental Material),wefind that most of the charge coming from the additional electrons is transferred to the3d z2orbitals of the neighboring V atom,developing into a sharp peak of e g symmetry located around−1.0eV,i.e.,at an energy close to the position of the experimentally observed oxygen vacancy states.In analogy to the experimental average over many lattice sites,note that averaging among various supercells with differentoxygen vacancy locations and concentrations(which is beyondthe scope of the present work)would result in a wider in-gape g band,as demonstrated for the case of SrTiO3(see Fig.3ofRef.[34])and for some cases in SrVO3(see the SupplementalMaterial,Fig.S7).By including electronic correlations within(bandwidth renormalized)LDA+DMFT we then see that allthe experimental observations qualitatively emerge.In fact,the conducting t2g orbitals develop a lower Hubbard bandpeaked at energies about−1.8eV[Figs.4(b)and4(d)],similarto the bulk case without oxygen vacancies.Most notably,this lower Hubbard satellite does not increase in amplitudewith the introduction of vacancies,but rather broadens.Inaddition,the oxygen vacancy defect states situated at about −1eV remain qualitatively unchanged by the correlation effects,but experience a broadening with respect to the pureLDA case.This is in agreement with the photoemission data,evidencing that the increase in intensity of the in-gap statein the oxygen-deficient SrVO3is not to be attributed to anincrease in population of the lower Hubbard satellite,butinstead to the manifestation of vacancy states of e g character.Conclusions.In summary,we performed a detailed study of the effects of oxygen vacancies in the spectroscopy of the archetypal strongly correlated electron system SrVO3.We found that oxygen vacancy states,which are created by UV or x-ray irradiation,occur at energies close to the Hubbard satellite.This dramatically affects the measured line shape of the Mott-Hubbard band and the ratio of intensities between the quasiparticle and the Mott-Hubbard peaks.By means of a systematic study under a controlled irradiation dose, using samples directly grown in situ,we were able to obtain the photoemission spectrum of the bulk SrVO3system in the limit of a negligible concentration of oxygen vacancies. Our experimental interpretation is supported by LDA+DMFT calculations,which provided further insight into the likely nature of the oxygen vacancy states.Acknowledgments.We thank Silke Biermann,Ralph Claessen,Marc Gabay,and Michael Sing for discussions. This work was supported by public grants from the French National Research Agency(ANR),project LACUNES No. ANR-13-BS04-0006-01,and the“Laboratoire d’Excellence Physique Atomes Lumi`e re Mati`e re”(LabEx PALM project ELECTROX)overseen by the ANR as part of the“Investisse-ments d’Avenir”program(reference:ANR-10-LABX-0039). S.B.,A.J.K.,F.L.,H.O.J.,and R.V.gratefully acknowledge the Deutsche Forschungsgemeinschaft forfinancial support through Grant FOR1346.T.C.R.acknowledges funding from the RTRA–Triangle de la Physique(project PEGASOS).A.F.S.-S.is thankful for support from the Institut Universitairede France.S.B.and T.C.R.contributed equally to this work.[1]M.Imada,A.Fujimori,and Y.Tokura,Metal-insulator transi-tions,Rev.Mod.Phys.70,1039(1998).[2]A.Georges,G.Kotliar,W.Krauth,and M.J.Rozenberg,Dynamical meanfield theory of strongly correlated electronsS.BACKES et al.PHYSICAL REVIEW B94,241110(R)(2016)and the limit of infinite dimensions,Rev.Mod.Phys.68,13 (1996).[3]G.Kotliar and D.V ollhardt,Strongly correlated materials:Insights from dynamical mean-field theory,Phys.Today57(3), 53(2004).[4]G.Kotliar,S.Y.Savrasov,K.Haule,V.S.Oudovenko,O.Parcollet,and C.A.Marianetti,Electronic structure calculations with dynamical mean-field theory,Rev.Mod.Phys.78,865 (2006).[5]X.Y.Zhang,M.J.Rozenberg,and G.Kotliar,Mott Transitionin the d=∞Hubbard Model at Zero Temperature,Phys.Rev.Lett.70,1666(1993).[6]I.H.Inoue,I.Hase,Y.Aiura,A.Fujimori,Y.Haruyama,T.Maruyama,and Y.Nishihara,Systematic Development of the Spectral Function in the3d1Mott-Hubbard System Ca1−x Sr x VO3,Phys.Rev.Lett.74,2539(1995).[7]M.Takizawa,M.Minohara,H.Kumigashira,D.Toyota,M.Oshima,H.Wadati,T.Yoshida,A.Fujimori,M.Lippmaa,M.Kawasaki,H.Koinuma,G.Sordi,and M.Rozenberg,Coherent and incoherent d band dispersions in SrVO3,Phys.Rev.B80, 235104(2009).[8]T.Yoshida,M.Hashimoto,T.Takizawa,A.Fujimori,M.Kubota,K.Ono,and H.Eisaki,Mass renormalization in the bandwidth-controlled Mott-Hubbard systems SrVO3and CaVO3studied by angle-resolved photoemission spectroscopy,Phys.Rev.B 82,085119(2010).[9]S.Aizaki,T.Yoshida,K.Yoshimatsu,M.Takizawa,M.Minohara,S.Ideta,A.Fujimori,K.Gupta,P.Mahadevan,K.Horiba,H.Kumigashira,and M.Oshima,Self-Energy on the Low-to High-Energy Electronic Structure of Correlated Metal SrVO3,Phys.Rev.Lett.109,056401(2012).[10]M.J.Rozenberg,I.Inoue,H.Makino,F.Iga,and Y.Nishihara,Low Frequency Spectroscopy of the Correlated Metallic System Ca1−x Sr x VO3,Phys.Rev.Lett.76,4781(1996).[11]A.Sekiyama,H.Fujiwara,S.Imada,S.Suga,H.Eisaki,S.I.Uchida,K.Takegahara,H.Harima,Y.Saitoh,I. A.Nekrasov,G.Keller,D.E.Kondakov,A.V.Kozhevnikov,Th.Pruschke,K.Held,D.V ollhardt,and V.I.Anisimov,Mutual Experimental and Theoretical Validation of Bulk Photoemis-sion Spectra of Sr1−x Ca x VO3,Phys.Rev.Lett.93,156402 (2004).[12]E.Pavarini,S.Biermann,A.Poteryaev,A.I.Lichtenstein,A.Georges,and O.K.Andersen,Mott Transition and Suppression of Orbital Fluctuations in Orthorhombic3d1Perovskites,Phys.Rev.Lett.92,176403(2004).[13]B.Amadon,F.Lechermann,A.Georges,F.Jollet,T.O.Wehling,and A.I.Lichtenstein,Plane-wave based electronic structure calculations for correlated materials using dynamical mean-field theory and projected local orbitals,Phys.Rev.B77,205112 (2008).[14]M.Aichhorn,L.Pourovskii,V.Vildosola,M.Ferrero,O.Parcollet,T.Miyake,A.Georges,and S.Biermann,Dynamical mean-field theory within an augmented plane-wave framework: Assessing electronic correlations in the iron pnictide LaFeAsO, Phys.Rev.B80,085101(2009).[15]M.Karolak,T.O.Wehling, F.Lechermann,and A.I.Lichtenstein,General DFT++method implemented with pro-jector augmented waves:Electronic structure of SrVO3and the Mott transition in Ca2−x Sr x RuO4,J.Phys.:Condens.Matter23, 085601(2011).[16]H.Lee,K.Foyevtsova,J.Ferber,M.Aichhorn,H.O.Jeschke,and R.Valent´ı,Dynamical cluster approximation within an aug-mented plane wave framework:Spectral properties of SrVO3, Phys.Rev.B85,165103(2012).[17]J.M.Tomczak,M.Casula,T.Miyake, F.Aryasetiawan,and S.Biermann,Combined GW and dynamical mean-field theory:Dynamical screening effects in transition metal oxides, Europhys.Lett.100,67001(2012).[18]C.Taranto,M.Kaltak,N.Parragh,G.Sangiovanni,G.Kresse,A.Toschi,and K.Held,Comparing quasiparticle GW+DMFTand LDA+DMFT for the test bed material SrVO3,Phys.Rev.B 88,165119(2013).[19]J.M.Tomczak,M.Casula,T.Miyake,and S.Biermann,Asymmetry in band widening and quasiparticle lifetimes in SrVO3:Competition between screened exchange and local correlations from combined GW and dynamical mean-field theory GW+DMFT,Phys.Rev.B90,165138(2014).[20]A.van Roekeghem and S.Biermann,Screened exchangedynamical meanfield theory and its relation to density functional theory:SrVO3and SrTiO3,Europhys.Lett.108,57003(2014).[21]A.Fujimori,I.Hase,H.Namatame,Y.Fujishima,Y.Tokura,H.Eisaki,S.Uchida,K.Takegahara,and F.M.F.de Groot,Evolution of the Spectral Function in Mott-Hubbard Systems with d1Configuration,Phys.Rev.Lett.69,1796(1992). [22]K.Morikawa,T.Mizokawa,A.Fujimori,Y.Taguchi,andY.Tokura,Photoemission spectral weight distribution in Y1−x Ca x TiO3,Phys.Rev.B54,8446(1996).[23]I.A.Nekrasov,G.Keller,D.E.Kondakov,A.V.Kozhevnikov,Th.Pruschke,K.Held, D.V ollhardt,and V.I.Anisimov, Comparative study of correlation effects in CaVO3and SrVO3, Phys.Rev.B72,155106(2005).[24]R.Eguchi,T.Kiss,S.Tsuda,T.Shimojima,T.Mizokami,T.Yokoya,A.Chainani,S.Shin,I.H.Inoue,T.Togashi,S.Watanabe,C.Q.Zhang,C.T.Chen,M.Arita,K.Shimada,H.Namatame,and M.Taniguchi,Bulk-and Surface-SensitiveHigh-Resolution Photoemission Study of Two Mott-Hubbard Systems:SrVO3and CaVO3,Phys.Rev.Lett.96,076402 (2006).[25]A.F.Santander-Syro,O.Copie,T.Kondo,F.Fortuna,S.Pailh`e s,R.Weht,X.G.Qiu,F.Bertran,A.Nicolaou,A.Taleb-Ibrahimi, P.Le F`e vre,G.Herranz,M.Bibes,N.Reyren,Y.Apertet,P.Lecoeur,A.Barth´e l´e my,and M.J.Rozenberg,Two-dimensional electron gas with universal subbands at the surface of SrTiO3, Nature(London)469,189(2011).[26]W.Meevasana,P.D.C.King,R.H.He,S.-K.Mo,M.Hashimoto,A.Tamai,P.Songsiriritthigul,F.Baumberger,and Z.-X.Shen,Creation and control of a two-dimensional electron liquid at the bare SrTiO3surface,Nat.Mater.10,114(2011).[27]P.D.C.King,R.H.He,T.Eknapakul,P.Buaphet,S.-K.Mo,Y.Kaneko,S.Harashima,Y.Hikita,M.S.Bahramy,C.Bell,Z.Hussain,Y.Tokura,Z.-X.Shen,H.Y.Hwang,F.Baumberger, and W.Meevasana,Subband Structure of a Two-Dimensional Electron Gas Formed at the Polar Surface of the Strong Spin-Orbit Perovskite KTaO3,Phys.Rev.Lett.108,117602 (2012).[28]T.C.R¨o del,F.Fortuna,F.Bertran,M.Gabay,M.J.Rozenberg,A.F.Santander-Syro,and P.Le F`e vre,Engineering of two-dimensional electron gases at the(001)and(101)surfaces of TiO2anatase using light,Phys.Rev.B92,041106(R) (2015).。


1/4波片quarter-wave plateCG矢量耦合系数Clebsch-Gordan vector coupling coefficient; 简称“CG[矢耦]系数”。
X射线摄谱仪X-ray spectrographX射线衍射X-ray diffractionX射线衍射仪X-ray diffractometer[玻耳兹曼]H定理[Boltzmann] H-theorem[玻耳兹曼]H函数[Boltzmann] H-function[彻]体力body force[冲]击波shock wave[冲]击波前shock front[狄拉克]δ函数[Dirac] δ-function[第二类]拉格朗日方程Lagrange equation[电]极化强度[electric] polarization[反射]镜mirror[光]谱线spectral line[光]谱仪spectrometer[光]照度illuminance[光学]测角计[optical] goniometer[核]同质异能素[nuclear] isomer[化学]平衡常量[chemical] equilibrium constant[基]元电荷elementary charge[激光]散斑speckle[吉布斯]相律[Gibbs] phase rule[可]变形体deformable body[克劳修斯-]克拉珀龙方程[Clausius-] Clapeyron equation[量子]态[quantum] state[麦克斯韦-]玻耳兹曼分布[Maxwell-]Boltzmann distribution[麦克斯韦-]玻耳兹曼统计法[Maxwell-]Boltzmann statistics[普适]气体常量[universal] gas constant[气]泡室bubble chamber[热]对流[heat] convection[热力学]过程[thermodynamic] process[热力学]力[thermodynamic] force[热力学]流[thermodynamic] flux[热力学]循环[thermodynamic] cycle[事件]间隔interval of events[微观粒子]全同性原理identity principle [of microparticles][物]态参量state parameter, state property[相]互作用interaction[相]互作用绘景interaction picture[相]互作用能interaction energy[旋光]糖量计saccharimeter[指]北极north pole, N pole[指]南极south pole, S pole[主]光轴[principal] optical axis[转动]瞬心instantaneous centre [of rotation][转动]瞬轴instantaneous axis [of rotation]t 分布student's t distributiont 检验student's t testK俘获K-captureS矩阵S-matrixWKB近似WKB approximationX射线X-rayΓ空间Γ-spaceα粒子α-particleα射线α-rayα衰变α-decayβ射线β-rayβ衰变β-decayγ矩阵γ-matrixγ射线γ-rayγ衰变γ-decayλ相变λ-transitionμ空间μ-spaceχ 分布chi square distributionχ 检验chi square test阿贝不变量Abbe invariant阿贝成象原理Abbe principle of image formation阿贝折射计Abbe refractometer阿贝正弦条件Abbe sine condition阿伏伽德罗常量Avogadro constant阿伏伽德罗定律Avogadro law阿基米德原理Archimedes principle阿特伍德机Atwood machine艾里斑Airy disk爱因斯坦-斯莫卢霍夫斯基理论Einstein-Smoluchowski theory 爱因斯坦场方程Einstein field equation爱因斯坦等效原理Einstein equivalence principle爱因斯坦关系Einstein relation爱因斯坦求和约定Einstein summation convention爱因斯坦同步Einstein synchronization爱因斯坦系数Einstein coefficient安[培]匝数ampere-turns安培[分子电流]假说Ampere hypothesis安培定律Ampere law安培环路定理Ampere circuital theorem安培计ammeter安培力Ampere force安培天平Ampere balance昂萨格倒易关系Onsager reciprocal relation凹面光栅concave grating凹面镜concave mirror凹透镜concave lens奥温电桥Owen bridge巴比涅补偿器Babinet compensator巴耳末系Balmer series白光white light摆pendulum板极plate伴线satellite line半波片halfwave plate半波损失half-wave loss半波天线half-wave antenna半导体semiconductor半导体激光器semiconductor laser半衰期half life period半透[明]膜semi-transparent film半影penumbra半周期带half-period zone傍轴近似paraxial approximation傍轴区paraxial region傍轴条件paraxial condition薄膜干涉film interference薄膜光学film optics薄透镜thin lens保守力conservative force保守系conservative system饱和saturation饱和磁化强度saturation magnetization本底background本体瞬心迹polhode本影umbra本征函数eigenfunction本征频率eigenfrequency本征矢[量] eigenvector本征振荡eigen oscillation本征振动eigenvibration本征值eigenvalue本征值方程eigenvalue equation比长仪comparator比荷specific charge; 又称“荷质比(charge-mass ratio)”。
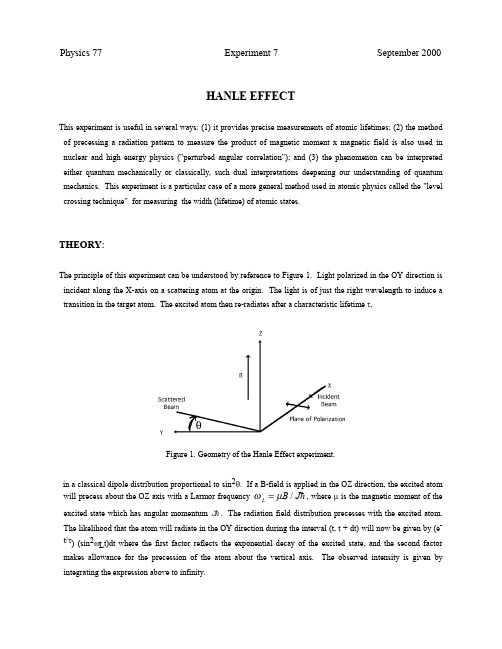
Physics 77 Experiment 7 September 2000HANLE EFFECTThis experiment is useful in several ways: (1) it provides precise measurements of atomic lifetimes; (2) the method of precessing a radiation pattern to measure the product of magnetic moment x magnetic field is also used in nuclear and high energy physics ("perturbed angular correlation"); and (3) the phenomenon can be interpreted either quantum mechanically or classically, such dual interpretations deepening our understanding of quantum mechanics. This experiment is a particular case of a more general method used in atomic physics called the "level crossing technique" for measuring the width (lifetime) of atomic states.THEORY:The principle of this experiment can be understood by reference to Figure 1. Light polarized in the OY direction is incident along the X-axis on a scattering atom at the origin. The light is of just the right wavelength to induce a transition in the target atom. The excited atom then re-radiates after a characteristic lifetime τ,θFigure 1. Geometry of the Hanle Effect experiment.in a classical dipole distribution proportional to sin2θ. If a B-field is applied in the OZ direction, the excited atomwill precess about the OZ axis with a Larmor frequency ωµL B J=/!, where µ is the magnetic moment of the excited state which has angular momentum J!. The radiation field distribution precesses with the excited atom. The likelihood that the atom will radiate in the OY direction during the interval (t, t + dt) will now be given by (e-t/τ) (sin2ωL t)dt where the first factor reflects the exponential decay of the excited state, and the second factor makes allowance for the precession of the atom about the vertical axis. The observed intensity is given by integrating the expression above to infinity.Radiation observed along 0Y;e tdt t L L −∞=+z /sin ()τωτωτ220214(1)A plot of the intensity observed along the OY axis, as a function of B, has its minimum value atB (or ωL ) = 0, with an increase to one-half of its asymptotic value at ωL t = 1/2 or:B g J 1202/=!µτ(2)where µ0 is the Bohr magneton and g J is the electronic g factor for the excited state. The mean life τ can be determined from B l/2 if µ is known (µ=g J µ0J). These measurements always detect the product µτ and one must have additional information to get individual values of τ and µ. We will calculate the value of µ on the assumption that the state is described approximately by ""L S • coupling, in which case:g S S L L J J J =++−++321121()()()(3)See the Optical Pumping writeup (Experiment 8) for the derivation. [The Lurio paper expression for I(τ) isincorrect. The correct expression is discussed by V. Leyva in the Hanle Effect Experiment Reference binder.]Figure 2. Term Diagram for Mercury (Hg).THE EXPERIMENTThe optical system consists of a source arm and an orthogonal detector arm. The source arm contains a low-pressure mercury discharge lamp, a quartz collimating lens, and a UV-transmitting polarizing filter. The absorption/scattering cell is located at the intersection of the optical axes of the two arms. The detector arm contains a second UV-polarizing filter, a quartz lens to focus scattered light onto a detector, an interference bandpass filter centered on 253.7 nm (15.0 nm FWHM), and a UV-sensitive photomultiplier. Polarizing filters that function efficiently at the short UV wavelengths are used (ordinary "Polaroid" filters are totally opaque at UV wavelengths.) in both the lamp and detector arms. The description above of the principle of the experiment leaves out details such as incident line shape, trapping, collision broadening, etc. The reprint by de Zafra describes these complications and the analysis of results. The Franken and Happer papers go further into the theory.Figure 3. Experimental setup for the Hanle Effect experiment.INSTRUMENTATION AND APPARATUSLAMP:The lamp consists of a pair of electrodes sealed into a synthetic quartz capillary that is folded into a hairpin shape. It is filled with natural abundance Hg at a low pressure (~1 atmosphere at operating temperature). An ideal light source would emit a spectrum that exhibits the natural width of the upper radiating 3P1 state. (See the term diagram Figure 2.) However, if there are unexcited Hg atoms in the 1S0 ground state, populating the hollow sheath surrounding the excited cylindrical core of the radiating source, these unexcited atoms will absorb some of the emitted radiation. If the absorbing atoms are cold, and the radiating atoms hot (the usual situation since the temperature will decrease from the centerline to the lamp wall), the spectral line emitted from the hot atoms is wider than the absorption line of the cooler atoms, and what escapes from the source has a dip in the middle. This phenomenon is called self-reversal. We can minimize this problem by running the source as cool as possible (by reducing the operating voltage). That action has the further benefit of reducing Doppler broadening by keeping the internal lamp pressure from rising excessively. Caution: The Hg lamp emits 95% of its energy in the 253.7 nm line. Don't look directly at the bare lamp for extended periods of time without eyeglasses. It also produces copious quantities of O3 (ozone) when operated in open air. It is mounted in a closed housing to completely shield the UV from the user and minimize the production of O3.ABSORPTION/SCATTERING CELL:The absorption cell, constructed from UV transmitting synthetic quartz, is known as a Wood's Horn. It is entirely covered with a black light-absorbing coating except for the entrance and exit windows. The shape, plus coating, insures a minimum of internal reflections so that incident light will encounter the resident Hg atoms only once before reflections alter its plane of polarization. Isotopically pure 198Hg has been used for the absorption/scattering material, unlike the lamp which is filled with natural-abundance Hg (10% 198Hg).DETECTOR:The detector (SSR Quantum Photometer) consists of a UV-sensitive photomultiplier (PMT), a high voltage power supply, and a count-rate meter/nano-ammeter. The operating voltage for the 1P28 PMT has been carefully adjusted to produce the maximum gain at minimum noise (i.e., the optimum signal-to-noise ratio), and is not altered by the user. The count-rate meter mode is used for very low intensities (<108 cps), while the nano-Ammeter (nA) mode (normally used) extends measurement capability to higher intensities. The nA mode allows selection of severalcompromise between low statistical uncertainty and realistic response time. An adjustable zero offset is also available that allows easy examination of a small percentage change in signal strength. The UV interference filter installed at the PMT entrance window passes only the wavelength of interest, substantially improving the signal-to-noise ratio of the system, while insuring that room lighting will neither damage the PMT photocathode nor seriously influence the intensity data.FIELD COMPENSATION COIL SETS 1 & 2:It is necessary to cancel out the ambient magnetic field at the Hg cell. This is accomplished with two pairs of rectangular coils (Sets 1 & 2), in the Helmholtz configuration, driven by two independently adjustable power supplies. Careful positioning of the plane of one pair normal to the horizontal component of the ambient field (rotating the entire experiment on the table), allows the use of only two pairs of coils instead of three. The two power supplies are operated in their Constant Voltage mode, since the current required is too small for sensitive current adjustment or regulation when the supply is in the Constant Current mode..MAGNETOMETER:An air-driven magnetometer is used for the adjustment of the currents through the field-canceling coils. This is a sphere of copper [Oxygen-Free High-Conductivity (OFHC) grade], supported on non-magnetic copper-beryllium ball bearings and rotated about its axis by two jets of air. A central hole has been drilled through the rotor at right angles to the axis of rotation. Two 10,000 turn coils, connected in series-aiding, closely surround the rotor. When the Cu sphere rotates, it is a single turn that cuts any magnetic field lines that may be present. Large eddy currents are induced in the low-resistance single turn which then induce a signal in the fixed coils. It is this signal that is displayed on the Oscilloscope (CRO). The ball bearings are not as hard or durable as ordinary hardened steel (magnetic) ball bearings, which limits the speed of rotation to <600 rps, i.e., a driving air pressure of less than 2-3 psi. The Tektronix 503 CRO is operated in the Differential Input mode to suppress rather large common-mode signals at line frequency and its harmonics.HELMHOLTZ COIL SET 3:A known magnetic field can be applied to the scattering cell by means of a third set of coils (Set 3), a circular pair, also in the Helmholtz configuration. A stable regulated power supply (in Constant-Current mode), a reversing switch, and a digital Ammeter complete this system. The field conversion factor for this pair is 1.87 Gauss/Ampere.DATA ANALYSIS:The laboratory PCs contain useful programs for analyzing the data from this experiment. Math CAD and FFIT are available, and Curvefit (Mathematica) and FFIT are quite capable of fitting a Lorentzian.PRELAB EXERCISE1. Read the de Zafra paper to understand the principles of the experiment.2. Estimate B l/2 for the 3P l state of Hg (τ = ~10-7 sec [See TASK 7.]) for the current geometry. How does this compare to the earth's magnetic field and any stray fields expected in the laboratory?EXPERIMENTAL TASKS:1. Replace the Hg cell with the Vantson magnetometer by rotating the support. A manual describing the magnetometer is available. In essence, it is a generator with output voltage:V peak to peak x B T V S Gauss ().,−−=−⋅286104c h (4)where T is the period of the AC output of the generator. Drive the magnetometer with compressed air at about 2-3psi pressure. Trigger the CRO from the 60 Hz LINE and "tweak" the rotor speed (air pressure) to obtain a stable display at a precise harmonic of 60 Hz. Adjust the currents in the horizontal and vertical bucking coils to minimize the output voltage when the magnetometer axis is oriented properly. The axis of rotation is perpendicular to the disk containing the air inlet and output connector. A small AC field will persist and cannot be canceled with the present arrangement. What is the source of this field? What is the minimum DC field you can produce at the absorption cell? What are the magnitudes of the two components of the ambient DC magnetic field? Record the voltage settings for the two bucking coils and keep them constant for the duration of the experiment.2. Familiarize yourself with the operation of the photometer. A separate manual on the SSR photometer is available.3. Turn on the Hg lamp, beginning with a Variac voltage of 100 V. If the lamp starts to flicker, increase the voltage slightly (1-2 V) until the flicker stops. Wait 15-20 minutes for equilibrium to be reached. The lamp should be run at a voltage that is low enough to produce narrow emission lines without flicker, but high enough (<105 V) to give a good signal-to-noise ratio.4. Adjust the magnetic field produced by the Helmholtz coils (Set #3) to find the minimum and maximum photometer readings. Set the magnetic field such that photometer reads halfway between minimum and maximumvalues and check the peak symmetry when the field is reversed. If asymmetry is more than a few percent, and if the earth's magnetic field has been properly minimized, the polarizer(s) probably needs adjustment. Ask instructor for help.5. Measure and plot the yield of photons scattered at 90° as a function of B (vertical) produced by the Set #3 Helmholtz coils. Repeat the measurements enough to make certain that lamp intensity and scattering cell temperature are not drifting rapidly with time. Even if you have evidence of a slow time dependence, you can make an accurate measure of the half-width of the current dip by measuring the depth of the dip and then setting the current quickly to give a signal at half the full magnitude. Reverse the current to see whether the dip is symmetrical about B vert = 0.6. Repeat step (5) when the tip of the cell is placed in cool water from a refrigerated water cooler. Ice water, or colder baths, will be too cold, reducing the Hg vapor pressure in the absorption cell to a level too low to produce a usable signal.7. Compute the lifetime of the 3P1 state of Hg. Explain the temperature dependence of your results. Compare with the accepted value of τ = 118 ns ±3% (Radzig & Smirnov). Mathematica 3.0, Math CAD and FFIT, on the PC's, are available for fitting Lorentzians.QUESTIONS:(1) How much of your B = 0 signal is due to dark current? How much to room lights? Where does the rest come from?(2) Why do you want the Hg lamp cool?(3) How will self reversal of the 253.7 nm line from the Hg lamp affect the shape of the light curve? How will it affect the determination of the 3P l lifetime?(4) How does the number of Hg vapor (atoms/cm3) vary with temperature? How does this affect the coherent-trapping process? How does this in turn influence the "lifetime" that you observe? Could you remove one of the polarizers and still get good data? Which one is most important? How would you correctly set the UV Polarizers when setting up an experiment for the first time?(5) Why was expensive isotopically pure 198Hg used to fill the scattering cell? How would the data be altered if natural abundance Hg were substituted?(6) Why is the scattering cell shaped, and coated, the way it is? Would satisfactory results be obtained if the simpler right-cylindrical geometry had been used?REFERENCES:1. P. A. Franken, "Interference Effects in the Resonance Fluorescence of "Crossed" Excited Atomic States," Phys. Rev. 121, 508 (1961).2. A. Lurio, R. L. deZafra, and R. J. Goshen, "Lifetime of the First 1P1 State of Zinc, Calcium, and Strontium," Phys. Rev.,A134, 1198 (1964).3. A. C. G. Mitchell and Zemansky, Resonance Radiation and Excited Atoms, (Cambridge University Press, 1971).4. A. A. Radzig & Smirnov, Reference Data on Atoms, Ions, & Molecules, (Springer-Verlag, 1985).5. W. Happer, Review article bound in Reference binder.6. R. L. deZafra and W. Kirk, "Measurement of Atomic Lifetimes by the Hanle Effect," Amer. J. Phys.35, 573 (1967).7. G. Moruzzi and F. Strumia, The Hanle Effect and Level - Crossing Spectroscopy, (Plenum Press, 1991).8. R. Ignace, K. H. Nordsieck, and J. P. Cassinelli, "The Hanle Effect as a Diagnostic of Magnetic Fields in Stellar Envelopes. I. Theoretical Results for Integrated Line Profiles," The Astrophysical Journal, 486, 550 (1997) and II, The Astrophysical Journal, 520, 335 (1999). These two papers are good examples of modern applications of the。

第17卷 第3期原 子 与 分 子 物 理 学 报Vol.17,№.3 2000年 7月CHINES E JOURNAL OF ATOM IC AND M OLECULAR PHYS ICS Jul.,2000文章编号:1000-0364(2000)03-0541-0499长春“全国原子分子物理与高压物理、高压合成学术讨论会”论文Y模型与V模型中的双光子电磁感应光透明国秀珍,王 冬,杨苏辉,姜 云(吉林大学物理系长春市解放大路119号130023)摘要:给出了双光子电磁感应光透明的两种理论模型:Y模型和V模型,比较了两种模型的特性,并指出了V模型的优点。
关键词:双光子;电磁感应光透明中图分类号:O431.2 文献标识码:A 1 引言电磁感应光透明是量子光学领域中的一个比较新颖的研究课题[1,2]。
它是利用原子相干效应,通过外加电磁场来改变介质对光的吸收特性,使得某频域内本应被吸收的光透过介质。
电磁感应光透明在非线性光学,无粒子数反转激光,光信号处理及光学存储等方面有着其潜在的应用价值[3,4]。
人们对电磁感应光透明所进行的大多数研究是针对三能级系统的T模型,Λ模型等几种典型的能级结构[5,6]。
印度学者Argaw al等提出了一种新的原子相干模型,我们称之为Y模型[7],如图1所示。
在Y模型中,原子相干效应被用于四能级系统中,从而实现了电磁感应双光子光透明及共振吸收增强。
在Y模型的启示下,我们将相干场加在能级3〉-4〉之间,将这种模型定义成双光子电磁感应光透明的V模型,如图2所示。
针对这两种模型,利用密度矩阵方程,我们推导出了代表双光子吸收强度的上能级粒子数的二阶近似解析解,并分析、比较了两种模型的电磁感应光透明的主要特性。
2 理论模型2.1 Y模型在图1所示的四能级系统中,ω12、ω23及ω42分别为原子在能级|1〉※|2〉,|2〉※|3〉和|4〉※|2〉之间的跃迁频率;ω1,ω2和ω为相应的激光场频率,在此我们假设ω1,ω2为弱的探测场,而ω为强的相干场;Δ1=ω12-ω1,Δ2=ω23-ω2,Δ=ω42-ω为各个原子共收稿日期:2000-02-10。
a r X i v :n u c l -t h /0605083v 2 9 J u n 2006Parity non-conservation in nuclear excitationby circularly polarized photon beamA.I.Titov 1,2,M.Fujiwara 1,3and K.Kawase 31Kansai Photon Science Institute,Japan Atomic Energy Agency,Kizu,Kyoto619-0215,Japan2Bogoliubov Laboratory of Theoretical Physics,JINR,Dubna 141980,Russia3ResearchCenter for Nuclear Physics,Osaka University,Ibaraki,Osaka 567-0047,JapanParity non-conservation (PNC)is well known after the discovery of the mirror symmetry violation in β-decays by Wu [1],following the suggestion by Lee and Yang [2].The origin of this mirror-asymmetry is now clearly understoodPreprint submitted to Elsevier Science9February 2008as a manifestation of the exchange processes of weak bosons,W±,which are mediators ofβ-decay.Observations of the PNC effect in the nucleon-nucleon interaction are not new. The trial to observe the PNC effect began with thefirst report by Tanner in 1957[3],followed by the famous work of Feynman and Gell-Mann[4]for the universal current-current theory of weak interaction.Wilkinson[5]also triggered the enthusiastic long studies offinding the tiny PNC effect in nuclear excitation processes.The process contributing to the PNC effect is due to the non-trivial quark interactions with weak Z0and W±bosons in the effective nucleon-nucleon-meson vertices.The details of the PNC studies were reviewed in Refs.[6,7]. However,the current problem is essentially focused on the fact that the weak meson-nucleon coupling constants(and in particular,the pion-nucleon cou-pling constant)deduced from various experiments are not consistent.It is concluded by Haxton et al.,[8]that the experimental PNC studies are still not satisfactory,and more experimental as well as theoretical studies are needed.One of experimental PNC studies is to measure the parity mixing between the parity-doublet states.On the basis of thefirst order perturbation theory,the wave functions of two closely-located states,|φπ and|φ−π are mixed by the PNC interaction V P NC as|˜φπ =|φπ + φ−π|V PNC|φπThen,the PNC effect appears in the asymmetry of emitted circularly polarized photons[6].Pγ∼2RA a RL=σa R −σaL2−(E x =109.9keV)state in19F.This example is very transparent and canbe easily extended to other parity doublets with higher spins.Therefore,we use it as a starting point of our consideration,leaving discussion of practical utilization of this particular transition,which may be not so easy at once because of the finite life time of the radiative 19F.It is assumed that theground state with J π=12−are the paritydoublet|12+−α|12−≃|12+,(4)withα=12+/∆E,(5)and ∆E =E 12+.The amplitude of the process γi +A →A ∗→γf +A(A =19F)may be expressed as a product of absorption (T a )and decay (T d )-amplitudes4Tλiλf =T a m∗;λi,m i·T dλf,m f;m∗,(6)where m i,m∗,m f,andλi,λf are the spin projections of the nucleus A in the initial,excited,and thefinal states,and the photon helicities in the initial and thefinal states,respectively.Here,we assume that the spin projection of the excited state is conserved during its short decay lifetime.Fig.1.Reaction scheme ofγi+19F(12−)→γf+19F(12π(2L+1)× J i m i Lλ|J f m f2J f+1[F EL+λF ML],(7) where J i,f and m i,f are the spin and spin projection of the initial and thefinalstates,λis the photon helicity,F E/M L= f||T LE/M||i is the reduced matrix element of the multipole operators.In the case of J i=J f=12δm i,−λ2πF E1and M1≡√2δm i,−λiwithµ±=√2±||T1M||12δm f,−λf2,¯m′ =d12,m ,(12) where d j mm′(θ)is the Wigner function,andθis the angle between the beam direction and the direction offlight of the emitted photon.This relation leads toTλf,m f;λf 2λi2(θ)δm f,−λf2λi2(θ))2=1, λfλf(d12λfand neglecting the terms proportional toα2,we get the PNC-asymmetry in the following formA RL(θ)=(1+cosθ)<A RL>,(15) with<A RL>=2αRe µ+)→19F(12+)has“1+cosθ”-dependence.It is enhanced(suppressed)atθ∼02(θ∼π).This idea can be extended to the other nuclei.In case of18F,there are parity doublet states with Jπ=0+and0−at the energies E x=1.042and1.081 MeV,respectively.Although the1+ground state of18F is unstable and thus the experimental feasibility is very low,we show the result of corresponding calculation as a prediction for any1+→0−(0)+transitions.In case of the transitionγ+(1+)→(0−)[1081keV]→γ+(1+)in18F,the asymmetry is isotropic,because the excited state with J=0loses information about the spin-helicity in the initial stateA RL(θ)=<A RL>=2 0−|V PNC|0+ E1 .(17) Here E1and M1are the amplitudes of the1+→0−and1+→0+transitions, respectively.−)[2789keV]→γ+(3 The PNC asymmetry for the transitionγ+(32A RL(θ)≃(1+12+|V PNC|1E12−Re M12+→12+→14in Eq.(18)reflects the fact that the spin projectionm i of the ground state at thefixed photon helicityλi may be−12λi. Instead of the reactions with polarized photons and unpolarized target,one can analyze the reactions with polarized target and unpolarized beam.The spin asymmetry is defined asA S=σ+−σ−2cosθ)<A RL>.(23)8In Table1,we show other possible examples for studying the PNC-transitions in light nuclei by NRF.For completeness,we also show the corresponding angular correlations for the photon asymmetries for transitions with the spin in initial andfinal states are J i and J f,respectively.Transitions0→1A RL(θ)= 1+cosθ1−3cos2θ+4cos4θ <A RL>.(25) Transitions1→1A RL(θ)= 1+2cosθ73+21cos2θ <A RL>.(27) In the equations described above,the average value of the asymmetry is defined as a the product of the PNC-matrix element and the nuclear amplifier factor |<A i RL>|=2|R i NTable 1Possible candidates for studying the PNC asymmetry in the light nuclei.The energy levels and the amplifier factors |R N /∆E |are given in keV and MeV −1,respectively.A Ztransition(J πi ;I i )[E i ]→(J πf ;I f)[E f ]admixture(J −πf )[E ′f]|R N /∆E |14N (1+,0)→(1+,0)[6203][5691]7.0±2.0(1+,0)→(0+,1)[8624][8776]40±5(1+,0)→(2−,1)[9509][9172]45±52−,12−,116O(0+,0)→(2−,0)[8872][6917]18±2[11520]9.5±0.720Ne (0+,0)→(1−,0)[11270][11262]670±7000parity doublet levels was excited via a nuclear reaction,and the admixture of the configuration of the opposite parity was manifested as the asymmetry A γof γ-rays emitted from the excited states with a polarization,or as the cir-cular polarization P γof γ-rays emitted from unpolarized excited states.The isospin-structure of the corresponding transitions in each of these cases are different.This results in different structure of the transition matrix elements,and therefore it is possible to get independent information on the elementary parity-violated meson-nucleon coupling constants.10At present,there is no data available to measure the PNC effect with circular polarized photons although there are theoretical estimations for the PNC effect in the deuteron photodisintegration[14,15]for which the A RL asymmetry are expected to be very small as the10−7level.In case of the PNC measurement for the transition from the1/2+ground state to the109.9keV1/2−state in19F,for example,a high intensity photon source from the synchrotron radiation facilities at SPring-8is useful.The intensity of photons from a elliptical multipole wiggler system at SPring-8[16]reaches at around1013photons/second even at Eγ=109.9keV with an energy width (∆E)of100eV.The expected yield rate R of theγA→A∗→γA reaction reads [17]ΓR=π2λ2One method to overcome this problem is to use a multi-segmented detector in order to greatly reduce the counting rate of each detector and obtain the nec-essary total counts of N∼1010as the NRF events.The use of newly developed lutetium oxyorthosilicate(Lu2SiO5,LSO)and lutetium-yttrium oxyorthosili-cate(Lu2(1−x)Y2x SiO5,LYSO)crystals[19,20]with a decay constant of about 40ns and an energy resolution of7-10%is also promising for the NRF mea-surement with a high-counting rate.Another way is to obtain a photon beam with an ultra high resolution of∆E/E∼10−5−10−6.In this case,the back-ground photons due to Compton scattering are greatly reduced,and theγ-ray events due to the NRF process are relatively enhanced to get a high counting rate necessary for performing a high-statics PNC measurement.AcknowledgementsWe thank H.Akimune,H.Ejiri,S.Dat’e,M.Itoh,Y.Ohashi,H.Ohkuma, Y.Sakurai,S.Suzuki,K.Tamura,H.Toki,and H.Toyokawa for fruitful discussions.One of the authors(A.I.T.)thanks T.Tajima for his hospitality to stay at SPring-8.This work was strongly stimulated by a new project to produce a high-intensity MeVγ-rays at SPring-8.References[1]Wu C S et al1957Phys.Rev.1051413[2]Lee T D and Yang C N1956Phys.Rev.104254[3]Tanner N1957Phys.Rev.1071203[4]Feynman R P and Gell-Mann M1958Phys.Rev.109193[5]Wilkinson D H1958Phys.Rev.1091603[6]Adelberger E G and Haxton W C1985Ann.Rev.Nucl.Sci.35501[7]Desplanques B1998Phys.Rep.2971[8]Haxton W C,Liu C-P and Ramsey-Musolf M J2002Phys.Rev.C65045502[9]Earle E D,McDonald A B,Adelberger E G,Snover K A,Swanson H E,vonLintig R,Mak H B and Barnes C A,1983Nucl.Phys.A396221c[10]Holstein B.R“Weak Interactions in Nuclei”,(Princeton University Press,1989)[11]“Symmetries and Fundamental Interaction in Nuclei”,ed.by W.C.Haxtonand E.M.Henley.World Scientific Publishing Co.Pte.Ltd.1995,p.17 [12]Adelberger E G,Hindi M M,Hoyle C D,Swanson H E,Von Lintig R D andHaxton W C1983Phys.Rev.C272833[13]De Forest T and Walecka J D1966Adv.Phys.151[14]Fujiwara M and Titov A I2004Phys.Rev.C69065503[15]Liu C P,Hyun C H and Desplanques B2004Phys.Rev.C69065502[16]Ma´r echal X.-M,Hara T,Tanabe T,Tanaka T and Kitamura H1998J.Synchroton Rad.5431[17]Skorka S.J.“The electromagnetic interaction in nuclear spectroscopy”ed.byW.D.Hamilton.North-Holland1975,p.283[18]Ajzenberg-Selove F,1972Nucl.Phys.A1901,and see Table19.10[19]Qin L,Pei Yu,Lu S,Li H,Yin Z,and Ren G2005Nucl.Instr.and Meths inPhy.Res.A545273,and references therein[20]Chen J,Zhang L and Zhu R2004Nuclear Science Symposium ConferenceRecord IEEE1117。