层次分析法优秀论文3
- 格式:pdf
- 大小:1.37 MB
- 文档页数:30

欧洲五大足球俱乐部的数学建模分析论文统计学杨子清 101201010117前言:纵观当今欧洲足坛,风起云涌,豪强并起。
巴萨皇马,称雄西甲;德甲拜仁,一枝独秀;蓝黑军团国际米兰,逐鹿意甲之天下;英超一霸切尔西,竟然也能在高手如林的欧冠赛场捧杯。
欧洲的足球水平为何如此之高?五大豪强的经验又带给了我们什么样的启示呢?这便是本文要探讨的问题。
本文引用了数学建模的思想,采用了层次分析法对欧洲五大足球俱乐部的综合实力进行理性而深入的分析。
所谓数学建模,就是对现实世界中的某一特定现象,为了某一特定的目的,做的简化假设,运用数学工具,得到一个数学结构。
而层次分析法,是建模中常用的方法之一。
通过层与层之间的对比分析,得出实际问题中的某些结论。
本文所研究的问题是关于五大足球俱乐部的综合实力排名情况。
现实的足球世界中,影响一支球队的综合能力有许多。
例如进攻能力、防守能力、球员能力、教练的执教能力、裁判的执法能力等。
这些因素都是对于一支的球队综合实力有着或多或少的影响。
但他们各自的权重并不一样,所以,如何筛选这些因素是本文分析的关键所在。
众所周知,当数学模型建立之后,还不能马上用于实际分析,必须对模型做进一步的检验。
由于本文数据分析过程较为繁琐,所以检验部分并非人工完成,而是运用电脑软件R来完成的。
采用了Satty的检验方法对模型进行分析,使模型分析的可信度大大提高。
关键词:数学模型、层次分析法、欧洲足球一、数学建模的基本过程:如下图所示图1:数学建模基本流程图层次分析法把人的思维层次化、数量化, 并用数学为分析、决策、预报或控制提供定量的依据。
这一方法的特点是在对复杂决策问题的本质、影响因素以及内在关系等进行深入分析之后, 构建一个层次结构模型, 然后利用较少的定量信息, 把决策的思维过程数学化, 从而为求解多目标、多准则或无结构特性的复杂决策问题提供一种简便的决策方法 , 尤其适合于人的定性判断起重要作用的、对决策结果难于直接准确计量的场合。
层次分析法经典案例篇一:层次分析法步骤层次分析法实例与步骤结合一个具体例子,说明层次分析法的基本步骤和要点。
【案例分析】市政工程项目建设决策:层次分析法问题提出市政部门管理人员需要对修建一项市政工程项目进行决策,可选择的方案是修建通往旅游区的高速路(简称建高速路)或修建城区地铁(简称建地铁)。
除了考虑经济效益外,还要考虑社会效益、环境效益等因素,即是多准则决策问题,考虑运用层次分析法解决。
1.建立递阶层次结构应用AHP解决实际问题,首先明确要分析决策的问题,并把它条理化、层次化,理出递阶层次结构。
AHP要求的递阶层次结构一般由以下三个层次组成:? 目标层(最高层):指问题的预定目标;? 准则层(中间层):指影响目标实现的准则;? 措施层(最低层):指促使目标实现的措施;通过对复杂问题的分析,首先明确决策的目标,将该目标作为目标层(最高层)的元素,这个目标要求是唯一的,即目标层只有一个元素。
然后找出影响目标实现的准则,作为目标层下的准则层因素,在复杂问题中,影响目标实现的准则可能有很多,这时要详细分析各准则因素间的相互关系,即有些是主要的准则,有些是隶属于主要准则的次准则,然后根据这些关系将准则元素分成不同的层次和组,不同层次元素间一般存在隶属关系,即上一层元素由下一层元素构成并对下一层元素起支配作用,同一层元素形成若干组,同组元素性质相近,一般隶属于同一个上一层元素(受上一层元素支配),不同组元素性质不同,一般隶属于不同的上一层元素。
在关系复杂的递阶层次结构中,有时组的关系不明显,即上一层的若干元素同时对下一层的若干元素起支配作用,形成相互交叉的层次关系,但无论怎样,上下层的隶属关系应该是明显的。
最后分析为了解决决策问题(实现决策目标)、在上述准则下,有哪些最终解决方案(措施),并将它们作为措施层因素,放在递page1阶层次结构的最下面(最低层)。
明确各个层次的因素及其位置,并将它们之间的关系用连线连接起来,就构成了递阶层次结构。
层次分析方法范文案例背景:小明是一名大学生,想要购买一辆新车。
他希望车辆的品牌知名度高、车辆性能好、价格合理等因素都可以考虑到,从而做出最佳决策。
步骤一:建立层次结构在层次分析方法中,首先需要建立一个层次结构,包含了问题的各个方面,以及它们之间的关系。
对于小明的问题,他可以将层次结构分为三个层次:品牌知名度、车辆性能和价格。
步骤二:构建判断矩阵判断矩阵是层次分析方法的核心,用于比较不同因素之间的重要程度。
小明需要根据他对每个因素的主观判断来构建判断矩阵。
例如,他认为品牌知名度比车辆性能重要,可以给予品牌知名度一个更高的权重。
在这个过程中,小明需要和他对车辆品牌的了解程度进行比较,以及和他对车辆性能的需求进行比较。
步骤三:计算权重向量通过对判断矩阵进行计算,可以得到每个因素的权重向量。
小明可以使用软件或者Excel等工具来进行计算。
权重向量表明了不同因素对最终决策的影响程度。
例如,如果品牌知名度的权重向量为0.6,车辆性能的权重向量为0.3,价格的权重向量为0.1,则表明品牌知名度对最终决策的影响最大。
步骤四:一致性检验在确定权重向量之后,需要进行一致性检验来验证判断矩阵的合理性。
一致性检验可以使用一致性指标CI和一致性比例CR来进行评估。
如果CR值小于0.1,则说明判断矩阵是一致的。
如果CR值大于0.1,则需要重新调整判断矩阵,直到CR值小于0.1为止。
步骤五:综合评估与决策通过计算得到的权重向量,可以对各方案进行综合评估,从而做出最佳决策。
小明可以将不同品牌的车辆在品牌知名度、车辆性能和价格等方面进行评估,然后乘以对应的权重向量,得到综合评估分数。
最终,小明可以选择综合评估分数最高的车辆作为他的购买决策。
层次分析方法是一种科学而系统的决策方法,可以帮助我们在面对复杂问题时做出更加准确的决策。
通过对层次结构的建立,判断矩阵的构建,权重向量的计算以及一致性检验的评估,可以得出最佳决策方案。
同时,在进行层次分析方法时,我们还应该注意对各个因素进行实际情况的分析和评估,以保证最终的决策是科学和合理的。
国赛层次分析法论文摘要:本文针对消费者购房这一具体问题,基于高等代数矩阵内容,立足于数学建模,通过具体实例的分析详细描述了采用层次分析法解决多目标决策问题的方法和步骤,为消费者的购房决策提供科学合理的办法。
关键词:成对比较矩阵;特征根;特征向量;层次分析法随着经济的发展,收入水平的增加,消费者对商品房的要求也在增加。
目前多数消费者购房有的因为工作,有的是为了改善居住环境,还有的是为了投资。
不管是什么原因,由于涉及金额巨大,购房需慎之又慎,以免花钱买后悔。
针对消费者的需求,房地产开发商也在不断地推出新的楼盘。
这些楼盘往往各有各的特点,这使得消费者经常因选房而筋疲力尽,生怕捡了芝麻丢了西瓜。
究其原因,主要是考虑的因素太多,价格、交通、环境等等。
如就价格而言,甲比乙便宜;而就交通而言,乙又不如甲,这就使得购房者难以做出孰优孰劣的判断。
但是,所有的购房者都想买到物美价廉的房子,这是总目标,如果我们能够对备选房源“物美价廉”的程度进行量化,就能通过简单的数值比较做出决策。
运用统计学中的层次分析法就能轻松解决这一决策难题。
一、层次分析法概述1简介层次分析法是美国运筹学家萨蒂在20世纪70年代提出的一种实用的定性和定量相结合的多准则决策方法。
它是把复杂的决策按照目标层、准则层、子准则层、方案层的顺序表示为一个有序的递阶层次结构,通过人们的比较判断,计算各种决策方案在不同准则及总目标之下的相对重要性权重,从而把难以量化的各种方案定量化,以得到各种方案的相对优劣的排序值,并据此做出最后的决策。
2层次分析法的基本步骤第一步:根据问题的性质和要求,提出一个总目标。
将目标逐层分解为几个层次,建立层次结构模型。
第二步:对同一层次的各元素关于上一层次某一准则的重要性进行两两比较并赋权值,构造成对比较矩阵。
基于层次分析法的模糊综合评价研究和应用共3篇基于层次分析法的模糊综合评价研究和应用1基于层次分析法的模糊综合评价研究和应用层次分析法(Analytic Hierarchy Process,简称AHP)是一种重要的多指标决策方法,其独特的定量分析模式使其被广泛应用于各种决策场景中。
然而,在实际应用过程中,AHP所依赖的判断矩阵等参数很难满足严格的一致性要求,这就使得AHP方法的有效性存在一定的争议。
针对这一问题,模糊综合评价方法应运而生,它将AHP和模糊理论相结合,充分考虑了决策者的不确定性和模糊性,从而提高了决策效果。
本文将通过研究和应用实例,探究基于层次分析法的模糊综合评价方法的优点和不足,以及如何选取决策指标和构建评价体系。
1. 模糊综合评价方法概述模糊综合评价方法是一种基于模糊数学的决策方法,可以较好地处理决策过程中存在的不确定性和模糊性。
它的基本思想是,将决策问题转化为一个多层次、多指标的评价体系,在每个层次上进行相对重要性的判断和权重赋值,最终得出总体评价结果。
模糊综合评价方法中的模糊数常常用梯形和三角形模糊数表示,如图1所示。
图1 模糊数表示法其中,如(a)所示的梯形模糊数由四个参数a、b、c、d唯一确定,表示变量值在[a,b]和[c,d]之间的可能性;如(b)所示的三角形模糊数由三个参数a、b、c唯一确定,表示变量值在[a,c]之间的可能性。
2. 决策指标的选取和构建评价体系在使用模糊综合评价方法进行决策时,决策指标的选取和评价体系的构建是很关键的。
具体来说,决策指标应具备以下特点:(1) 目标明确:决策指标应当明确对应的决策目标,且目标应该是具有明确定义的。
(2) 可度量性强:决策指标应当具有可度量性和数量化的特点,以便进行量化分析。
(3) 影响因素少:决策指标应当尽量减少具有交叉影响的因素,以避免多重计数和重复计算。
(4) 数据可获取性高:决策指标的数据应当便于获取,能够反映决策现实,以便进行实际应用。
层次分析法1. 介绍层次分析法(Analytic Hierarchy Process,AHP)是一种用于多准则决策分析的方法。
该方法由美国运筹学家托马斯·L·塞蒂在1970年代初开发并广泛应用于各个领域。
层次分析法通过将复杂的决策问题分解成多个层次,并对不同层次的准则进行比较和评价,帮助决策者做出科学、合理的决策。
2. 基本原理层次分析法的基本原理是将一个复杂的决策问题层层分解为若干个层次。
这些层次由目标层、准则层、方案层等组成,形成一个层次结构。
在每个层次上,决策者需要对不同的元素进行比较和评价,以确定它们之间的重要性和优先级。
层次分析法的核心是通过建立成对比较矩阵,从而将主客观因素相结合,实现准则之间的比较和权重的确定。
在层次分析法中,决策者需要对每个准则对两两进行比较,根据重要性进行两两判断。
这些判断形成了一个判断矩阵。
然后,通过特征向量法计算各个准则的权重。
最后,将这些权重进行归一化处理,得到每个准则的相对重要性。
3. 应用步骤层次分析法的应用可以按照以下步骤进行:3.1 确定决策目标首先,需要明确决策的目标是什么。
目标是整个决策过程的核心,决策者需要明确目标才能有针对性地进行后续的决策分析。
3.2 构建层次结构根据决策问题的特点和要求,构建一个包含目标层、准则层和方案层的层次结构。
目标层表示决策的最终目标,准则层表示影响目标实现的各种准则,方案层表示可供选择的各种方案。
3.3 构建比较矩阵对于每个层次的准则,决策者需要对其进行两两比较,并判断各个准则之间的重要性。
通过构建比较矩阵,可以很直观地展示各个准则之间的相对重要性。
3.4 计算权重通过特征向量法,根据比较矩阵计算各个准则的权重。
特征向量法是一种数学方法,可以根据比较矩阵的特征向量,得到每个准则的权重。
3.5 归一化处理将准则的权重进行归一化处理,得到每个准则的相对重要性。
归一化处理可以使不同准则的权重在同一尺度上进行比较,更加公平合理。

多目标规划结课论文论文题目:层次分析法在人才招聘中的应用研究如何从众多的应聘者中甄选出适合于本企业的人才是人力资源管理所面临的重要课题之一。
目前用人单位在招聘员工时,通常只是对众多的应聘人员进行简单的考察。
因受各种主客观因素的影响,对应聘人员的评价难免有失公正。
文章以某大型企业高层次人才的胜任力模型为例,设计了在招聘过程中甄选应聘者的指标体系,在评估方法上,采取定性与定量相结合的方法,运用层次分析法(AHP)确定了指标权重系数,针对甄选指标的模糊性,建立了评估的模糊综合评价模型,并进行了应用实例评估,结果表明,所建立的应聘者甄选评估体系是实际可操作的。
关键词:胜任力模型;层次分析法;模糊评价随着我国经济的飞速发展,人才已成为各企业竞争的核心要素。
这当中,人才招聘是企业实施人才战略,合理配置人才梯队最为基础性的工作,同时对于企业提升人才队伍整体水平有着至关重要的意义。
从企业人力资源规划角度出发,员工招聘规划是企业人力资源规划最为基础性、决定性的工作,员工招聘规划的合理性直接对企业人力资源规划中后续工作产生重要的影响。
图1揭示了员工招聘规划在企业人力资源规划中扮演的重要角色,充分体现了人才招聘在企业战略发展中的重要意义。
在人才招聘的工作中,常常会遇到许多模糊的概念,例如,人才业务能力的大小、思想水平高低、身体状况等。
传统的人才招聘工作中,多采用团队针对应聘者多方面表现,综合评价进行人才甄选,该方法虽然采用团队综合评价,但由于团队中领导者的导向作用会对团队成员对应聘者评价有不同程度的影响,而且团队成员做出的评价本身都具有主观性,导致最终的结果客观性不强,且针对不同应聘者的可比性不够。
模糊优选的基本理念是将模糊的问题通过合理的评定、比较实现量化,将模糊优选模型应用于人才招聘问题中,可实现将模糊问题清晰化,同时在此基础上引入层次分析法,对人才模糊优选中的各影响因素赋予合理权重,最终实现人才招聘的规范化、客观化。

基于层次分析法优化国家励志奖学金的评定——以四川农业大学为例信息与计算科学 2008级邓智指导教师陈涛教授摘要:本文根据我校国家励志奖学金评定的实际情况,对影响励志奖学金评定的学习能力、综合能力和附加分等3个一级指标和必修课平均成绩、选修课平均成绩、英语过级成绩、计算机过级、德育成绩、文体成绩、科研创新、学生干部加分、贫困等级、兼职数等10个二级评价指标向全校师生进行抽样调查,得出每一层次的判断矩阵,用层次分析法建立评价的数学模型,用MATLAB计算各影响因素在励志奖学金评定中所占的权重,得到我校国家励志奖学金的量化模型。
关键词:层次分析法,奖学金,权重,MATLABOptimizing the Assessment of National Motivational ScholarshipsBased on AHP——Sichuan Agricultural University as an example Deng Zhi Information and Computational Science, Grade 2008Directed by Chen Tao (Professor)Abstract:This article is based on the actual situation of the assessment to national motivational scholarships in our school. I carry out an sample survey to all the school students and teachers on some possible factors for impacting the assessment of motivational scholarships, including three level indicators: the ability of learning, comprehensive capabilities, additional points, and 10 secondary evaluations: compulsory subjects average grades, elective courses average grades, English grades through the tests, computer levels, moral achievements, sports achievements, research and innovation, plus as student leaders, poverty levels, the number of part-time, and so on, To get the judge matrix for each levels. Establishing the evaluation of mathematical models using analytic hierarchy process., calculating the weight of every impact factors in the inspirational Scholarship using analytic hierarchy process,to get the quantitative model of national motivational scholarships in our school.Keywords: Analytical Hierarchy Process, scholarships, weight,Matrix Laboratory1 引言国家励志奖学金的设立是为了激励普通本科高校、高等职业学校和高等专科学校的家庭经济困难学生勤奋学习、努力进取,营造积极向上,争先创优的浓郁氛围,引导全校学生在德、智、体、美等方面全面发展,由中央和地方政府共同出资设立的,奖励资助在思想道德、学业成绩、科技创新、文体活动以及社会服务等方面表现突出的家庭经济困难的优秀学生,激励学生刻苦学习、奋发有为、励志成才、德智体美全面发展。

多目标规划结课论文论文题目:层次分析法在人才招聘中的应用研究如何从众多的应聘者中甄选出适合于本企业的人才是人力资源管理所面临的重要课题之一。
目前用人单位在招聘员工时,通常只是对众多的应聘人员进行简单的考察。
因受各种主客观因素的影响,对应聘人员的评价难免有失公正。
文章以某大型企业高层次人才的胜任力模型为例,设计了在招聘过程中甄选应聘者的指标体系,在评估方法上,采取定性与定量相结合的方法,运用层次分析法(AHP)确定了指标权重系数,针对甄选指标的模糊性,建立了评估的模糊综合评价模型,并进行了应用实例评估,结果表明,所建立的应聘者甄选评估体系是实际可操作的。
关键词:胜任力模型;层次分析法;模糊评价随着我国经济的飞速发展,人才已成为各企业竞争的核心要素。
这当中,人才招聘是企业实施人才战略,合理配置人才梯队最为基础性的工作,同时对于企业提升人才队伍整体水平有着至关重要的意义。
从企业人力资源规划角度出发,员工招聘规划是企业人力资源规划最为基础性、决定性的工作,员工招聘规划的合理性直接对企业人力资源规划中后续工作产生重要的影响。
图1揭示了员工招聘规划在企业人力资源规划中扮演的重要角色,充分体现了人才招聘在企业战略发展中的重要意义。
在人才招聘的工作中,常常会遇到许多模糊的概念,例如,人才业务能力的大小、思想水平高低、身体状况等。
传统的人才招聘工作中,多采用团队针对应聘者多方面表现,综合评价进行人才甄选,该方法虽然采用团队综合评价,但由于团队中领导者的导向作用会对团队成员对应聘者评价有不同程度的影响,而且团队成员做出的评价本身都具有主观性,导致最终的结果客观性不强,且针对不同应聘者的可比性不够。
模糊优选的基本理念是将模糊的问题通过合理的评定、比较实现量化,将模糊优选模型应用于人才招聘问题中,可实现将模糊问题清晰化,同时在此基础上引入层次分析法,对人才模糊优选中的各影响因素赋予合理权重,最终实现人才招聘的规范化、客观化。
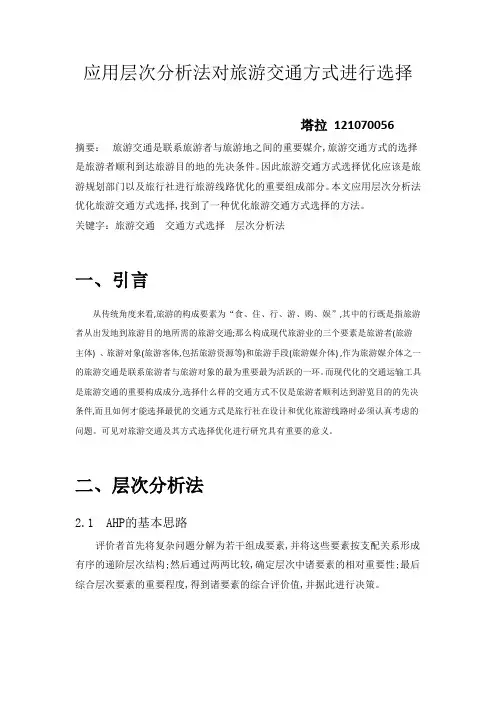
应用层次分析法对旅游交通方式进行选择塔拉121070056摘要:旅游交通是联系旅游者与旅游地之间的重要媒介,旅游交通方式的选择是旅游者顺利到达旅游目的地的先决条件。
因此旅游交通方式选择优化应该是旅游规划部门以及旅行社进行旅游线路优化的重要组成部分。
本文应用层次分析法优化旅游交通方式选择,找到了一种优化旅游交通方式选择的方法。
关键字:旅游交通交通方式选择层次分析法一、引言从传统角度来看,旅游的构成要素为“食、住、行、游、购、娱”,其中的行既是指旅游者从出发地到旅游目的地所需的旅游交通;那么构成现代旅游业的三个要素是旅游者(旅游主体) 、旅游对象(旅游客体,包括旅游资源等)和旅游手段(旅游媒介体) ,作为旅游媒介体之一的旅游交通是联系旅游者与旅游对象的最为重要最为活跃的一环。
而现代化的交通运输工具是旅游交通的重要构成成分,选择什么样的交通方式不仅是旅游者顺利达到游览目的的先决条件,而且如何才能选择最优的交通方式是旅行社在设计和优化旅游线路时必须认真考虑的问题。
可见对旅游交通及其方式选择优化进行研究具有重要的意义。
二、层次分析法2.1 AHP的基本思路评价者首先将复杂问题分解为若干组成要素,并将这些要素按支配关系形成有序的递阶层次结构;然后通过两两比较,确定层次中诸要素的相对重要性;最后综合层次要素的重要程度,得到诸要素的综合评价值,并据此进行决策。
2. 2 AHP的基本步骤2. 2. 1 建立递阶层次结构模型分析待决策问题中所包含的要素,并按要素间的隶属关系,将各要素按不同层次聚集组合,明确决策的目标、准则以及待决策的方案,形成一个多层次的结构模型。
2. 2. 2 构造比较判断矩阵以上层中某一准则为依据,在各层要素中进行两两比较,并引入判断尺度(见表1)将其量化,构造出比较判断矩阵。
表1比例标度及其含义2. 3利用层次分析法对旅游交通方式选择优化2. 3. 1 建立京沪间的旅游交通方式决策的递阶层次结构模型京沪间的交通方式主要有铁路,航空和公路三种,旅游者在选择出行方式时受多方面因素的制约,包括收入水平、出行距离、时间价值等需求属性变量、运输价格运输速度、舒适性、安全性、可达性等供给属性解释变量。
层次分析法实例范文下面我将以一个实例来说明层次分析法的应用。
假设你是一家公司的项目经理,需要在三个设计方案中选择一个最适合的方案。
你希望通过层次分析法来评估并选择最佳方案。
首先,你需要确定准则层。
准则层是评估和比较设计方案的标准。
在本实例中,准则层可以包括三个因素:成本、技术易用性和效果。
其次,你需要对每个准则进行两两比较。
你需要确定哪个准则对你更重要,换句话说,你需要对准则之间的重要性进行评估。
你可以使用一个1到9的尺度来进行评估,其中1表示相对重要性相同,9表示相对重要性非常不同。
在这个例子中,假设你认为成本对你更重要,因此可以给成本的评估为9,而技术易用性和效果的评估都为5接下来,你需要对每个准则的子准则进行两两比较。
对于成本来说,可能的子准则可以包括材料成本、人力成本和设备成本。
你需要评估这些子准则之间的重要性,同样使用1到9的尺度进行评估。
假设你认为人力成本对成本的影响最大,你可以给予人力成本的评估为9、材料成本和设备成本则分别给出评估5和3对于技术易用性和效果这两个准则,你需要进行类似的比较和评估。
比如,你可能认为技术易用性中的用户友好性对你最重要,效果中的创新性最重要。
完成这些比较和评估后,你需要计算总体权重。
通过层次分析法计算权重的方法是对准则之间的比较矩阵进行归一化处理,即计算每列的平均值,然后将每个条目除以其所在列的平均值。
最后,求每行的平均值得到每个准则的权重。
例如,对于成本准则,对应的比较矩阵为:1591/5131/91/31计算每列的平均值为:1/35/95/3然后将每个条目除以其所在列的平均值,得到:15/93/53/511/35/33/11最后,求每行的平均值得到每个准则的权重:0.48780.25920.2529重复这个过程,你可以得到技术易用性和效果的权重。
最后,你可以将每个设计方案在每个准则上进行评估。
同样使用1到9的尺度进行评估,并对每个准则乘以其对应的权重得到总体分数。
影响XXX学习积极性的因素XXXXXXXXXXX摘要:随着大学教育转型的不断深入,XXX的综合有很大的提高,但学习积极性仍不尽如人意。
究竟是什么因素影响了XXX的学习积极性,通过对诸多可能因素利用AHP层次分析法进行对比分析,总结其原因,主要有以下几方面:1.在市场经济体制的大环境下,XX的思想日益活跃,对现行课程教学的重要性认识不足,兴趣不浓;2.由于XXX相对稳定,与XX 的学生相比,XX缺少生活压力和就业压力,缺乏必要的学习动力;3.XX在教学管理过程中,以XX为主体的思想体现不足。
关键词:XX;XXX;学习积极性;主体地位;思想教育;教学管理1.引言面对当前XXX普遍存在的学习积极性不足的现状,我们必须寻求一种科学的途径来解决问题。
在此之前,大家进行过很多探讨,找到了影响学习积极性的一些较为主要的因素:学习氛围不浓,缺少自主平台,考风考纪差,休息不足,XX任务重,缺少就业和生活压力,对课程不重视等。
但这只是较为零散的概括,不能突出体现各个因素之间的重要关系,所以下面将采用层次分析法对这些因素进行研究,通过这种方法比较得出各因素对XXXX学习积极性影响程度大小。
从而让我们更清楚的认识问题,进而更好的加以改进。
2.层次分析法简介层次分析法[1]是由美国运筹学家A.L.Saaty 于本世纪70 年代提出的一种系统分析方法,80 年代初开始引入我国。
其基本思想是:把复杂问题分解成若干个组成因素,将这些因素按支配关系分组形成递阶层次结构;通过两两比较的方式确定层次中诸因素的相对重要性;然后综合有关人员的判断,确定备选方案相对重要性的总排序。
在运用层次分析法进行评价和决策时,可分为以下步骤:(1)在分析系统中各因素之间关系的基础上,建立系统的递阶层次结构图。
(2)对同一层次的各元素关于上一层次中某一准则的重要性进行两两比较,构造两两比较判断矩阵。
(3)检验判断矩阵的一致性。
(4)由判断矩阵计算被比较元素对于该准则的相对权重,即层次的单排序。
浅析AHP法及其应用姓名:…....学号:…….专业:工业工程浅析AHP法及其应用【摘要】本文介绍了AHP法的原理、步骤及其在恋爱决策中的应用,探讨0-4打分法在层次分析中应用的可能性,并将其与1-9打分法进行比较。
一、引言AHP (Analytic Hierarchy Process)层次分析法是美国运筹学家Saaty教授于二十世纪80年代提出的一种实用的多方案或多目标的决策方法。
其主要特征是,它合理地将定性与定量的决策结合起来,按照思维、心理的规律把决策过程层次化、数量化。
二、 AHP原理及基本步骤:AHP基本原理是把研究的复杂问题看作一个大系统,根据要达到的目标,将系统分解为不同的组成因素,通过对这些组成因素的分析,划出各因素间相互联系的有序层次;按照因素间的相互关联以及隶属关系将因素按不同层次聚集组合,形成一个多层次的分析结构模型;再请专家对每一层次的各因素进行客观的判断后,相应地给出每一层次全部因素的相对重要性的权值,并加以排序;以此区分各要素或方案的优劣。
其基本步骤如下:(1)建立层次结构模型;(2)构造判断矩阵;(3)层次单排序;(4)一致性检验;(5)层次总排序。
其中后三个步骤在整个过程中需要逐层地进行。
三、层次分析法用于恋爱辅助决策人们在日常生活中经常会碰到多目标决策问题,例如某女生要找男朋友,现有三个可选对象A、B和C。
假如选择的标准和依据(行动方案准则)有四个关键因素:性格、外表、财富和家庭环境。
(1)建立层次结构模型目标层准则层方案层(2) 构造判断矩阵通过相互比较确定各准则对于目标的权重,即构造判断矩阵。
在层次分析法中,为使矩阵中的各要素的重要性能够进行定量显示,引进了矩阵判断标度(1~9打分法) :2,4,6,8表示第i 个因素相对于第j 个因素的影响介于上述两个相邻等级之间。
不难定义以上各尺度倒数的含义,根据 得关键因素的判断矩阵为: 用相同方法构造所有相对于不同准则的方案层判断矩阵如下ij a a 1(3)层次单排序及其一致性检验所谓层次单排序是指,对于上一层某因素而言,本层次各因素的重要性的排序。
层次分析法在购买品牌手机中的应用引言在日常生活中常常碰到购买品牌手机的问题,如何在品牌林立的手机中挑选符合自己心意的手机,单单比较价格不一定能挑选的适合自己的手机,手机的品牌、款式、性能、品质、易用性等等。
如何能更全面更细致的对比各个指标,挑选最为适合自己手机,往往是件很纠结的事情。
为了更为合理的解决这个这个问题,本文运用层次分析法来选择手机。
1.层次分析法简介层次分析法是由美国运筹学家T.L.saaty于20世纪70年代提出的一种解决多目标的复杂问题的定性与定量相结合的决策分析方法。
它的基本原理是根据具有递阶结构的目标、子目标(准则)、约束条件、部门等来评价方案,采用两两比较的方法确定判断矩阵,然后把判断矩阵的最大特征向量的分量作为相应的系数,最后综合给出各方案的权重(优先程度)。
其特点是在对复杂的决策问题的本质、影响因素及其内在关系等进行深入分析的基础上,利用较少的定量信息使决策的思维过程数学化,从而为多目标、多准则或无结构特性的复杂决策问题提供简便的决策方法。
尤其适合于对决策结果难于直接准确计量的场合。
2.层次分析法计算(一)建立层次结构模型(可换为买车、买房,或者方案对比等,字数不足时可详细描述背景)(1)目标层中标方案(合适的车、合适的房、最优方案)(2)方案层方案1方案2方案3(可写出具体方案名称)(3)标准层价格产品质量技术支持售后服务(可根据实际方案替换,如买房的标准可以是面积、户型等)(4)层次结构图(每层的内容根据实际调整)(二)标度及两两比较矩阵(1)为了使各个标准,或在某一标准下各方案两两比较以求得其相对权重,我们引入了相对重要性的标度,如下表:(2)两两比较矩阵我们用标准层各标准来评估各方案,得出两两比较矩阵,如下:(可详细阐述背景及原因,如例中,我们可假设方案1为进口大品牌,方案2为合资,方案3为国产,及方案1价格最贵质量最好,方案2价格质量次之但售后好,方案3价格质量最次但技术支持最好)目标层 标准层方案层产品质量评价因素方案1 方案2 方案3方案1 1 5 7方案2 1/5 1 3方案3 1/7 1/3 1技术支持评价因素方案1 方案2 方案3方案1 1 1/5 1/9方案2 5 1 1/5方案3 9 5 1售后服务评价因素方案1 方案2 方案3方案1 1 1/9 1/5方案2 9 1 5方案3 5 1/5 1(3)求各因素权重采用规范列法求各因素权重(可用软件管理运筹学2.0计算,课表光盘里有,不是lindo)价格质量技术支持售后服务方案1方案2方案3需要确定各个标准在总目标里的相对重要程度,即要取得每个标准相对的权重,列出两两价格质量技术支持售后服务价格 1 3 7 5质量1/3 1 5 3技术支持1/7 1/5 1 1/3售后服务1/5 1/3 3 1求标准特征向量如下:价格质量技术支持售后服务计算衡量一个成对比矩阵A (n>1 阶方阵)不一致程度的指标CI公式如下:计算一致性率公式如下:平均随机一致性指标RI标准值如下表:维数(n) 1 2 3 4RI 0.00 0.00 0.58 0.96 维数(n) 5 6 7 8RI 1.12 1.24 1.32 1.41 维数(n) 9 10 11 12RI 1.46 1.49 1.52 1.54 维数(n) 13 14 15 16RI 1.56 1.58 1.59 1.594 分别检验各标准,计算CR如下表,一致性均CR<0.1,可以接受。
2015-2016学年第二学期《物流配送中心规划与设计》期末作业要求1、运用层次分析法分析生活中面临的选择问题,评价指标自选,准则层不少于3个,方案层不少于3个。
2、内容格式要求见例文。
层次分析法在购买洗面奶决策中的应用班级:姓名:学号:摘要:随着科技的发展,数学与人们的生活联系越来越紧密,层次分析法作为其中一个分支,也被广泛应用于军事,经济等方面。
本文采用层次分析法,从价格、效果和品牌影响力三个方面因素对购买洗面奶模型做出评价,并用权重定量化进行研究,可为消费者和生产厂家提供有效地依据。
关键词:层次分析法判断矩阵购买洗面奶要素一.问题描述随着人们对生活水平要求的不断提高,对洗面奶的选择也成为众多男士一个不可避免的问题。
由于现在市面上洗面奶的品牌目不暇接,所以对洗面奶的选择也成了一个难题。
通过查阅资料和网上问卷调查结果,对男士经常选择的牌子大致分三类:曼秀雷敦、巴黎欧莱雅和火山泥,购买时主要考虑的因素有价格、效果和品牌影响力三个方面。
由于每款洗面奶在各影响因素上往往各有优缺点,可利用层次分析法将消费者购买的经验判断予以量化,为购买决策提供依据。
二.问题求解1.建立层次结构模型:目标层A准则层方案层其中价格数据为厂家出厂时的规定价格,效果和品牌影响力由网络问卷调查得到,其中效果等级分类从高到低为5,4,3,2,1;品牌吸引力等级从高到低为3,2,1;得到下表数据:2.构造判断矩阵:由上表数据可得A-C 判断矩阵为:1 3 5 1/3 1 3 1/5 1/3 1P C i -判断矩阵分别为:1 3 5 1 1/2 1/5 1 2 4 1/3 1 3 2 1 1/3 1/2 1 3 1/5 1/3 1 5 3 1 1/4 1/3 13.一致性检验及求各层元素相对权重:由程序(程序见附件)可以判断以上四个矩阵都满足一致性检验,且算得A-C 矩阵的最大特征值和特征向量为:1λ=3.0385,1ω=(0.6370,0.2583,0.1047)T ;PC i -矩阵的最大特征值和特征向量分别为:T )1047.0,2583.0,6370.0(,0385.322==ωλ;T )6483.0,2297.0,1220.0(,0037.333==ωλT )1220.0,3196.0,5584.0(,0183.344==ωλ。
For office use onlyT1________________ T2________________ T3________________ T4________________Team Control Number55069Problem ChosenAFor office use onlyF1________________F2________________F3________________F4________________ 2017 MCM/ICM Summary SheetThe Rehabilitation of the Kariba Dam Recently, the Institute of Risk Management of South Africa has just warned that the Kariba dam is in desperate need of rehabilitation, otherwise the whole dam would collapse, putting 3.5 million people at risk. Aimed to look for the best strategy with the three options listed to maintain the dam, we employ AHP model to filter factors and determine two most influential criteria, including potential costs and benefits. With the weight of each criterion worked out, our model demonstrates that option 3is the optimal choice.According to our choice, we are required to offer the recommendation as to the number and placement of the new dams. Regarding it as a set covering problem, we develop a multi-objective optimization model to minimize the number of smaller dams while improving the water resources management capacity. Applying TOPSIS evaluation method to get the demand of the electricity and water, we solve this problem with genetic algorithm and get an approximate optimal solution with 12 smaller dams and determine the location of them.Taking the strategy for modulating the water flow into account, we construct a joint operation of dam system to simulate the relationship among the smaller dams with genetic algorithm approach. We define four kinds of year based on the Kariba’s climate data of climate, namely, normal flow year, low flow year, high flow year and differential year. Finally, these statistics could help us simulate the water flow of each month in one year, then we obtain the water resources planning and modulating strategy.The sensitivity analysis of our model has pointed out that small alteration in our constraints (including removing an important city of the countries and changing the measurement of the economic development index etc.) affects the location of some of our dams slightly while the number of dams remains the same. Also we find that the output coefficient is not an important factor for joint operation of the dam system, for the reason that the discharge index and the capacity index would not change a lot with the output coefficient changing.Contents1Overview (1)1.1Background (1)1.2 Restatement of the Problem (1)1.3 Literature Review (2)2Assumptions and Justifications (2)3Notation (3)4Model Overview (4)5Model Theory (5)5.1Determination of the Number and Location of the Dams (5)5.2 Joint operation of dam system model (9)6Model Implementation and Results (11)6.1The Number and Location (11)6.2The Strategy of Modulating Water Flow (14)7 Sensitivity Analysis (15)7.1 The Model of Determination of the Number and Location (15)7.2 The Model of Modulating Water Flow (17)8 Further discussion (17)9 Strengths and Weaknesses (18)9.1 Strengths (18)9.2 Weaknesses (19)10 Conclusion (19)11 The Evaluation of Three Options (20)11.1 Establish a Hierarchical Model (20)11.2 Analysis and Results (21)1 Overview1.1 BackgroundA Zambezi River Authority conference was held in March 2014, engineers warned that the foundations of the dam had weakened and there was a possibility of dam failure unless repairs were made.On 3 October 2014 the BBC reported t hat “The Kariba Dam is in a dangerous state. Opened in 1959, it was built on a seemingly solid bed of basalt. However, in the past 50 years, the torrents from the spillway have eroded that bedrock, carving a vast crater that has undercut the dam’s foundations, engineers are now warning that without urgent repairs, the whole dam will collapse. If that happened, a tsunami-like wall of water would rip through the Zambezi valley, reaching the Mozambique border within eight hours. The torrent would overwhelm Moz ambique’s Cahora Bassa Dam and knock out 40% of southern Africa’s hydroelectric capacity. Along with the devastation of wildlife in the valley, the Zambezi River Authority estimates that the live of 3.5 million people are at risk.”On February 2015, Engineers have started on a R3.3bn rescue marathon to prevent the “catastrophic failure” of the Kariba Dam. According to a World Bank special repor t on the beleaguered structure-one of the biggest man-made dams in the world-a potential wall collapse threatens the lives of about 3-million people living on the Zambezi River floodplain between the hydro scheme on the Zambia-Zimbabwe border and the Mozambique coast. [1]1.2 Restatement of the ProblemWe are required to provide an overview of potential costs and benefits with the three options already listed. Then we need to establish a model to determine the number and placement of the new dams when removing the Kariba dam along the Zambezi River. The same overall water management capabilities are also needed. In addition, we should consider emergency water flow situations and restrictions regarding the locations and time, so that we could give out the strategy for modulating the water flow through our new multiple dam system.In order to solve those problems, we will proceed as follows:●Build a model to determine the number and location of the multiple dams.●Give the corresponding strategy of modulating water flow in different conditions.In our model, we first establish a multi-objective model and use genetic algorithm determine the number and location of the multiple dams. There are two goals improving the water resources management capacity and reducing the cost. Besides, we add some constraints such as water balance, water level, safety and water protection. We choose twenty suitable dam sites and employ the genetic algorithm to solve the optimal problem to determine the number and the location.After determining the number and location of the dams, we construct our joint operation of damsystem model and employ the genetic algorithm to solve the problem based on the thought of dynamic programming. According to the Kariba’s climate data for about 30 years, we abstract normal flow year, low flow year, high flow year and differential year. We use them to work out the water resources planning and scheduling strategy. The construction of the discharge index and the capacity index benefits an analysis and evaluation for joint operation of the dam system’s performance in different month and year.1.3 Literature ReviewDating back to 2004, the United States removed 72 dams in total, which created a historical record. Therefore, it is high time for us to focus on the construction of dams concerning their number and placement. Plenty of researchers have already made a number of notable papers to address these problemsAlfer Weber (1909) first proposed a framework for location problem, which is an allocation question with respect to space resource. Among the three classical location model, set covering problem is a significant branch of siting issues. They explored a multi-objective location model to tackle problems with siting optimal points. In their model, maximizing coverage rate in order to satis fy every place’s need is the target function, the concentric point and the capacity restrictions are constraint conditions. Thus, they could convert the optimization problem to the mixed integer linear programming question.After the set covering model was established, we can optimize our choice of siting the dams. Then several scientists were devoted to building an optimal operation model to provide a reasonable balance between safety and balance. They begin to figure out how the multiple dam system would benefit or affect each other within its system. Masse(1940) first illustrated the concept of it; their main computing method was to optimize water modulating strategy during dispatching period.Further studies are carried out about different methods to investigate the optimal operation model, including dynamic programming algorithm and neural network algorithm based on improved computer technique. Also, there is much theoretical analysis about location problem since 1990. John Current and Morton O'Kelly(1992) suggested using a modified version of the set covering location model, which still didn’t take the reality into account.2 Assumptions and JustificationsTo simplify our problems, we make the following basic assumptions, each of which is properly justified.●The dam system is built downstream in the valley of the Kariba Dam. Because it’smore convenient to build and also with less cost, which can be easily implemented.●The cost of the dam is mostly the same. Owing to the fact that the length of the canyonis not large(24km),geological conditions and climate conditions are mostly the same.● Each dam’s water supply is mostly the same. Taking into account of safe operation ofthe entire multi-dam system, we should make the burden of each dam to be the same as much as possible.● The water quality of the dam system is the average of the water quality between thetwo reservoirs. The river is flowing, so the water quality is mostly similar.● Water of the dams downstream only comes from dams upstream and naturalprecipitation. According to Google Maps, there are no tributaries near the canyon. Also with the principle of conservation of water, the formula should be maintained.3 NotationAbbreviation Description{}12,,m Y y y y = The set of cities{}12=,,n X x x x The set of dams(,)i n d y X The distance from the th i city to the nearest smaller dami Ele The electricity demand of th i cityi Wat The water demand of th i city(,)W t i The discharge amount of the th i dam at the end of period t,(,)Z t i The total amount of water released during period t(,)T t i The amount of natural water in period tij V The volume in the th j period of the th i damij Q The inflow in the th j period of the th i damij q The discharge volume in the th j period of the th i damij QJ The runoff volume between the th i dam and the (1)th i -damij S The actual water supply th i dam in the th j periodij D The planned water supply of the th i dam in the th j periodij H The hydraulic head of th i dam in the th j periodi K The fore-voltage factor of the th i damt λ The discharge flow indicators in the th t periodt μ The storage capacity indicators in the th t period4 Model OverviewTo provide a detailed analysis of the option (3)-removing the Kariba dam and newly building ten to twenty smaller dams. We need to determine the number and location of the multiple dams first. And on that basis we must establish a model to modulate the water flow through the multiple dam system to adapt to different situations. A reasonable balance between safety and cost of our strategy is also needed.Our first model allows us to determine the number and the location of the multiple dams. We regard the optimal problem as a set covering problem and establish a multi-objective model to solve the problem. There are two goals, namely improving water resources management capacity and reducing the cost. And there are also some constraints including water balance, water level, safety, water resources protection and number constraints. On the account that the optimal problem is difficult to solve in polynomial time, so we use genetic algorithm to get the solution.After determining the numbers and the location, we establish a joint operation of dam system model to gain a strategy about modulating water flow in different condition. Though it’s also a multi-objective problem, it is different from the previous model. We use the maximization of economic and social benefits as the objective and set some constraints, such as water balance, reservoir capacity and discharge flow constraints. We use genetic algorithm to get themodulating strategy in different conditions.In conclusion, we use programming and heuristic algorithm to solve the problem of building dams and the modulating strategy. It’s relatively easy to achieve and it has a significant guidance for the reality.5 Model Theory5.1 Determination of the Number and Location of the Dams5.1.1 Establishment of the modelThe construction of dams needs to consider many aspects, while at the same time it is subject to economic, social, environmental constraints and other factors. In order to obtain the proper number of dams and their location, we establish a multi-objective model.The Objective● Improve Water Resources Management CapacityThe purpose of building smaller dams instead of larger dams is to manage water resources better, mainly to satisfy dweller’s demand for the electricity consumption and water consumption (Including agricultural, industrial and domestic water) of the neighboring cities. Demand may vary between cities, but it is clear that for cities with greater demand, the dam should be built closer to them. so we get that1min (,)mi i n i Ele d y X =∑1min (,)mi i n i Wat d y X =∑● Reduce the CostOn the basis of ensuring the water supply and power supply, we should minimize the cost of our plan. The whole cost consists of the removal of the Kariba dam and building new smaller dams. Since the cost of removal is fixed, so we only consider the variable cost(building cost), which is only related to the number of dams. So we should minimize the quantity of the smaller dams.min nThe Constraints● Water Balance()(,)(1,)(,)(,)k i W t i W t i Z t k T t i π∈=-++∑(,)W t i ,(,)Z t i and (,)T t i represent the discharge amount of the th i dam at the end of periodt, the total amount of water released during period t and the amount of natural water in period t respectively.()i π denotes the set of all higher dams of th i dam. If ()i π is empty, the corresponding summation is zero.[2]● Water LevelThe water level in the dam area should be kept between the dead water level and the limited water level in the flood season. Dead Water Level, namely the lowest water level that allows a reservoir to fall off under normal operating conditions. Flood limited water level is the requirements of control over flood to limit reservoirs’ water storage.DWL WL FWL ≤≤● SafetyThe construction of multiple smaller dams is at least as safe as the original larger dams. The safety considerations for dam construction mainly include reducing the probability of dam failure, thereby reducing damage to dams downstream and enhancing resistance ability to extreme weather.sd Bd Safety Safety ≥sd Safety represents the safety of multiple dams system, while Bd Safety denotes the safety ofthe existing Kariba dam.● Water Resources ProtectionThe construction of smaller dams should require a higher degree of protection for the water resources as the replacement of the existing dam.sd Bd WRP WRP ≥sd WRP represents the environment protection of the multiple dams system, while Bd WRP denotes the environment protection of the existing Kariba dam.● NumberThe number of small dams should be greater than ten and less than twenty. Option 3 is replacing the Kariba dam with a series of ten to twenty smaller dams.To ensure the continuity of the model establishment, the parameters of the constraints will be described in the next part. And in the sixth section, we will clarify how to calculate the demand of electricity(i Ele ),the demand of the water(i Wat ),the safety of different dams and theenvironment protection of different dams.To sum up, we model the problem about smaller dams’ number and location decision with multi-objective optimization. The formulas of this model is1min (,)mi i n i Ele d y X =∑1min (,)m i i n i Wat d y X =∑min n..S t ()(,)(1,)(,)(,)k i W t i W t i Z t k T t i π∈=-++∑ DWL WL FWL ≤≤sd Bd Safety Safety ≥sd Bd WRP WRP ≥1020n ≤≤(n=10, 11, 12…..20)5.1.2 The Parameter of the Constraints● The Demand of ElectricityThe power demand of a city is mainly related to its economic and demographic factors. Our paper uses the city's latest available GDP data as the representative of its economic factors, and the total urban population as the representative of its demographic factor.The GDP of the th i city is i GDP .The population of the th i city is i pop .● The Demand of WaterThe water consumption of residents is mainly affected by residents' income, water price and other factors. Since within a country, the price difference is relatively small, so here we ignore the price difference.. Therefore, the water consumption of urban residents is mainly affected by the income of residents, We use the city's GNI to represent its urban residents. The GNI of the th i city is i GNI .● The Safety of Dams and the Kariba Dam [3]For the safety of dam construction, our paper mainly consider the index of risk loss as the agent of its safety indicators.For a single Big dam, its Risk Loss Index(RLI) Bd R equals to P multiply N . P is the failure probability of the dam beyond the current code standard. For example, the current code specifies that if a dam's seismic safety standard is 50 years beyond 10%, the probability offailure exceeding the current code specification is 0.1 / 50 = 0.002.N is the life loss of dam failure (we can convert economic loss into life loss in a certain percentage). We use the Dekay & McClelland method to calculate the loss. Thus, the RLI of the Kariba dam is()()Bd R P K N K =⋅.For multiple dam system, the RLI of the th j dam is1()()(|)()()nj l j R P j N j P l j P j N l =+=⋅+⋅⋅∑and the RLI of the multiple dam system is 1nsdsdj j R R ==∑ The safety of the multiple dam system should be greater than or at least equal to the safety of the existing Kariba dam. So we get that sd BdR R ≤, that is to say 1()()nsd i i R P K N K =≤⋅∑.And n is an integer greater than ten and less than twenty● The water resources protection of damsAccording to the International Commission On Large Dams(ICOLD), there are three goals of water resources management [4]✓ Improved management of the water supply✓ Improved water quality in our rivers✓ Improved environmental conditions in the watershedSince there are few branches in the Kariba Gorge, we mainly consider the management of the water supply and the water quality.According to the constraints, the water supply of the multiple-dam system should be greater than the big dam. That is to saysd Bd WS WS ≥sd WS equals to the number of the smaller dams multiply the water supply of a smaller dam,while Bd WS represents the water supply of the Kariba Dam.Besides, the water quality of the multiple-dam system should be greater than the Kariba dam.sd Bd WQ WQ ≥,sd WQ represents the expected average water quality of the Lake Kariba if the authority adoptthe option three, while Bd WQ represents the present water quality of the Lake Kariba.5.2 Joint Operation of Dam System ModelJoint operation of dam system can utilize the differences between dam capacity and hydrologic condition, so that we develop a joint compensation effect for the dam group and make full use of water resources. Compared with the traditional single large dam, the dam group establish on the basis of multi –dam system, which could help us take advantage of water resources for our social benefits, including economic and social benefits. Therefore, it is necessary to establish an effective water resources dispatching scheme.In order to better express our model ,we let 1...i n =indicates the number of dams , 1...j T =denotes the cycle of water dispatching ,ij V illustrates the th i dam ’s water storage during theth j period.[5]The ObjectiveThe hydropower station mainly bring about economic and social benefits. But obviously, hydropower station can bring magnificent economic benefits. Among them, the most direct indication is the dam power generation. Therefore, taking the reservoir power generation as the revelation of economic benefit.11***n Te i ij ij i j I K q H t ===∆∑∑ij q is the discharge flow of the th i dam in the th j period ,ij H is the hydraulic head of th i dam in the th j period ,i K is the force-voltage factor of the th i dam ,t ∆is the time period.In addition to creating enormous economic benefits, a large dam can also bring huge social benefits. Through the construction of dams, it can meet the need of a large number of industrial and agricultural water, also the domestic water.11()n Ts ij ij i i I S D ===-∑∑ij S is the actual water supply th i dam in the th t stage ,ij D is water demand or planned water supply of the th i dam in the th t stage.Therefore, we should make full use of water resources so as to make the economic and social benefits as large as possible.[6]max()e s I I I =+The Constraints● Water Balance,(1)()i t it it it it V V Q q t L +=+-⋅∆-,(1)(1),i t i t it Q q QJ +-=+it Q 、ij q are the average inflow into the dam and discharge volume in the th t period of the th i dam,it L is the evaporation and leakage loss.it QJ is the runoff volume between the th i dam and the th j dam.● Capacity of the DamTo prevent floods and droughts ,The capacity of each dam must be limited.min max i it i V V V ≤≤min i V 、max i V are the upper and lower limit of the th i dam’s water storage ,namely the dead capacity and the flood control capacity.● Discharge Flow ConstraintIn order to keep the normal life standard and to maintain the downstream ecological water use, we must ensure the certain discharge of water, we employ min i q to indicate the minimal discharge of water. Because of the limitation of the dam itself and the purpose of flood control, there need to be a maximal discharge capacity constraint max i qm max i it i q in q q ≤≤In conclusion, in order to make economic benefit and social benefit as large as possible while satisfying the constraint conditions, we need to develop water resources optimized dispatching scheme.1111max ***()n T n Ti ij ij ij ij i j i i I K q H t S D =====∆+-∑∑∑∑,(1),(1)(1),()*..min max m max i t it it it iti t i t it i it i i it i V V Q q t L Q q QJ s t V V V q in q q ++-=+-∆-⎧⎪=+⎪⎨≤≤⎪⎪≤≤⎩it V 、it q are the interval-type variable ,min i V 、min i q correspond to meet the basic industrial and agricultural water 、domestic water and ecological water ,they are the dead water level. For safety considerations such as flood control ,max i V 、max i q are the maximal water level. We let [,]i i Vf VF to be the of it V ,[,]i i qf qF is the optimum interval of it q .[7]1()/(min ),min 1,1()/(max ),max 0,i it i i i it ii it i it it i i i i it iVf V Vf V V V Vf Vf V VF V VF V VF VF V V else λ---≤≤⎧⎪≤≤⎪=⎨---≤≤⎪⎪⎩ 11N t it i N λλ==∑ 1()/(min ),min 1,1()/(max ),max 0,i it i i i it ii it i it it i i i i it i qf q qf q q q qf qf q qF q qF q qF qF q q else μ---≤≤⎧⎪≤≤⎪=⎨---≤≤⎪⎪⎩ 11N t it i N μμ==∑ 6 Model Implementation and Results6.1 The Number and LocationMeasuring the demand of the nearby cityTOPSIS (Technique for Order Preference by Similarity to an Ideal Solution) is a commonly used and effective method in multi-objective decision analysis. Hence ,we employ this model and then investigate extended TOPSIS to evaluate the demand of electricity and water of each city.Then we use the data to calculate the demand of the electricity and water with TOPSIS, and part of the results is shown in Table 1.Table 1 The Demand of Electricity and WaterCalculate the shortest distance from each dam to each cityThe dam should be built in the valley of the river fully, because the project is small with low cost. Moreover, the construction of small dams is mainly to replace the larger dam, so the small dam should be constructed mainly in the downstream of the Kariba dam in the canyon. Figure 1 is the suitable site for building dams.Figure 1 The Suitable Gorge for Building DamsWith respect to the option 3 that we need to construct 10 to 20 small dams, considering the geological factors around the dam, we first select the suitable location of the 20 dams.According to our model, we use the distance from the dam to the center of the city as a representative of the distance to the city. A total of 25 cities are selected close to the Kariba gorge, including 15 cities in Zambia, 10 cities in Zimbabwe. We search and calculate the shortest distance and path of each dam to the city through Google maps, and the results of some small dams to the cities are shown in Table 2.Table 2 The Distance Between the Dams and the City(Part)● The Data of Other FactorsAt the same time, we collect the data of other related factors through the Zambia National Bureau of Statistics, the World Bank, the World Commission on Dams and other institutions to gain the relevant statistics.Table 3 The Data of Other FactorsDWL NWL FWL BFWL RLI WS WQ Kariba 475.5 484.6 490 476.7 9000 608.5 19 Multiple 382 408 412 385 1n sd i i R=∑ e WS n ⋅ e WQUnder normal circumstances the water level should be higher than the dead water level, and lower than the normal position. But before the flood season, the water level is lower than the limit of water level.● The numbers and the locationThis optimal problem belongs to the NP-hard problem. We can’t solve it in polynomial time. So we can only use heuristic algorithms such as artificial neural networks, genetic algorithm, simulated annealing to obtain the approximate solution. In this paper, we select the genetic algorithm to solve the problem.We run the program repeatedly, and finally get a relatively good result and determine our number and location of the dams. There should be 12 smaller dams in the Kariba Gorge. Besides, we select the optimal 12 dam location to maximize our objective function from 20 appropriatedam sites. The sixth and twelfth site locations are listed in the Table 4Table 4 The Location of the DamAt the same time, we will also mark the location of the small dam on the map, we put the location of the sixth and twelfth dam on the map. We can see it on the Figure 2 andFigure 3Figure 2 The Location of the 6th Dam Figure 3 The Location of the 12th Dam 6.2 The Strategy of Modulating Water FlowTraditional optimization algorithm mostly belongs to the convex optimization category. It demands a unique global optimal solution, which is often used in practical applications. A number of heuristic intelligent algorithm, for example genetic algorithm etc.These methods show that the algorithm can work out satisfactory results for solving the optimization problem. Employing joint operation of dam system model, we use genetic algorithm and Matlab2014 for the solution.[8]By running the genetic algorithm and adjusting the parameters, we obtain a relatively satisfactory result, and then develop a joint operation of dam system model.(The picture of the results is shown in the appendix part four.)Normal Flow Year:Take the climate and hydrological conditions of the average of nearly5 years to simulate normal climatic conditions.In normal years, the water resources dispatching of the dam system shows obvious seasonal difference. In the dry season from June to September, the discharge of each reservoir reaches the bottom line. Compared with the middle and lower reaches of the river, upper and middlereaches of water resources and reserves are relatively abundant, therefore, still a lot of water could be scheduled downstream. But until the rainy season from November to March, the precipitation intensity and the discharge of each dam are very large. The results show that the discharge index and storage capacity index perform better in May and October, which are in the optimum range, while the other month are all above 0.7, this is a satisfactory result.●Low Flow Year: The monthly precipitation is taken as the highest value in the past 30years, simulating the more serious flood threat..When the annual precipitation decreases, each dam discharge is significantly lower, but the discharge index and the capacity index is still above 0.7, which reflects the joint operation of dam system still has obvious effect to resist abnormal weather like the drought condition.●High Flow Year:The monthly precipitation is taken as the highest value inthe past 30years, simulating the more serious flood threat.When the annual precipitation has increased significantly, then the reservoir’s discharge would increase. While the discharge of the rainy season increases a lot, but in dry season the increase range is smaller, which makes the discharge capacity index and volume index increase significantly from May to September. Although the index decreases significantly in November and February the figure are more than 0.7, is still relatively satisfactory.●Differentiation Year:The precipitation from May to September is taken as the lowestvalue in the past 30 years, the precipitation from October to April was taken as the highest value in the past 30 years. So that we could simulate drought, flood significantly differentiated condition..When confronted with the differentiation year where there comes rainy season when the precipitation increases and the dry season when the precipitation decreases all come about in one year. The discharge flow of each reservoir expands seasonally, which makes the discharge index and storage capacity index of each month decrease, and it is more obvious in the rainy season. Which can not be ignored is that the discharge flow indicators and storage capacity indicators remained at 0.7 or more.[9]7. Sensitivity Analysis7.1 The Model of Determination of the Number and Location●Remove an important city of both countriesIn the questions we discussed above,we have selected 15 cities in Zambia,10 cities in Zimbabwe to specify the number and placement of the newly built smaller dams. Among the sensitivity analysis, we remove important cities of the two countries, thus, we could see whether this movement would influence the number and placement of constructing dams.In our analysis, we leave out Lusaka (The capital city of Zambia) and Harare(The capital city of Zimbabwe) from our original cities, yet, we still use the multi objective optimization model and genetic algorithm we already established to calculate the number and placement of smaller dams. We discover that the optimal number of constructing dams is also 12, but the location of each dam is slightly changed. Just the fourth and the eleventh dam’s place changes a lot, while other dam’s place just changes a little. Therefore, we list the location of the fourth and the eleventh dam’s site in Table 5.。