
图标类变化趋势写作专项辅导
- 格式:ppt
- 大小:104.00 KB
- 文档页数:15

图标趋势英文作文英文:Icon trends are constantly changing in today's digital age. As a user, I have noticed that icons have become more simplistic and minimalistic over time. The use of bright colors and bold lines has also become more prevalent in recent years.One example of this trend can be seen in the evolution of social media icons. In the early days of social media, icons were often complex and detailed, with intricate designs and multiple colors. However, as social media platforms became more streamlined and user-friendly, the icons also became simpler and more recognizable. For example, the Facebook icon used to feature a complex design with multiple shades of blue and white, but now it is a simple blue and white "f" on a blue background.Another example of this trend can be seen in the iconsused for mobile apps. In the past, icons for apps wereoften detailed and complex, with multiple colors and designs. However, as mobile devices became more prevalent and users began to use multiple apps on a daily basis, the icons became more minimalist and recognizable. For example, the Instagram icon used to feature a detailed camera design, but now it is a simple camera outline on a pink background.Overall, the trend towards simplistic and minimalistic icons is driven by the need for quick recognition and easeof use. As users become more accustomed to using digital devices and apps, they expect icons to be easily recognizable and intuitive.中文:在当今数字时代,图标趋势不断变化。

书面表达讲解与训练(2)图表类写作[如何写图表作文]第一,审题时,除了要把握好图表的表层信息外,还要分析图标的深层含义,如原因、根源、可能的发展趋势等。
图表中所提供的说明文字往往是问题的切入点,一定要仔细分析。
第二,描述数据时要抓住重点,为中心服务,不必面面俱到,切忌毫无目的地罗列图表中的数据。
如果数据较多,抓住图表中的极端点(如最大或最小、最多或最少,最好或最差)和基本相同进行描述。
第三,主题句应明确,最好放在文章的开头,这样会使重点突出,主题明了。
[常见格式]第一段:描述图标(注意下面的常用表达用语)第二段:分析原因(简单直接,不需要过多扩展)第三段:个人观点,结尾(也不需要太多描写,需要见到明了)[常见的表达用语](1)常用表达句式:(横线部分的句式,用于描述图标信息的;记住,多套用)The table shows/indicates that a great number of people spent their holidays traveling abroad. 图标显示许,多人在国外度假As we can see from the graph that the rate dropped slightly from 38% in 1993 to 31% in 2003.… 从图标可以看出,比例有稍微的减少,从1993年的38%降到了2003年的31% From the table we can find out that only 35% of the people have taken in physical activities.… 从图标可以看出,只有35%的人参加了体育锻炼According to Chart I, the number was ten times as many as in 1995. 根据图标一,…As can be seen from the chart that, only 10% of the time is taken up with sports activities.…As is shown in the chart, the production last month rose so significantly…As is described in the chart, the total number of visitors to the United States had nearly doubled to 2.7 million person by 1974.It is clear from the chart that as incomes increase people can afford to live more comfortably and eat well.(2)表示上升的:(注意例句表达方式,记下来,写作的时候多套用)go up to/ climb to/ increase to/ rise to/jump to如:The population of this city has been increasing so rapidly that it has now jumped to 5 million. 这个城市的人口增加如此的快,以至于现在涨到了五百万There was a rapid increase between 1993 and 1994, and the number then went up to five million in 1995. 1993到1994年有快速的增加,1995年的时候数字涨到了五百万。

图表类型 -图表(graph/diagram)包括柱状图(bar/column chart)、表格(table)、饼状图(pie chart)、折线图(line chart)、曲线图(curve chart)、流程图(flow chart)、组图(a set of charts)等。
如果考试的时候不会写某个具体图表的英译,可以用graph/diagram泛指所有图表。
graph n.图表;代表声音单位(或其他言语特征)的书写符号;坐标图v.用图标示;绘图diagramn.图解;简图;示意图;几何图形;火车运行时间图v.以图表示;根据火车运行时间图来安排(火车的)运行时间- 写作思路 -第一段:描述图表第二段:说明图表数据增长or下降的原因。
第三段:表达自己对此现象的看法以及面对此现象我们该怎么去做。
(具体写不写第二段和第三段要看作文要求,如果作文direction里写明了你要“interpret the chart and give your comments”,那就一定别忘了写第二段和第三段,如果只是让“interpret the chart”,那在作文结尾写一两句第二段和第三段的内容或者不写即可)嵌套饼状图的写作思路第一部分思路:从饼状图中我们可以了解到xx是怎样的,其中百分之几是A,百分之几是B,B中a占多少,b占多少,c占多少。
第二部分思路:图表数据说明了什么,我的看法是什么。
(一般图表给的数据多比较复杂,作文就描述图表数据的篇幅多一些。
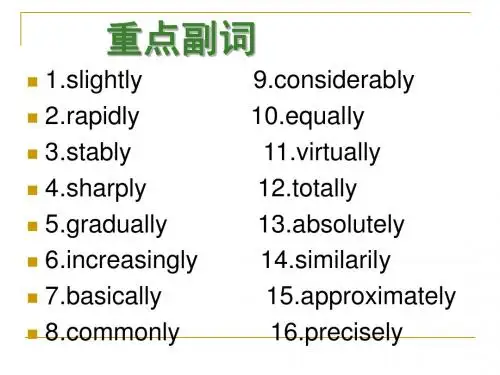
如果图表给的数据很简单,比如21年12月的六级作文真题,就给了个单条折线图,那描述图表数据的篇幅可以小一些,重点放在分析图表数据变化的原因上,当然最重要的还是依照作文的direction来,即看作文题目到底让写什么,到底让怎么写,审题是最重要的)- 第一段常用表达 -1. 描述图表变化趋势的表达上升(v):increase; go up; rise; improve; grow; jump; rocket; soar; surge; shoot up(猛增); climb; ascend; leap; skyroket; proliferate上升(n):increase; rise; growth; jump; surge; upturn; leap下降(v):fall; drop; decrease; decline; go down; sink; dip;plummet; descend; diminish; dwindle; shrink; slupm; plunge; dive; nosedive下降(n):decrease, decline, fall, reduction, drop, slowdown, slump, plunge, dive, nosedive波动(v):fluctuate, vary, wave波动(n):fluctuation, variation波动(词组):range / vary from xx to xx,go up and down, ups and downs稳定在一个水平上(v):remain, keep, stay, maintain, stabilize, stagnate稳定在一个水平上(adj):stable, steady, constant, unchanged稳定在一个水平上(n):stagnation; stability; steadiness; plateau稳定在一个水平上 (词组):hove at; remain the same trend; remain stable; remain constant; reach a plateau at; stabilize at多条曲线趋势一致:A and B share the same trend; the trend of A happens to coincide with B2. 描述图表变化程度的表达变化程度很大:副词:significantly;considerably;rapidly;sharply;dramatically;drastically;enormously;substantially;markedly;steeply; greatly; massively; hugely; precipitously形容词:striking/ skyrocketing/ twofold(两倍的)/ threefold(三倍的)/ considerable/ steep词组:at an alarming rate, by/in leaps and bounds, by a wide/significant margin变化程度较轻:副词:slightly;gradually;slowly;steadily;moderately; marginally; modestly 形容词:steady/moderate/slow/slight/gradual词组:in a moderate way, by a narrow margin3. 极值类和组成构成的表达(hit/register/arrive at/stand at/increase to都可以替换掉reach)(top/summit/zenith/highest point都可以替换掉peak)eg:reach the peak of xx最低点:reach the bottom(drop/hit/register/arrive at/stand at/decrease to都可以替换掉reach)(trough/lowest point都可以替换掉bottom)eg:reach the bottom of xx占比最多:occupy the largest proportion of xxoccupy=make up=take up=account forproportion=number=percentage占比最少:occupy the smallest proportion of xxoccupy=make up=take up=account forproportion=number=percentage由…组成:comprise, consist of, be made up of,be composed of组成,构成:constitute, make up,form, occupy, account for, represent4. "大约"/"超过"/"不足"和预测类的表达方式大约:about/around/approximately/roughly/nearly/almost/just + 数字over/just under/close to/in the region of + 数字数字+ or so/or thereabouts数字+or thereabouts超过:more than + 数字over + 数字不足:no more than + 数字less than + 数字within + 数字under + 数字预测(v):expect, predict, project, forecast预测(句式):xx is expected/predicted/projected/forecasted to reach …5. "表达/阐述/说明/展示/体现"的表达方式display/represent/demonstrate/show/convey/illustrate/indicate/describe/embody/ reflect/reveal/outline/delineate/depict/expound/elaborate6. 常用句型①描述上升到多少:The mobile-phone subscriptions soared to 4 billion in 2008.②描述从多少上升到多少:Conversely, the urban population saw a risingtrend, growing from only 300 million to 680 million by 2010.③描述A的上升和B的下降:Domestic cars had a dramatic increase in the market share, as high as 9.8%, while/whereas(然而)Japanese cars declined by nearly 10%.(by+数据,就是上升/下降了多少,例如declined by nearly 10%就是下降了将近10%,to+数据,是指上升/下降到多少)④描述xx数据排第几:The amount of underground water ranks the second ,the percentage being 30.2%.⑤描述最大占比:We cannot fail to see that the biggest share is acquiring knowledge, with a proportion as high as 59.5%.We cannot fail to see that the biggest share is acquiring knowledge, accounting for 59.5%.⑥分别描述比例:Meanwhile, it is also not difficult to find that service, environment, price and other factors occupy 26.8%, 23.8%, 8.4% and 4.7% respectively(分别地).⑦描述两者之间的比较:The data show a comparison between the amountof Red wine that is consumed and the rates of US birth.In comparison with A, Bis …⑧描述倍数:A is three times as much as B …The graph shows a threefold increase in number of…The total number in 2012, which is 8,318, is about two times as much as the total number in 2008.A is twice as much as B.- 第二段常用表达 -1. 表述原因总起句There are many reasons explaining this phenomenon.Three major reasons give rise to the phenomenon mentioned above.2. 分条描述原因(主要原因)The main reason is that due to (the progress in economy / the improvement of living standards), a growing number of people ……(第二个原因)What is more, there is no doubt in saying that , with (the pace of modern society speeding up / the advance of technology) , a majority of people (try their best to catch up with the times and improve themselves)by (pursuing further education).(第三个原因)Thirdly , (under the background of modernization / with the rapid development of economy and society) , xx may have gradually become an unstoppable trend(趋势)in recent years.3. 形容大环境常用的表达方式with the progress in economywith the improvement of living standardswith the pace of modern society speeding upwith the advance of technology with the rapid development of economy and societyunder the background of modernization / urbanization / industrialization- 第三段常用表达 -积极的:Considering all these, I believe that we should take a reasonable attitude toward xx. In conclusion, from my point of view, such a phenomenon is (positive)and (acceptable).积极的:Taking into account what has been argued so far, it is not surprising to see the results in the above diagram. Thus, such phenomenon proves to be quite normal and acceptable. And I believe the trend will not change in the near future.积极的:Definitely, the boom of (the mobile industry) tends to exert a beneficial influence on people’s lives, and hence, it should be, from every aspect,encouraged and further advocated.消极的:In view of the description and analysis above, I’m convinced that actions have to be taken to cope with the problems arising from ……趋势预测:From what has been discussed above, a trend can be predicted from the chart that ……趋势预测:XX will be a growing trend in today's (busy)society.真题巩固2024年浦东新区初三一模英语作文84. Write at least 60 words according to the given situation(根据以下情境写一篇不少于60 个词的短文,标点符号不占格)学校报社做了一次有关学生如何使用零花钱的调查。
图表作文本节内容一)图表作文写作要求图表作文就是把非文字信息(通常为各种图表表示的数字信息等)转换成文字信息的一种作文。
它要求我们用文字来描述非文字性的图表或对图表显示的关系作解释说明。
图表作文一般在题目中给出作文的标题和一个或几个统计表格、圆图形、曲线图或条形图,有时还用英文或中文提纲的形式给出提示,具体要求:1. 用文字描述图表,客观解释图表中所传递的信息,并找出某种规律或趋势;2. 就图表中所反映的某种趋势或问题分析其原因或后果。
图表作文着重说明事实,常常通过对图表中所反映的具体数据的说明、分析、比较,对某种事物或现象的事实或变化情况等加以说明,并提出结论或看法。
因此,图表作文常常采用议论文的写作方法。
二)写作步骤1.仔细阅读图表,了解图表所达的内容。
首先,用一句话概括图标的内容。
2.描写图表所反映的问题或规律3.结尾部分得出结论,表述自己的观点,结束全文。
(1)如果图表反映的是好的现象,首先要肯定、发表观点最后预测未来;(2)如果图表反映的是不好的现象,首先要否定、提出解决办法或建议三)写作实用表达(一)点明主题引用具体或粗略的数据,然后作出概括性分析,点名主题或引出需要论述的问题。
常用的词有:1.泛指一份数据图表:a data graph/chart/diagram/illustration/table饼图:pie chart 表格图:table 柱形图:bar chart趋势曲线图:line chart / curve diagram2.describe, show, represent, illustrate, reveal等等。
3. figure, statistic, number, percentage, proportion常用的开篇句型(即概述图表内容时常用的表达法)1.The graph/chart/table above shows / describes / illustrates that.....2. From the above graph/chart, it can be seen that…3. As is shown in the graph…4.The chart/table shows the differences between…5. According to the table/pie chart/ graph/bar graph, we can see/conclude that …(二)分析差异描写变化及总趋势特征、分析差异:数据说明常用套语:1.There was a great /slight increase /rise in…2.The number /rate has nearly doubled, compared with that of last year.3.The number is …times as much as that of….原因说明常用套语:1.The reason for…is that…2.The change results from the fact that…3.There are several causes for this significant growth in…. To begin with .... In addition/ Furthermore/ Moreover,...4. There are many factors that may account for...but the following are...(三)得出结论结尾常用套语1. Personally/ as far as I’m concerned/ in short/ in brief/ in conclusion /in summary2. It’s clear/evident from the chart that… / We can draw the conclusion that…3. From what has been discussed above/Taking into account all these factors, we can draw the conclusion that…4. There is no doubt that special attention must be paid to the problem of...5. It is high time that we put an end to the tendency of...图表作文常用单词、词组和句型总结:1)表示数据变化的单词或词组rapid/ rapidly 迅速的,飞快的,dramatic/ dramatically 急剧的sharp /sharply 明显的,急剧的significant/ significantly 重大的sradual/ gradually 渐进的,逐渐的steady / steadily 稳固的stable / stably 稳定的slow /slowly 缓慢的slight / slightly 略微的2)在描述中常用到的词汇significant changes 图中一些较大变化noticeable trend 明显趋势distribute 分配in terms of/ regarding/ with regard to/ as far as sth is concerned 关于,就...而言3) 描述增减变化常用的句型Compared with … is still increased by …The number of … grew/rose from … to …An increase is shown in …; then came a sharp increase of …In … the number remains the same/drops to …There was a very slight (small/slow/gradual) rise/increase in ......There was a very steady (marked/sharp/rapid/sudden/dramatic) drop (decrease/decline/fall/reduction) in ....../ compared with that of last year).4) 图表作文常用句型精选1. The table shows the changes in the number of.....over the period from....to......该表格描述了在...年至...年间...数量的变化。