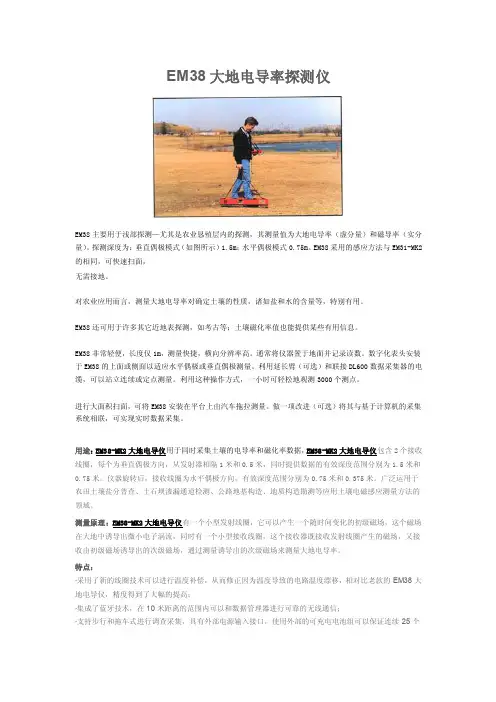
EM38大地电导率仪-土壤特性
- 格式:pdf
- 大小:315.71 KB
- 文档页数:2
生态学报2011,31(8):2196—2202Acta Ecologica Sinica禹城市耕地土壤盐分与有机质的指示克里格分析杨奇勇,杨劲松*,余世鹏(中国科学院南京土壤研究所,江苏南京210008)摘要:针对目前黄淮海平原盐渍土改良区存在的土壤盐碱、瘠薄等障碍问题,以该区域典型县域禹城市为研究对象,综合运用GIS和非参数地质统计学的指示克立格法,对0-20cm深度的耕地土壤盐分和有机质的空间变异性进行了分析,并给出了土壤盐分和有机质满足一定阈值条件的概率分布图。
结果表明,土壤盐分和有机质采用指示克里格方法都可以获得较为稳健的变异函数;受结构性因素与随机性因素共同影响,它们的指示半方差均表现为中等强度的空间自相关性,且单元指示克里格与多元指示克里格插值结果表明,土壤盐分、有机质的概率分布存在空间上的规律性与相似性;在空间分布上,研究区域土壤盐分含量高和有机质含量低的高概率区域主要分布在西北部的张庄镇、西部的房寺镇以及南部的莒镇乡等地区,该区域有一定的次生盐渍化风险;而土壤盐分含量高和有机质含量低的低概率分布区域主要分在徒骇河流经的河滩高地,土壤类型为褐土化潮土,是研究区域的主要高产区,基本无盐渍化。
研究获取的综合指示概率分布图和概率风险评价对土壤可持续利用管理具有重要意义,为区域土壤质量的提高和土壤障碍因子消减提供参考。
关键词:土壤;盐分;有机质;空间变异;指示克里格Evaluation on spatial distribution of soil salinity and soil organic matter by indicator Kriging in Yucheng CityYANG Qiyong,YANG Jingsong*,YU ShipengInstitute of Soil Science,Chinese Academy of Sciences,Nanjing210008,ChinaAbstract:Soil salinization and low soil fertility are the key limiting factors for soil improvement in the Huanghuaihai Plain at present.To evaluate the spatial variation of soil salinization and fertility,we used GIS and indicator Kriging of nonparametric geostatistics to analyze the spatial distribution of soil salinity content and organic matter content in top20cm soils for a typical county located in Huanghuaihai Plain,Yucheng City,northwest of Shandong province.The probability maps for soil salinity content and organic matter content that met the given thresholds(soil salinity threshold is0.29dS/m,organic matter threshold is15g/kg)were presented.The results indicated that the indicator Kriging method was able to produce stable semivariograms for both soil salinity content(greater than0.29dS/m)and organic matter content(less than 15g/kg),which exhibited moderate spatial autocorrelation due to the combined effects of structural and stochastic factors in our study area.Both univariate indicator Kriging and multiple-variable indicator Kriging(soil salinity greater than0.29dS/ m and organic matter less than15g/kg)interpolation maps showed that the probability distribution of soil salinity and organic matter was regular and similar in spatial variation.Specifically,high soil salinity content and low soil organic matter content occurred at northwest(Zhangzhuang Town),west(Fangsi Town)and south(Juzheng Town)of the study area,in which the soils to some degree suffered from secondary salinization risk.In addition,high soil salinity content and low soil organic matter content occurred at the high flood plain along the Tuhai river,the major high-yield region in the study area where the soil was classified as alluvial Cinnamon soil and suffered from low salinization risk.Since the integrative probability map as well as its risk assessments are significantly valuable to the management and sustainable use of soil基金项目:公益性行业(农业)科研专项经费项目(200903001);国家自然科学基金项目(40771097);国家科技支撑计划项目课题(2006BAD05B02,2006BAD05B04);国家“863”计划重点项目课题(2007AA091702)收稿日期:2010-04-12;修订日期:2010-06-28*通讯作者Corresponding author.E-mail:jsyang@issas.ac.cn.resource,our results are of great use to the soil improvement in the study area.Key Words:soil;salinity;organic matter;spatial variability;indicator Kriging黄淮海平原是我国中低产田治理的重点区域,区内存在的盐碱、瘠薄、风沙等障碍,严重地制约了农业的可持续发展。
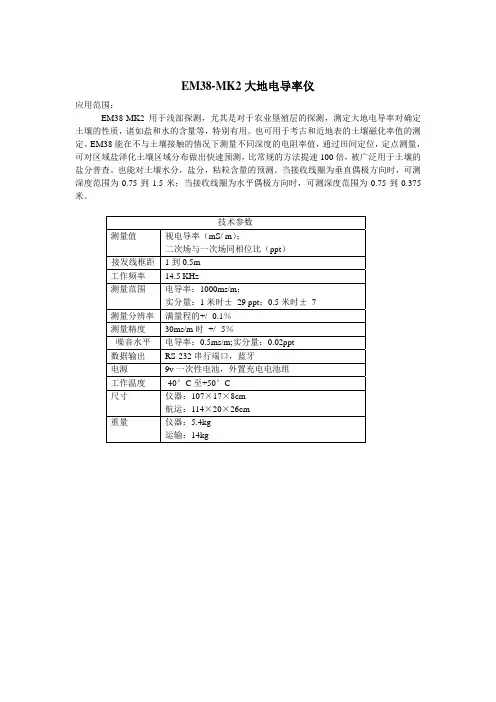
EM38-MK2大地电导率仪
应用范围:
EM38-MK2用于浅部探测,尤其是对于农业垦殖层的探测,测定大地电导率对确定土壤的性质,诸如盐和水的含量等,特别有用。
也可用于考古和近地表的土壤磁化率值的测定。
EM38能在不与土壤接触的情况下测量不同深度的电阻率值,通过田间定位,定点测量,可对区域盐泽化土壤区域分布做出快速预测,比常规的方法提速100倍,被广泛用于土壤的盐分普查。
也能对土壤水分,盐分,粘粒含量的预测。
当接收线圈为垂直偶极方向时,可测深度范围为0.75到1.5米;当接收线圈为水平偶极方向时,可测深度范围为0.75到0.375米。
技术参数
测量值视电导率(mS/ m);
二次场与一次场同相位比(ppt)
接发线框距1到0.5m
KHz
工作频率 14.5
测量范围电导率:1000ms/m;
实分量:1米时± 29 ppt;0.5米时± 7
测量分辨率满量程的+/ -0.1%
测量精度 30ms/m时 +/ -5%
噪音水平电导率:0.5ms/m;实分量:0.02ppt
数据输出 RS-232串行端口,蓝牙
电源 9v一次性电池,外置充电电池组
工作温度 -40°C至+50°C
尺寸仪器:107×17×8cm
航运:114×20×26cm
重量仪器:5.4kg
运输:14kg。
不同土壤电导率测量方法对土壤盐渍化表征的影响张晓光;曾路生;张志辉;刘岩;宋洋;李旭霖【摘要】为比较目前常用的室外便捷式土壤电导率测试仪和室内实验室常用方法之间的差异,本文以黄河三角洲典型县域土壤样品为研究对象,选用了HH2/WET土壤三参数速测仪和室内DDS-308A电导仪测定的电导率数据进行了传统统计学方法以及空间统计方法多方面的比较.结果表明,两种方法所测得的电导率数据存在较大误差,速测结果比室内测量结果高出一个数量级.两类数据作差,误差能够集中在一定范围内,说明误差具有稳定性.在测量数据的准确性方面,DDS-308A电导仪室内的测定数据较为精准.但从空间表达预测方面来看,HH2/ WET速测仪测定的数据预测结果既能体现研究区土壤盐分整体分布趋势,又能刻画细节部分,所以利用速测仪测量土壤盐分更具有优势.由于两类数据存在显著的正相关关系,因而可以根据两者关系构建方程(ECa=0.089×ECb +0.526)对速测数据进行校正后使用,这样既保证了点位精度,又能够详细刻画空间分布特征.【期刊名称】《青岛农业大学学报(自然科学版)》【年(卷),期】2019(036)001【总页数】5页(P56-60)【关键词】土壤电导率;空间分布;克里格;方法比较【作者】张晓光;曾路生;张志辉;刘岩;宋洋;李旭霖【作者单位】青岛农业大学资源与环境学院,山东青岛266109;青岛农业大学资源与环境学院,山东青岛266109;青岛农业大学资源与环境学院,山东青岛266109;青岛农业大学资源与环境学院,山东青岛266109;青岛农业大学资源与环境学院,山东青岛266109;青岛农业大学资源与环境学院,山东青岛266109【正文语种】中文【中图分类】S158土壤盐渍化程度一般用土壤的含盐量来衡量[1]。
对含盐量测量时,可以采用残渣烘干法,也可以采用八大盐分离子加和法求得。
由于土壤电导率和含盐量有着极其密切的关系,所以土壤含盐量的高低也可以用土壤电导率来代替表达[1-2],而且这一方法在目前是一种较为普遍的测量方法。

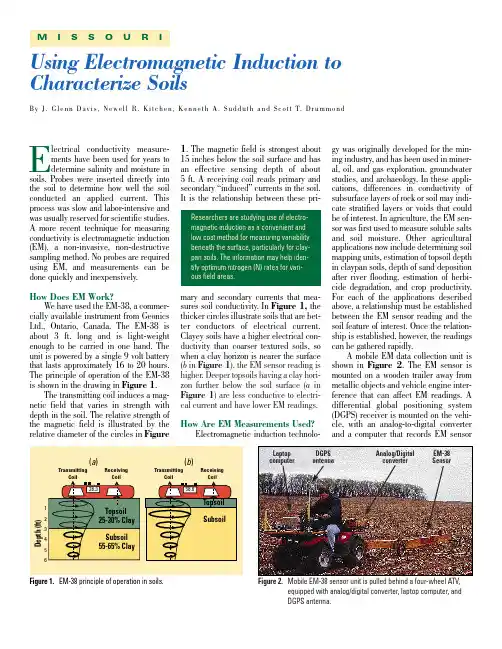
Electrical conductivity measure-ments have been used for years to determine salinity and moisture in soils. Probes were inserted directly into the soil to determine how well the soil conducted an applied current. This process was slow and labor-intensive and was usually reserved for scientific studies.A more recent technique for measuring conductivity is electromagnetic induction (EM), a non-invasive, non-destructive sampling method. No probes are required using EM, and measurements can be done quickly and inexpensively.How Does EM Work?W e have used the EM-38, a commer-cially available instrument from Geonics Ltd., Ontario, Canada. The EM-38 is about 3 ft. long and is light-weight enough to be carried in one hand. The unit is powered by a single 9 volt battery that lasts approximately 16 to 20 hours.The principle of operation of the EM-38is shown in the drawing in Figure 1.The transmitting coil induces a mag-netic field that varies in strength with depth in the soil. The relative strength of the magnetic field is illustrated by the relative diameter of the circles in Figure1. The magnetic field is strongest about 15 inches below the soil surface and has an effective sensing depth of about 5 ft. A receiving coil reads primary and secondary “induced” currents in the soil.It is the relationship between these pri-mary and secondary currents that mea-sures soil conductivity. In Figure 1,the thicker circles illustrate soils that are bet-ter conductors of electrical current.Clayey soils have a higher electrical con-ductivity than coarser textured soils, so when a clay horizon is nearer the surface (b in Figure 1), the EM sensor reading is higher. Deeper topsoils having a clay hori-zon further below the soil surface (a in Figure 1) are less conductive to electri-cal current and have lower EM readings.How Are EM Measurements Used?Electromagnetic induction technolo-gy was originally developed for the min-ing industry, and has been used in miner-al, oil, and gas exploration, groundwater studies, and archaeology. In these appli-cations, differences in conductivity of subsurface layers of rock or soil may indi-cate stratified layers or voids that could be of interest. In agriculture, the EM sen-sor was first used to measure soluble salts and soil moisture. Other agricultural applications now include determining soil mapping units, estimation of topsoil depth in claypan soils, depth of sand deposition after river flooding, estimation of herbi-cide degradation, and crop productivity.For each of the applications described above, a relationship must be established between the EM sensor reading and the soil feature of interest. Once the relation-ship is established, however, the readings can be gathered rapidly.A mobile EM data collection unit is shown in Figure 2. The EM sensor is mounted on a wooden trailer away from metallic objects and vehicle engine inter-ference that can affect EM readings. A differential global positioning system (DGPS) receiver is mounted on the vehi-cle, with an analog-to-digital converter and a computer that records EM sensorFigure 2.Mobile EM-38 sensor unit is pulled behind a four-wheel ATV,equipped with analog/digital converter, laptop computer, and DGPS antenna.EM-38SensorDGPS antennaLaptop computerAnalog/Digital converterM I S S O U R IB y J. G l e n n D a v i s , N e w e l l R. K i t c h e n , K e n n e t h A. S u d d u t h a n d S c o t t T. D r u m m o n dUsing Electromagnetic Induction to Characterize SoilsResearchers are studying use of electro-magnetic induction as a convenient and low cost method for measuring variability beneath the surface, particularly for clay-pan soils. The information may help iden-tify optimum nitrogen (N) rates for vari-ous field areas.Figure 1.EM-38 principle of operation in soils.lished for a whole field, and may be adjusted for previous crop, organic matter content,and/or residual nitrate.Missouri studies have shown that yield goal potential is related to topsoil depth:Yield goal = 98 bu/A + 2.2 x topsoil depth (inches).W e used this relationship to produce a map of yield goal.From this yield goal map we made an N application map. In Figure 5, the EM map is compared to an aerial photo of corn crop cover in late July.Patterns of low EM sensor readings (deeper topsoil)match patterns of darker green crop cover. Areas of shallower topsoil (high EM sensor read-ings) are also areas where cropcover is less dense and yellow-ing due to moisture stress.Using the photo of crop cover,it is easy to see differences in potential productivity within this field and how well patterns of potential productivity are correlated to soil conductivityreadings, using the EM-38.Other work with the EM sensor is ongoing with alluvial and loess soils. These soils do not have the abrupt layer boundaries characteristic of claypan soils. However, soil texture can be related to EM readings and work is continu-ing to relate these readings tocrop response.Dr. Davis is Soil Scientist and Extension Assistant Professor, Univer-sity of Missouri-Columbia; Dr. Kitchen is Soil Scientist, USDA-ARS; Dr.Sudduth is Agricultural Engineer,USDA-ARS; Mr. Drummond is Scientific Programmer/Analyst, Uni-versity of Missouri-Columbia.Reprinted from Better Crops with Plant Food , 1997, No. 4. Published by the Potash & Phosphate Institute (PPI), 655 Engineering Drive, Suite 110, Norcross, GA 30092-2843.Reference Number 323075/98116.readings along with a DGPS ing this equipment, data from whole fields can be taken quickly, and then maps of soil conductivity can be made.Data for a 20-acre field can be collected in about one hour.EM Research on Claypan SoilsClaypan soils are important agricul-tural soils in the southern Corn Belt, cov-ering 10 million acres in seven states.They comprise a significant portion of cropland in Missouri, and can present farmers with difficult management choic-es. They have an abrupt and marked increase in clay content between the upper soil layer and subsoil. The clay content increases by at least 20 percent,and this layer of high clay soil impedes the movement of water and air, restricting the growth of plant roots.Topsoil depth and corn grain yield measured along a field transect is shown in Figure 3. The depth to the claypan layer varies from a few inches to more than 40 inches, and it is apparent that grain yield is related to the depth to the claypan layer. Within a field, the varia-tion in depth to the claypan can be seen by spatial patterns in crop water stress.The areas having shallow topsoils (often on eroded side-slopes) are the first to have water-stressed plants. Clearly, hav-ing information on the depth of topsoil would be a valuable tool in tailoring man-agement for crop needs.A management example using N fer-tilizer for corn production is shown in Figure 4. The first step is to collect EM sensor data for the field using the mobile EM unit. In this case, transects for EM data were taken at a very close interval (about 15 ft.). In most cases, a transect interval of 40 to 60 ft. gives sufficient data density to map the field. For select-ed points in the field, topsoil depth (mea-sured using a soil probe) and soil con-ductivity (by EM) were determined con-currently. From these data points, a regression equation between EM sensor reading and topsoil depth was calculated to produce a map of topsoil depth for the field. Finally, an N recommendation map was made based on topsoil depth (c in Figure 4). Nitrogen recommendations in Missouri and other Corn Belt states often use expected yield (or yield goal) as one of the parameters for estimating crop N needs. Y ield goals are usually estab-Figure 3.Corn yields and depth to claypan layer along atransect at Centralia, Missouri.Figure 4.EM-38 soil conductivity, topsoil depth, and Nrecommended for corn at Centralia, Missouri.Low EM High EM4 12 20 28 36 inches85 115 145 175 205Figure 5.EM-38 sensor readings (a) and aerial corn cropcover photo (July 25, 1997) at Centralia, Missouri site.。
电磁感应式大地电导率仪在土壤学领域中的应用研究作者:刘虎王振宇魏占民张金龙尹春艳来源:《天津农业科学》2009年第01期摘要:介绍了电磁感应式大地电导率仪的工作原理,回顾和总结了这种仪器在土壤学领域中土壤水分、盐分、粘粒含量等的测定预测方面的研究现状,最后展望了电磁感应式土壤性质测评技术与3S技术相结合后带来的土壤信息动态变化方面的革命。
关键词:磁感式大地电导率仪;土壤信息;3S技术中图分类号:S153.2 文献标识码:A文章编号:1006-6500(2009)01-0055-04Applied Research of Electromagnetic Induction Type Soil Conductivity Meter in the Filed of Soil ScienceLIU Hu1,2,WANG Zhen-yu1,WEI Zhan-min2,ZHANG Jin-long1,YIN Chun-yan3(1.Tianjin Teda Landscape Architecture Company Limited,Tianjin 300457,China;2.Water Conservancy and Civil Engineering College,Inner Mongolia Agriculture University,Hohhot, Inner Mongolia 010018,China;3.Inner Mongolia Wushen Soil and Water Conservation Bureau,Erdos, Inner Mongolia 017300,China)Abstract:The working principle of electromagnetic induction type soil conductivity meter was first explained. Then, the using of this instrument on measuring the soil moisture, the salinity, the clay content and so on in the field of soil science was reviewed and summarized. Finally, the revolution after combination technology of electromagnetic induction measuring and appraising of soil nature with 3S technology was forecasted.Key words: electromagnetic induction type soil electrical conductivity meter;soil information;3S technology土壤属性调查的传统方法是在采样点上使用采样机械采集土壤样本,然后在实验室对土壤各种属性进行分析测定,从而得到相关数据。
多源数据的区域土壤盐渍化精确评估吴亚坤;刘广明;苏里坦;杨劲松【摘要】为精确揭示区域土壤盐分的三维分异特征,将由区域遥感影像解析获得的光谱指数、面域电磁感应大地电导率仪测得的土壤表观电导率和控制点位土壤采样实测数据进行有效耦合,应用多元回归方法建立土壤盐分解译模型,利用反距离权重方法对区域土壤盐分三维特征进行插值解析与评价,创建了基于多源数据的区域土壤盐渍化精确评估方法.应用实践表明:案例研究区域各土层土壤盐分含量的变异系数在1.281~1.527之间,表现为强度变异性;土壤盐分含量高值主要集中在案例研究区域的中西部地带;区域盐渍土剖面类型大部分属“表聚型”,即随着深度增加土壤盐分逐渐减小;对案例研究区域土壤盐分三维特征解析精度达到相关系数为0.908.解决了以往多源数据耦合协同以更高精度解析区域土壤盐分特征的难题,为精确评估区域土壤盐分三维特征和其他地学空间属性解析提供了可靠方法借鉴.【期刊名称】《光谱学与光谱分析》【年(卷),期】2018(038)011【总页数】6页(P3528-3533)【关键词】光谱指数;表观电导率;土壤盐分;三维空间变异【作者】吴亚坤;刘广明;苏里坦;杨劲松【作者单位】安徽工业大学能源与环境学院,安徽马鞍山 243002;土壤与农业可持续发展国家重点实验室(中国科学院南京土壤研究所),江苏南京210008;土壤与农业可持续发展国家重点实验室(中国科学院南京土壤研究所),江苏南京210008;中国科学院新疆生态与地理研究所,新疆乌鲁木齐830011;土壤与农业可持续发展国家重点实验室(中国科学院南京土壤研究所),江苏南京210008【正文语种】中文【中图分类】TP79引言土壤盐渍化是全球主要环境地质灾害之一,开展区域土壤盐渍化的三维土体的精确评估,对于合理开发利用土地资源,抑制土壤盐渍化的发生及发展具有重要的意义[1]。
目前对于区域土壤盐渍化的评估主要应用两种技术,一是遥感影像解译方法[2-4],另一种是电磁感应(EM)电导率仪的测量来获得土壤表观电导率[5-6]。
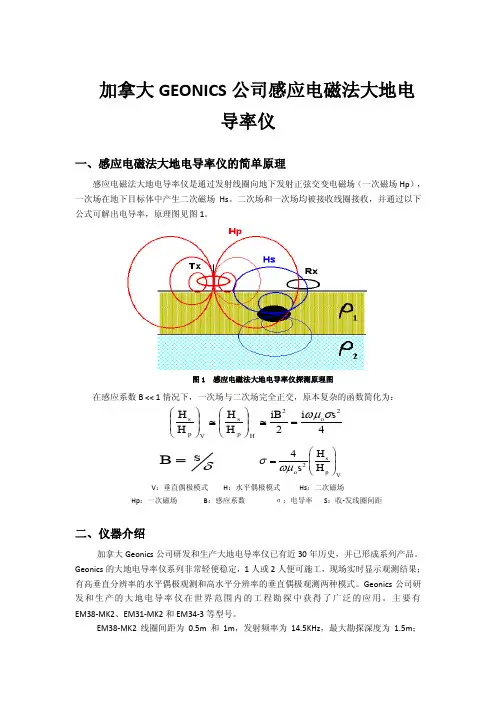
EM38大地电导率探测仪EM38主要用于浅部探测—尤其是农业恳殖层内的探测,其测量值为大地电导率(虚分量)和磁导率(实分量)。
探测深度为:垂直偶极模式(如图所示)1.5m;水平偶极模式0.75m。
EM38采用的感应方法与EM31-MK2的相同,可快速扫面,无需接地。
对农业应用而言,测量大地电导率对确定土壤的性质,诸如盐和水的含量等,特别有用。
EM38还可用于许多其它近地表探测,如考古等;土壤磁化率值也能提供某些有用信息。
EM38非常轻便,长度仅1m,测量快捷,横向分辨率高。
通常将仪器置于地面并记录读数。
数字化表头安装于EM38的上面或侧面以适应水平偶极或垂直偶极测量。
利用延长臂(可选)和联接DL600数据采集器的电缆,可以站立连续或定点测量。
利用这种操作方式,一小时可轻松地观测3000个测点。
进行大面积扫面,可将EM38安装在平台上由汽车拖拉测量。
做一项改进(可选)将其与基于计算机的采集系统相联,可实现实时数据采集。
用途:EM38-MK2大地电导仪用于同时采集土壤的电导率和磁化率数据,EM38-MK2大地电导仪包含2个接收线圈,每个为垂直偶极方向,从发射器相隔1米和0.5米,同时提供数据的有效深度范围分别为1.5米和0.75米。
仪器旋转后,接收线圈为水平偶极方向,有效深度范围分别为0.75米和0.375米。
广泛运用于农田土壤盐分普查、土石坝渗漏通道检测、公路地基构造、地质构造勘测等应用土壤电磁感应测量方法的领域。
测量原理:EM38-MK2大地电导仪有一个小型发射线圈,它可以产生一个随时间变化的初级磁场,这个磁场在大地中诱导出微小电子涡流,同时有一个小型接收线圈,这个接收器既接收发射线圈产生的磁场,又接收由初级磁场诱导出的次级磁场,通过测量诱导出的次级磁场来测量大地电导率。
特点:·采用了新的线圈技术可以进行温度补偿,从而修正因为温度导致的电路温度漂移,相对比老款的EM38大地电导仪,精度得到了大幅的提高;·集成了蓝牙技术,在10米距离的范围内可以和数据管理器进行可靠的无线通信;·支持步行和拖车式进行调查采集,具有外部电源输入接口,使用外部的可充电电池组可以保证连续25个小时工作;·可选校准部件实现自动仪器校准。
土壤电导率测试报告单
土壤电导率测试报告单
编号:201902001
测试单位:XXX农业科技有限公司
测试地点:XX农场
测试时间:2019年2月20日
测试方法:使用电导率仪进行测量
测试仪器:电导率仪(型号:XXX)
测试人员:XXX
测试结果:
- 土壤电导率(EC):0.3 mS/cm
- 土壤湿度(RH):20%
结论:
根据测试结果,我们得出以下结论:
1. 土壤的电导率为0.3 mS/cm,处于较低的范围。
土壤电导率是衡量土壤中溶解质含量的指标,较低的电导率可能表示土壤中的溶解质含量较低,对作物生长的影响较小。
2. 土壤的湿度为20%,属于较干燥的状态。
这可能对作物的生长产生一定的影响,需要在灌溉和管理上加以调整。
建议:
根据测试结果和结论,我们给出以下建议:
1. 建议在进行农田灌溉时,根据土壤湿度的测试结果,合理调整灌溉量和频率,保持土壤的适度湿润,提供作物所需的水分。
2. 建议进行土壤养分测试,了解土壤中的养分含量,以便进行合适的肥料施用,提供作物所需的养分。
3. 建议进行土壤pH值的测试,了解土壤的酸碱性,如有必要
进行石灰调节,以提供适宜的生长环境。
4. 建议对土壤进行有机质和微生物测试,了解土壤的肥力和生态环境,以便进行适当的调整和改进。
备注:
以上测试结果仅适用于本次测试样品,对于其他地点和时间的土壤,结果可能会有差异。
测试结果及建议仅供参考,具体施肥和管理措施仍需根据实际情况进行调整。
土壤电导率的快速测量(E M 38与数据的研究应用李淑敏,李红3,周连第(北京市农林科学院农业综合发展研究所,北京100097摘要土壤是构成生态系统的一个基本要素之一,是人类赖以生存的物质基础。
对土壤环境监测分析至关重要,在土壤分析中含盐量是一个重要的综合指标。
而土壤电导率是以数字形式表示土壤溶液的导电能力,反映了土壤的水盐状况。
利用大地电导率仪在野外原位测定土壤电磁感应电导率,是一种快速简便测定土壤含盐量的新方法。
介绍了E M38大地电导仪的原理及使用,并根据国内外研究进展,对E M38大地电导仪测得土壤电导率数据的研究应用进行了概括,并对其在未来研究中的应用进行了展望。
关键词电磁感应;E M38;土壤电导率;土壤含盐量中图分类号S151.9文献标识码 A 文章编号0517-6611(200929-14001-04Study on the Rapid M ea surem ent of So il Conductiv ity (E M 38and Da t a Applica tion L I Shu 2m i n et a l (I nstitute of Agricultural I ntegrated Development,Beijing Academy of Agricultural and Forestry Sciences,Beijing 100097Abstract Soil is a basis element of ecosystem,and the material basis of human life .Soil environmental monit oring is essential and s oil salin 2ity is an i m portant comp rehensive indicat or in s oilanalysis .Soil conductivity rep resents the conductive capability of s oil soluti on in digital f or m,reflecting the state of water and salt in the s oil .It ’s a quick and easy method in measurement of s oil salinity that making use of handheld Geonics EM38electr omagnetic soil conductivity meter in situ measurement of soilconductivity .The p rincip le and usage of E M38electromag 2netic s oil conductivity meter was introduced .Based on the study p r ogress at home and abr oad,the researches and app licati ons of apparent s oil electrical conductivity measurements were generalized .And its use in the future study was p redicted .Key words Electromagnetic induction;E M38;Soil conductivity;Soil salinity基金项目国家科技攻关项目(2004BA6178B 24;财政专项“北京郊区自然与社会经济信息管理平台”。
电磁感应式大地电导率仪在土壤学领域中的应用研究
刘虎;王振宇;魏占民;张金龙;尹春艳
【期刊名称】《天津农业科学》
【年(卷),期】2009(015)001
【摘要】介绍了电磁感应式大地电导率仪的工作原理,回顾和总结了这种仪器在土壤学领域中土壤水分、盐分、粘粒含量等的测定预测方面的研究现状,最后展望了电磁感应式土壤性质测评技术与3s技术相结合后带来的土壤信息动态变化方面的革命.
【总页数】4页(P55-58)
【作者】刘虎;王振宇;魏占民;张金龙;尹春艳
【作者单位】天津泰达园林建设有限公司,天津,300457;内蒙古农业大学水利与土木建筑工程学院,内蒙古呼和浩特010018;天津泰达园林建设有限公司,天
津,300457;内蒙古农业大学水利与土木建筑工程学院,内蒙古呼和浩特010018;天津泰达园林建设有限公司,天津,300457;内蒙古乌审旗沙土保持局,内蒙古,鄂尔多斯,017300
【正文语种】中文
【中图分类】S153.2
【相关文献】
1.CS3301在长周期大地电磁测深仪中的应用研究 [J], 巩秀钢;魏文博;金胜;叶高峰;陈凯
2.音频大地电磁远参考点信号特征及远参考大地电磁法在信号处理中的应用研究[J], 辛会翠
3.音频大地电磁法基于EH4连续电导率成像系统在广西南丹某矿区溶洞勘探中的应用研究 [J], 李叶飞;覃良厅;冯建辉
4.电磁感应式电导率传感器多参数性能研究 [J], 张嘉泓;张继军;王林军;郝道友
5.电磁感应式电导率传感器多参数性能研究 [J], 张嘉泓;张继军;王林军;郝道友因版权原因,仅展示原文概要,查看原文内容请购买。
EM38大地电导率仪使用说明北京欧华联科技有限责任公司w ww w w.o u h u a l i a n.c o m010-********1仪器原理EM38的后端有一个小型发射线圈,它可以产生一个随时间变化的初级磁场,这个磁场在大地中诱导出微小电子涡流,而EM38的前端有一个小型接受线圈,这个接受器既接受发射线圈产生的磁场,又接受由初级磁场诱导出的次级磁场,通过测量诱导出的次级磁场来测量大地电导率。
一些技术问题请参见网址:/html/technicalnotes.html2仪器结构EM38-MK2能够同时测量大地电导率和磁化率,仪器带2个发射接受线圈,分别测量1米和0.5米的全相和两相参数值,输出可以用采集器记录的4组数据,前面有两个表,侧面有两个和前面一样功能的表,用来监测所测量的数据,取决于模式开关的设置。
EM38-MK2-1有一个发射接受线圈,测量并记录全相和同相两组数据,3仪器使用3.1简化方法以下是EM38-MK2使用前的准备工作,推荐的不同程序间的时间间隔是一般值,实验表明,条件不好时要多实施几次,条件好时可以适当减少次数,两个线圈操作一样,这里只介绍1米的。
3.1.1电池的检测在每次使用EM38前,建议检测电池电量,旋转主机上MODE旋钮至BAT,此时读取屏幕数值,该数值在1500~720时为正常电量,如果不在这个范围内,请更换电池,该仪器使用一节9V电池。
3.1.2仪器零点的校准把MODE旋钮调到“1米”(0.5米的线圈拨到0.5米的位置)位置,按一下步骤设置1.将仪器水平模式放置,设置Q/P和I/P读数为零2.调节Q/P旋钮为任意值(如H=10mS/m),然后调节仪器到竖直模式,记录读数(V=16mS/m),然后减去水平模式下的值(V-H=6mS/m)。
3.再次放到水平模式,调节Q/P为上面的差值,再放到竖直模式时,读书应该为12mS/m。
注:仪器在至少1.5米以上的高度时,Q/P读数或者电导率满足以下等式:V=2H用0.5米的分离线圈时选择0.5米的位置。
Electrical conductivity measure-ments have been used for years to determine salinity and moisture in soils. Probes were inserted directly into the soil to determine how well the soil conducted an applied current. This process was slow and labor-intensive and was usually reserved for scientific studies.A more recent technique for measuring conductivity is electromagnetic induction (EM), a non-invasive, non-destructive sampling method. No probes are required using EM, and measurements can be done quickly and inexpensively.How Does EM Work?W e have used the EM-38, a commer-cially available instrument from Geonics Ltd., Ontario, Canada. The EM-38 is about 3 ft. long and is light-weight enough to be carried in one hand. The unit is powered by a single 9 volt battery that lasts approximately 16 to 20 hours.The principle of operation of the EM-38is shown in the drawing in Figure 1.The transmitting coil induces a mag-netic field that varies in strength with depth in the soil. The relative strength of the magnetic field is illustrated by the relative diameter of the circles in Figure1. The magnetic field is strongest about 15 inches below the soil surface and has an effective sensing depth of about 5 ft. A receiving coil reads primary and secondary “induced” currents in the soil.It is the relationship between these pri-mary and secondary currents that mea-sures soil conductivity. In Figure 1,the thicker circles illustrate soils that are bet-ter conductors of electrical current.Clayey soils have a higher electrical con-ductivity than coarser textured soils, so when a clay horizon is nearer the surface (b in Figure 1), the EM sensor reading is higher. Deeper topsoils having a clay hori-zon further below the soil surface (a in Figure 1) are less conductive to electri-cal current and have lower EM readings.How Are EM Measurements Used?Electromagnetic induction technolo-gy was originally developed for the min-ing industry, and has been used in miner-al, oil, and gas exploration, groundwater studies, and archaeology. In these appli-cations, differences in conductivity of subsurface layers of rock or soil may indi-cate stratified layers or voids that could be of interest. In agriculture, the EM sen-sor was first used to measure soluble salts and soil moisture. Other agricultural applications now include determining soil mapping units, estimation of topsoil depth in claypan soils, depth of sand deposition after river flooding, estimation of herbi-cide degradation, and crop productivity.For each of the applications described above, a relationship must be established between the EM sensor reading and the soil feature of interest. Once the relation-ship is established, however, the readings can be gathered rapidly.A mobile EM data collection unit is shown in Figure 2. The EM sensor is mounted on a wooden trailer away from metallic objects and vehicle engine inter-ference that can affect EM readings. A differential global positioning system (DGPS) receiver is mounted on the vehi-cle, with an analog-to-digital converter and a computer that records EM sensorFigure 2.Mobile EM-38 sensor unit is pulled behind a four-wheel ATV,equipped with analog/digital converter, laptop computer, and DGPS antenna.EM-38SensorDGPS antennaLaptop computerAnalog/Digital converterM I S S O U R IB y J. G l e n n D a v i s , N e w e l l R. K i t c h e n , K e n n e t h A. S u d d u t h a n d S c o t t T. D r u m m o n dUsing Electromagnetic Induction to Characterize SoilsResearchers are studying use of electro-magnetic induction as a convenient and low cost method for measuring variability beneath the surface, particularly for clay-pan soils. The information may help iden-tify optimum nitrogen (N) rates for vari-ous field areas.Figure 1.EM-38 principle of operation in soils.lished for a whole field, and may be adjusted for previous crop, organic matter content,and/or residual nitrate.Missouri studies have shown that yield goal potential is related to topsoil depth:Yield goal = 98 bu/A + 2.2 x topsoil depth (inches).W e used this relationship to produce a map of yield goal.From this yield goal map we made an N application map. In Figure 5, the EM map is compared to an aerial photo of corn crop cover in late July.Patterns of low EM sensor readings (deeper topsoil)match patterns of darker green crop cover. Areas of shallower topsoil (high EM sensor read-ings) are also areas where cropcover is less dense and yellow-ing due to moisture stress.Using the photo of crop cover,it is easy to see differences in potential productivity within this field and how well patterns of potential productivity are correlated to soil conductivityreadings, using the EM-38.Other work with the EM sensor is ongoing with alluvial and loess soils. These soils do not have the abrupt layer boundaries characteristic of claypan soils. However, soil texture can be related to EM readings and work is continu-ing to relate these readings tocrop response.Dr. Davis is Soil Scientist and Extension Assistant Professor, Univer-sity of Missouri-Columbia; Dr. Kitchen is Soil Scientist, USDA-ARS; Dr.Sudduth is Agricultural Engineer,USDA-ARS; Mr. Drummond is Scientific Programmer/Analyst, Uni-versity of Missouri-Columbia.Reprinted from Better Crops with Plant Food , 1997, No. 4. Published by the Potash & Phosphate Institute (PPI), 655 Engineering Drive, Suite 110, Norcross, GA 30092-2843.Reference Number 323075/98116.readings along with a DGPS ing this equipment, data from whole fields can be taken quickly, and then maps of soil conductivity can be made.Data for a 20-acre field can be collected in about one hour.EM Research on Claypan SoilsClaypan soils are important agricul-tural soils in the southern Corn Belt, cov-ering 10 million acres in seven states.They comprise a significant portion of cropland in Missouri, and can present farmers with difficult management choic-es. They have an abrupt and marked increase in clay content between the upper soil layer and subsoil. The clay content increases by at least 20 percent,and this layer of high clay soil impedes the movement of water and air, restricting the growth of plant roots.Topsoil depth and corn grain yield measured along a field transect is shown in Figure 3. The depth to the claypan layer varies from a few inches to more than 40 inches, and it is apparent that grain yield is related to the depth to the claypan layer. Within a field, the varia-tion in depth to the claypan can be seen by spatial patterns in crop water stress.The areas having shallow topsoils (often on eroded side-slopes) are the first to have water-stressed plants. Clearly, hav-ing information on the depth of topsoil would be a valuable tool in tailoring man-agement for crop needs.A management example using N fer-tilizer for corn production is shown in Figure 4. The first step is to collect EM sensor data for the field using the mobile EM unit. In this case, transects for EM data were taken at a very close interval (about 15 ft.). In most cases, a transect interval of 40 to 60 ft. gives sufficient data density to map the field. For select-ed points in the field, topsoil depth (mea-sured using a soil probe) and soil con-ductivity (by EM) were determined con-currently. From these data points, a regression equation between EM sensor reading and topsoil depth was calculated to produce a map of topsoil depth for the field. Finally, an N recommendation map was made based on topsoil depth (c in Figure 4). Nitrogen recommendations in Missouri and other Corn Belt states often use expected yield (or yield goal) as one of the parameters for estimating crop N needs. Y ield goals are usually estab-Figure 3.Corn yields and depth to claypan layer along atransect at Centralia, Missouri.Figure 4.EM-38 soil conductivity, topsoil depth, and Nrecommended for corn at Centralia, Missouri.Low EM High EM4 12 20 28 36 inches85 115 145 175 205Figure 5.EM-38 sensor readings (a) and aerial corn cropcover photo (July 25, 1997) at Centralia, Missouri site.。