GeoFence操作指南
- 格式:ppt
- 大小:1.21 MB
- 文档页数:41
Geo-office使用手册建立Geo-Office工区1、启动Geo-Office在桌面上双击Geo-Office图标或选Start >> Programs >> Geo-Office. Geo-Office窗口打开如图1所示:图1 Geo-Office启动界面2、新建工程单击工具栏按钮或从菜单栏中选文件>>新建,弹出新建工程对话框。
(图)单击弹出文件选择对话框。
(图)图3 选择SEG-Y地震数据体选择SEG-Y地震数据体,单击,将地震数据添加到工程。
(图)图4 新建工程对话框选择添加的地震数据,地震数据高亮度显示,“编辑”、“删除”、“配置SEG-Y”等可选,否则不可选。
(图)图添加完地震数据后,〖工程名〗和〖工程路径〗输入框则自动完成(默认为第一个地震数据文件名去掉扩展名)。
同样也可以对工程名进行修改。
点击按钮,弹出“名称”对话框(图),可以对地震数据提的名称进行修改,地震数据体名称默认为地震数据文件名去掉扩展名。
图地震数据名称编辑对话框如果不需要某个地震数据,选中该地震数据,点击按钮,可以将该数据体从工程中删除。
点击弹出地震数据配置对话框。
详情参考《配置SEG-Y地震数据》节所述。
各项设置工作完成后,点击,进入工区平面图。
配置SEG-Y地震数据如果地震数据不是附录所述的标准SEG-Y格式,则需要对地震数据进行一定的配置(图),才能正确浏览和使用地震数据。
选中SEG-Y地震数据体,点击,弹出如图所示(SEG-Y文件配置)对话框。
图SEG-Y文件配置线头定义对话框(1)线头定义:如上图所示①数据标准:数据标准分为IBM、IEEE、PC三种数据格式,通常使用的数据格式都为IBM格式。
如果不确定,需要处理人员或数据提供者确认。
②数据类型:数据类型分为Amplitude(振幅)、Impedance (阻抗)、Velocity(速度)、GR(自然伽马)和SP(自然电位)五种,通常使用的数据类型为Amplitude(振幅)。
MissionPlanner地⾯站操作使⽤⽂档⽆⼈机地⾯站(GCS)Mission Planner 操作使⽤⼿册⼩左实验室2014-10-1⽬录Mission Planner 操作使⽤⼿册 (1)1.Mission Planner简介 (2)2.Mission Planner安装 (2)3.飞控板固件加载 (3)4.链接飞控板 (5)5.Mission Planner显⽰⾯板及特点 (5)5.1连接Connect (5)5.2飞⾏数据Flight Data (5)5.3飞⾏规划Flight Planning (7)5.4初始化设置Initial setup (7)5.5参数配置和调整Params Configure安定tuning (7)5.6仿真器 (8)6飞⾏任务规划 (8)6.1航点规划及动作 (8)6.2任务指令参考 (10)6.3相机控制与⾃动操作 (11)6.4转场点设置 (13)6.5地形跟踪 (15)7.基于数据记录的故障诊断 (16)7.1基于logs诊断问题 (16)7.2数传电台记录诊断 (20)7.3闪存数据记录 (22)7.4记录数据与回放任务 (25)7.5振动测量分析 (26)8.开源Mission Planner的⼆次开发基础 (29)8.1Visual Studio Community 13.0打开Mission Planner solution (29)8.2 发布修改后的Mission Planner (31)11.Mission Planner简介Mission Planner是⽆⼈机地⾯控制站软件,适⽤于固定翼,旋翼机和地⾯车。
仅仅在windows 系统下⼯作。
Mission Planner 可给你的⾃动车辆提供配置⼯具或动⼒学控制。
其主要特点:●给控制板提供固件加载●设定,配置及调整飞⾏器⾄最优性能●通过在地图上的⿏标点击⼊⼝来规划,保存及加载⾃动任务给飞控板●下载及分析由飞控板创建的任务记录●与PC飞⾏模拟器连接,提供硬件在环的UAV模拟器●通过适当的数传电台,可以监控飞⾏器状态,记录电台传递数据,分析电台记录或在FPV模式下⼯作2.Mission Planner安装Mission Planner是windows系统上的⾃由开源软件,安装⾮常简单。
第二章输入人文数据和井数据目录返回:第一章建立工区输入人文数据一般来说,在地质研究工作流程中,第二步就是输入人文数据和井数据。
GeoGraphix Discovery可以输入行业标准格式的数据和用DefCon2针对不同文件格式建立输入模板的人文数据和井数据。
井数据还可以选择直接从Microsoft Excel直接输入。
用行业常用的文件格式输入人文数据和井数据可由ProjectExplorer或特定模块(LandNet 输入人文地理建筑数据, WellBase输入一般井数据, PRIZM输入测井曲线, Xsection输入光栅测井曲线)输入。
在本教程将学习用ProjectExplorer把行业标准的GeoGraphix CDF Import格式的人文数据输入GeoGraphix Discovery工区。
一旦数据输入成功,可以显示在GeoAtlas的底图上。
从ProjectExplorer菜单条选File(文件)>> Imports(输入)>> Land>> GeoGraphix CDF Import。
打开Import对话框。
注:GESXplorer可以输入以下人文/大地网格格式:GeoGraphix CDF、Digitech/GeoCadd Grid and Culture、GeoGraphix T/R Digitizer、TOBIN Infobase、TOBIN TDRBM II、Topographic Mapping Texas、Topographic Mapping T/R, and WhiteStar Digital Mapping。
2.选择要输入的文件,单击Browse(浏览)按钮。
出现Open对话框。
3.在SampleFiles (实例文件)目录下选定Stratton.cdf。
由一体化安装程序确定的默认位置如下(但安装选项不同默认位置会不同)。
Windows NT - C:\ WINNT\ Profiles\ All Users \ Application Data\ GeoGraphix\ SampleFiles\ Stratton\ LandCult\ Stratton.cdf.Windows 2000 - C:\ DocumentsandSettings\ All Users\ Application Data\ GeoGraphix\ SampleFiles\ Stratton\ LandCult\ Stratton.cdf.4.选定Stratton.cdf文件,并单击Open.在Import data file(输入数据文件框)中出现所选文件的名称和路径。
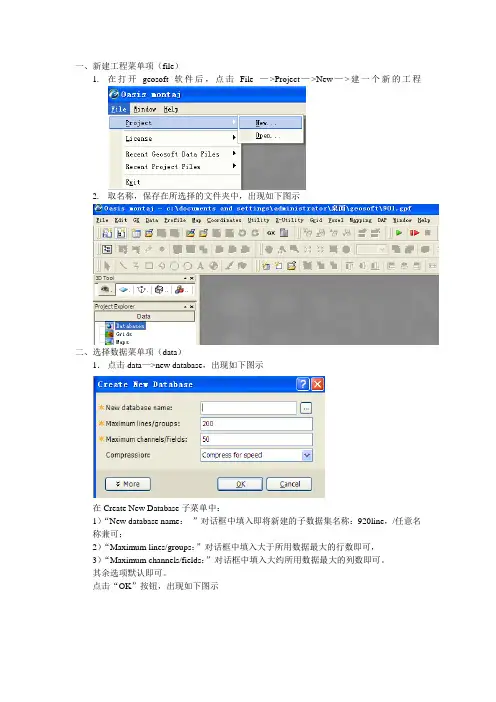
一、新建工程菜单项(file)1.在打开geosoft软件后,点击File —>Project—>New—>建一个新的工程2.取名称,保存在所选择的文件夹中,出现如下图示二、选择数据菜单项(data)1.点击data—>new database,出现如下图示在Create New Database子菜单中:1)“New database name:”对话框中填入即将新建的子数据集名称:920line,/任意名称兼可;2)“Maximum lines/groups:”对话框中填入大于所用数据最大的行数即可,3)“Maximum channels/fields:”对话框中填入大约所用数据最大的列数即可。
其余选项默认即可。
点击“OK”按钮,出现如下图示此时说明新建的子数据库ok了,接下来就是数据的导入,Geosoft支持数据格式:*.xls,*.xyz ,*.csv等数据格式,一般说来,所用数据通常转换成2003版excel文件格式即可。
当数据和格式整理好后,点击主菜单:data,出现下拉列表,如下图示点击:Import—>Excel Spreadsheet—>Single Sheet 会出现对话框点击:File to import 栏后面的,选择所要使用的数据表格,点击“OK”按钮,数据导入完毕,可见图示:三、网格化菜单栏(Grid)1.网格化方法(Gridding)1)最小曲率法(Minimum Curvature)最小曲率是对随机数据、非平行线和正交线数据进行处理的数字网格技术。
2)双向网格法(Bi-Directional Line Gridding)双向网格方法是对平行线、带有一些切割线的线和近似平行线,进行处理的数字技术,如果沿着测线采集的数据是近似平行的,下面的例子适合于用双向网格方法(图2-3-7)。
双向网格方法尤其适合于相对线间隔为高采样率情况,因此,双向网格可以突出垂直测线方向的特征。
在Android中使用Geofences进行地理位置计算地理位置计算是现代移动应用程序开发中的一个重要方面。
Android 操作系统提供了多种方法来实现地理位置计算,其中之一是使用Geofences。
Geofences代表了一个虚拟的地理边界,当设备进入或离开该边界时,您可以收到通知。
本文将介绍在Android中如何使用Geofences进行地理位置计算。
一、引言地理位置计算在许多应用程序中具有广泛的应用。
通过利用用户的地理位置信息,应用程序可以提供个性化的服务,如位置提醒、导航、附近的地点搜索等。
使用Geofences可以简化这一过程,同时提供可靠的地理位置计算功能。
二、Geofences概述Geofences是一个在地图上定义的虚拟地理边界。
这个边界可以是圆形、矩形或多边形,具体取决于应用程序的需求。
一旦定义了Geofences,您可以在应用程序中设置触发条件,当设备进入或离开该边界时触发相应的操作。
三、使用Geofences进行地理位置计算的步骤1. 添加Geofences要开始使用Geofences进行地理位置计算,首先需要添加Geofences。
您可以使用Google Play服务提供的API来实现这一步骤。
在添加Geofences时,您需要提供边界的位置信息、半径、以及触发条件等相关参数。
2. 监听Geofence触发事件一旦Geofences被添加成功,您需要设置一个Geofence的触发事件监听器。
这个监听器将负责处理设备进入或离开Geofence时触发的事件。
您可以使用Google Play服务的API来注册并添加相应的监听器。
3. 处理Geofence事件当设备进入或离开Geofence时,触发事件监听器将收到通知。
您可以在监听器中编写逻辑来处理这些事件,如发送通知、执行特定操作等。
通过合理处理Geofence事件,您可以提供更好的用户体验和服务。
四、实例:在应用中设置地理提醒让我们通过一个实例来演示如何在Android应用中使用Geofences来设置地理提醒。

Ge o f r a me 操作步骤(培训)地震资料解释操作手册1.1 打开Geoframe 4在上面的图标中打开Geoframe 4.0.3选打开Geoframe打开该软件。
1.2建立一个新工区1,在Project Manager中选Project Management 选Create a new project在Create a new project中输入工程名字(名字开头不能用数字),密码,验正密码点OK(稍候)。
在storage setting中点OK。
系统问是否做地震工程延展(Create charisma project exte nsio n)NX OK。
2, Edit project parameter中unit/coordinate—① display—set unit—选Metric—OK set projector—create出现Create Coordinate Systen对话框在其中的Projection中选UTM Coord in ate system 选中Hemisphere 中的Northern Tg. UTM zone number 写50—OK。
②Storage set uni—选Metric—OKset projection^ create 出现Create Coord in ate System对话框在其中的Project ion 中选UTM Coordinate system选中Hemisphere 中的Northern Tg. UTM zone number写50—OKHVpNIliddwiCferhr - 1MJChr^-lwsOMA lltlin V-hHTftM A伽rls i 軒-IGNClurhe ARC阻・m*u 曲 rN 时=lflimDn£aii-ArE M D UII IKH J hyidru Evwwt MuillMFvwn^l Ambalni (anM HA 和网牺町 tvwnsil lftXl Ihtad [1975 warn] BwiM D UTHMJ SSfiS I Wf I IU*[JSips aid EtKltSi ・. Iwwptr/Wte (IW)阳五皿-JW(w-|i 討眸詔菱眦打閒WTM CiiuHknttiu SyUiiCXW1K 如 T OMWIE :lphW* ttmierftts vVTU ZiMlb* l lUa Uttr______ JUK■tip1.3加载地震数据(以加载3D 地震数据为例)1, 应用管理对话框中(Application manager )选中用鼠标1键单击seismic 出现 seismic对话框,在该目录中用鼠标1键双击IESX2, 在 IESX Session Manager 对话框中点 Applications — Data manage^Load seismic 在 以下框中(在此框中可以按住 Ctrl 键选Application 此时可以对要打开的对话框进 行显示参数设置,如大小,名字,是否以图标显示)I'.l. H i-I^L barts areaMorth. /tanmcafXi^Mr >l'mNl ifyilMi lJNj«i4tr IJ BIQIILK I K -Load mod—选user defined 3D 点Define storage出现如下对话框:将地震资料的三点坐标中first in li ne number last in li ne nu mber start line at input CDP End line at in put CDP 四项写上。
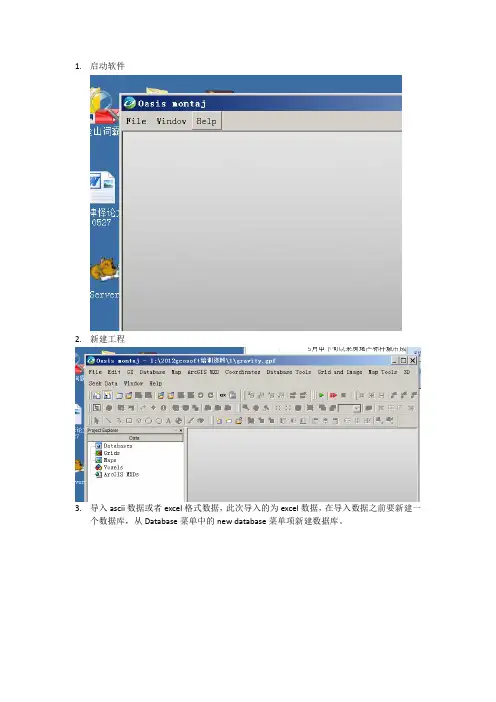
1.启动软件2.新建工程3.导入ascii数据或者excel格式数据,此次导入的为excel数据,在导入数据之前要新建一个数据库,从Database菜单中的new database菜单项新建数据库。
取数据库名为gravity,下面的三个参数分别测线数(200)和每条测线上的点数(50),这里可以不用修改,一般数据库会根据实际数据开辟存储空间。
第三个参数是对数据是否压缩的选择,主要目的是为了由于数据量大而压缩以减少存储空间,如果数据量小,则不需要压缩。
压缩带来的是数据处理速度的减慢。
4.建好数据库之后导入数据,从database菜单的import菜单项进行导入,选择合适的数据格式进行导入(一般为ascii格式),点击wizard按钮进行下一步,点击”下一步”,点击”下一步”,如下图所示在点击完成之前需要把每一列的标题头、数据类型等设置好,比如X坐标,Y坐标,这里可以对每一列进行一一设置。
点击”完成”,之后询问是否要保存模版,如果下次还有同样的数据导入,则可以保存模版,如果没有,可以不保存。
下图是导入进来的数据。
列的最上面有黑色三角形,表示该列被保护,不能进行数据处理和变换,可以在该列最上头点击鼠标右键,弹出如下菜单选择protect none菜单项即取消保护,如下图所示。
如果某列数据处理好之后不希望被改变,这选择该列,点击protected选项前打上勾即可。
在做任何形式的数据处理(如延拓,求导)之前都需要对数据进行网格化。
网格化的处理在Grid and Image菜单中,选择kriging方法。
弹出如下对话框,设置如下:第一个参数是要网格化的列,第二个参数为输出的文件名,第三个参数为网格大小(此处为500m*500m大小)。
点击OK按钮进行网格化。
下图为网格化后的输出图。
前面所涉及到的处理过程均为预处理,重、磁数据专业则在magmap模块里,需要从GX模块中装载进来。
点击GX菜单下的load menu菜单项,弹出如下对话框,找到magmap.omn,点击打开即把magmap模块装入系统中。
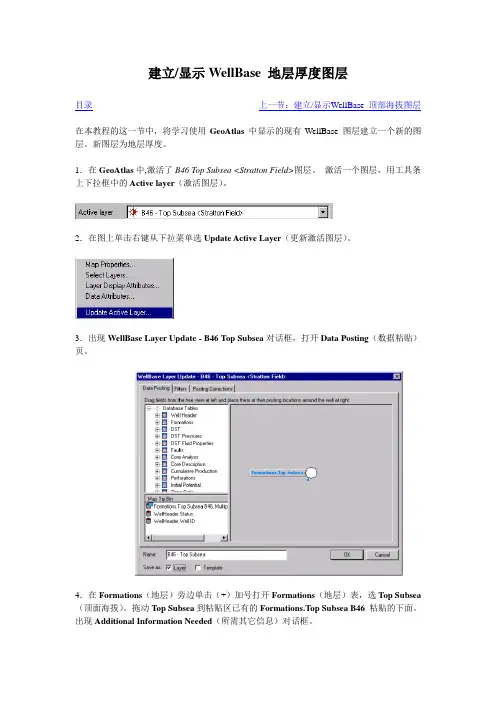
建立/显示WellBase 地层厚度图层目录上一节:建立/显示WellBase 顶部海拔图层在本教程的这一节中,将学习使用GeoAtlas中显示的现有WellBase 图层建立一个新的图层。
新图层为地层厚度。
1.在GeoAtlas中,激活了B46 Top Subsea <Stratton Field>图层。
激活一个图层,用工具条上下拉框中的Active layer(激活图层)。
2.在图上单击右键从下拉菜单选Update Active Layer(更新激活图层)。
3.出现WellBase Layer Update - B46 Top Subsea对话框,打开Data Posting(数据粘贴)页。
4.在Formations(地层)旁边单击(+)加号打开Formations(地层)表,选Top Subsea (顶面海拔)。
拖动Top Subsea到粘贴区已有的Formations.Top Subsea B46粘贴的下面。
出现Additional Information Needed(所需其它信息)对话框。
5.在Select formation(选地层)框中单击向下箭头,从下拉列表中选C38。
6.在Select sources(选数据源)组框中单击双箭头按钮选所有Available sources(可用数据源)。
7.用Up(上)和Down(下)按钮将数据源排序,让UTBEG在列表顶部。
8.接受所有其它默认设置,单击OK,关闭Additional Information Needed(所需其它信息)对话框。
9.在两个Formations.Top Subsea粘贴上单击并在其周围拖一个长方形将其选中。
10.在两个选中的字段上单击右键从下拉菜单上选Calculate Gross Thickness(计算总厚度),出现Resolve Downhole Post对话框。
11.该对话框是用来选择斜井中的文字粘贴位置。
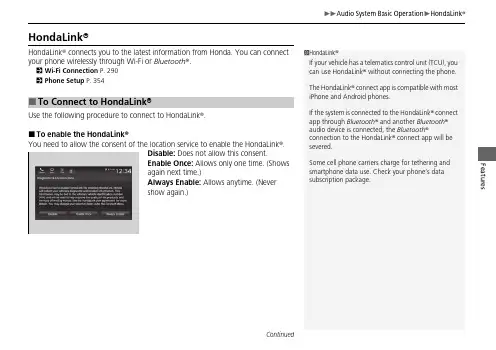
Features HondaLink®HondaLink® connects you to the latest information from Honda. You can connectyour phone wirelessly through Wi-Fi or Bluetooth®.2Wi-Fi Connection P.2902Phone Setup P.354Use the following procedure to connect to HondaLink®.■To enable the HondaLink®You need to allow the consent of the location service to enable the HondaLink®.Disable: Does not allow this consent.Enable Once: Allows only one time. (Showsagain next time.)Always Enable: Allows anytime. (Nevershow again.)■To Connect to HondaLink®1HondaLink®If your vehicle has a telematics control unit (TCU), youcan use HondaLink® without connecting the phone.The HondaLink® connect app is compatible with mostiPhone and Android phones.If the system is connected to the HondaLink® connectapp through Bluetooth® and another Bluetooth®audio device is connected, the Bluetooth®connection to the HondaLink® connect app will besevered.Some cell phone carriers charge for tethering andsmartphone data use. Check your phone’s datasubscription package.ContinuedFeatures■To link with HondaLink ®You may see the connection guide screen after launching HondaLink ® when there is no connection available.■ConnectDisplays instruction messages when the vehicle needs service.■Help & SupportDisplays tips for vehicle usage, and get support via road side or customer service center.■HondaLink ® MenuFeatures ■MessageDisplays helpful and important information from Honda.You can check the messages that are received quickly in the shortcut operation.1.A notification appears and notifies you of anew message in the header area.2.A notification is continuously displayed inthe header area until the new message isread.■Vehicle Information and Message from Honda TipsNotificationContinuedFeatures 3.Select the system status icon to see themessages.4.Select a new message to open.u If you have selected the update optionfor HondaLink®, follow the directions onthe screen to complete the process.1Vehicle Information and Message from Honda TipsWhen you update HondaLink®, you must keep thepower system on and maintain a constant connectionwith HondaLink®.If the update is interrupted, the system willautomatically resume the process. If, however, aweek has elapsed since the process was firstinterrupted, you must repeat the process from thebeginning.You can update HondaLink® by selecting Messagefrom Honda on the HondaLink® menu.ContinuedFeaturesHondaLink ® Service *Is a subscription-based service that provides convenient features such as voice communication in case of emergency, online security, and one-on-one operator assistance.■Automatic collision notificationIf your vehicle’s airbags deploy or if the unit detects that the vehicle is severely impacted, your vehicle automatically will attempt to connect to the HondaLink ® operator. Ifconnected, information about your vehicle, its location, and its condition can be sent to the operator *1; you also can speak to the operator when connected.IMPORTANT: In a crash, HondaLink ® will attempt to notify emergency services but NEITHER HONDA NOR ITS SERVICE PROVIDERS GUARANTEE THAT SUCH NOTIFICATION WILL OCCUR.Honda reserves the right to terminate HondaLink ® services at any time or for any reason, and in the future may not be able to provide services due to changes in, or obsolescence of, technology integral to the service or changes in governmental regulation.*1: Depending on your phone and adequate cellular coverage, your vehicle’s location may not be sent to the operator.■In Case of Emergency1HondaLink ® Service *HondaLink ® also provides services you can operate from the Internet or your smartphone.To subscribe to HondaLink ®, or to get more information about all of its features, contact an Honda dealer, or visit 1In Case of EmergencyYour vehicle may not be able to connect to theoperator if the 12-volt battery level is low, the line is disconnected, or you do not have adequate cellular coverage.You cannot use this emergency services when:•You travel outside the HondaLink ® service coverage areas.•There is a problem with the connecting devices,such as the microphones, speakers, or the unit itself.You cannot operate other phone-related functions using the screen while talking to the operator.Only the operator can terminate the connection to your vehicle.1Automatic collision notificationIf the unit fails to connect to the operator, it repeatedly tries until it succeeds.*Not available on all models■Manual operator connectionIf you need to talk to the HondaLink® operatorin a situation where no airbag has deployed,you can manually connect to them by pressingthe ASSIST button with the power mode inACCESSORY or ON.1.Open the cover attached to the ceilingconsole.2.Press the ASSIST button.u You are connected to the HondaLink®operator.1Manual operator connectionDo not press the button while driving. When you need to contact the operator, park the vehicle in a safe place.If the unit fails to connect to the operator, it automatically cancels the action after three minutes. If necessary, the cover can be broken to access the ASSIST button.ASSISTButtonFeaturesContinuedFeaturesYour subscribed telematics service provider can track your vehicle’s location, remotely lock or unlock doors, and help you find your vehicle.To use these features, you need your user ID and personal identification number (PIN).■Stolen vehicle trackingThis feature searches and tracks down your vehicle position even if it is on the move. If you believe that your vehicle has been stolen, contact the police as well as the provider.■Remote door lock/unlockThe provider can remotely lock or unlock doors upon your request.■Vehicle finderThis feature is convenient to use when trying to locate your vehicle in large areas,such as a crowded parking lot. If you cannot locate your vehicle after using the remote transmitter’s answerback function, you can contact the provider which can then flash your vehicle’s exterior lights and sound the horn, and sends vehicle location via web/Smartphone.■Security alarm notificationIf the security system in your vehicle detects an abnormal condition, such assomeone tampering with the lock on your vehicle, the provider notifies you by email.■Security Features1Security FeaturesThe contact information of your provider, your user ID and PIN will be given when you subscribe toHondaLink ®. If you forget any of the above, contact a Honda dealer, or go to .You can also activate the remote door lock/unlock and vehicle finder features from the Internet or using your smartphone app. Ask a dealer, or visit .1Vehicle finderThe lights will stop flashing and horn will stop sounding under the following:•When conditions 30 seconds have elapsed.•You unlock the doors using the remote transmitter.•You unlock the doors using the keyless access system.•You unlock the doors using the built-in key.•The power mode is set to ACCESSORY or ON.Features Connect to the HondaLink® operator when trying to find a destination or forroadside assistance.1.Press the LINK button.u Connection to the operator begins.2.Talk to the operator.u To disconnect, select Hang Up on theaudio/information screen or press thebutton on the steering wheel.■Operator Assistance1Operator AssistanceRemain attentive to road conditions and drivingduring operator assistance.If you want to add or renew a subscription, call theOperator Assistance.1.Press the button.2.Select HondaLink.3.Select HondaLink Subscription Status.LINK ButtonAudio/information screenFeaturesYour subscribed telematics service provider can check your vehicle’s condition.■Virtual DashboardYou can remotely check the mileage, fuel range, and oil life in your app.■Remote Start and stop the engineYou can remotely turn on and off the power system using your app as same as the keyless remote.■Geofence AlertYou can receive a notification anytime your vehicle enters or leaves a region set by you.■Speed AlertYou can receive a notification when your vehicle has exceeded a speed limit set by you.■Personal Data WipeYou can reset your audio and navigation system settings to factory defaults with the app.■Wi-Fi hotspotVehicle provides 4G LTE network environment as Wi-Fi router to use tablet or smartphone in your vehicle.■Convenient Features1Convenient FeaturesThe contact information of your provider, your user ID and PIN will be given when you subscribe toHondaLink ®. If you forget any of the above, contact a Honda dealer, or go to .。

目录第一章序言 (1)第一节GeoMedia概述 (1)第二节GeoMedia使用须知 (2)第三节GeoMedia起步 (4)第四节进出GeoMedia (5)第五节GeoMedia工作流程 (6)第二章工作区的使用 (7)第一节工作区概述 (7)第二节工作区的创建 (7)第三节寻找你所要的工作区 (8)第四节保存、关闭和拷贝一个工作区 (9)第五节Email工作区 (9)第六节创建工作区模板 (9)第三章坐标系统的使用 (10)第一节定义工作区的坐标系统 (10)第二节坐标的读出 (12)第三节坐标参数设置 (12)第四节测量参数设置 (13)第五节Datum交换设定 (14)第六节无坐标系统的数据显示 (15)第四章数据库的使用 (17)第一节创建可读/写数据库 (17)第二节为数据库定义坐标系统。
(19)第五章地图窗的使用 (20)第一节步骤 (20)第二节方法 (21)第三节例子 (25)第六章使用数据窗口 (30)第一节打开数据窗口 (30)第二节控制数据窗口 (30)第三节使用数据视图工具 (30)第四节在数据窗中使用鼠标 (31)第五节编辑数据窗口中单元格 (31)第六节数据窗口快照 (32)第七章使用要素 (33)第一节解释几何类型 (33)第二节要素选择 (33)第三节使用要素类 (35)第四节在要素类中插入文本要素 (36)第五节给要素类添加要素 (37)第六节添加几何 (38)第七节给数据窗插入超级文本 (38)第八节改变要素的属性值 (39)第九节在要素周围放置缓冲区 (39)第十节改变和删除要素 (41)第八章使用查询 (42)第一节在GeoMedia中建立查询 (42)第二节定义空间查询 (44)第三节显示查询 (45)第四节编辑查询 (45)第五节删除查询 (46)第九章使用标签 (48)第一节建立标签 (48)第二节把CAD图形链接到数据库属性 (48)第十章输出GeoMedia数据 (50)第一节打印当前窗口 (50)第二节使用Imagination Engineer来显示和打印地图 (53)第三节建立地图视图 (54)第四节设计地图版面 (55)附录A:怎样与Intergraph联系 (58)附录B:GDOO信息 (61)第一章序言欢迎使用新一代地理信息系统软件GeoMedia。
测绘工程技术专业测量数据处理软件使用指南测量数据处理软件的操作指导测绘工程技术专业测量数据处理软件使用指南引言:测绘工程技术专业中,测量数据处理软件是必不可少的工具。
通过使用这些软件,我们可以更加高效地处理和分析测量数据,提高工作效率。
本文将为您提供测量数据处理软件的操作指导,帮助您快速上手并掌握使用技巧。
第一部分:测量数据处理软件的基本操作在开始使用测量数据处理软件之前,首先需要了解一些基本操作。
以下是针对常见测量数据处理软件的通用指南。
1. 安装软件:插入安装光盘或下载安装文件,并按照提示完成安装过程。
确保系统满足软件的最低配置要求。
2. 打开软件:双击软件图标或通过开始菜单打开软件。
等待软件加载完成。
3. 创建新项目:在软件界面上找到并点击“新建项目”按钮,根据提示填写项目名称和相关信息。
4. 导入测量数据:在软件界面上找到并点击“导入数据”按钮,选择存储测量数据的文件夹,并选择要导入的数据文件。
根据需要选择数据导入方式,如批量导入或逐个导入。
5. 数据预处理:对导入的测量数据进行预处理,包括数据校正、滤波、去噪等。
根据软件提供的功能,选择合适的处理方法,并进行相应设置。
6. 数据编辑:对处理后的数据进行编辑,如添加标注、删除异常数据点等。
根据软件提供的编辑工具,进行相应操作。
7. 数据分析:利用软件提供的分析功能,对测量数据进行进一步的处理和分析,如绘制图表、计算统计量等。
根据需要选择相应的分析方法,并进行设置。
8. 数据输出:在数据处理和分析完成后,通过软件提供的功能将结果输出,如导出图表、生成报告等。
根据需要选择相应的输出格式,并进行相应设置。
第二部分:测量数据处理软件的高级功能除了基本操作外,测量数据处理软件还提供了一些高级功能,以满足更加复杂的数据处理需求。
以下是一些常见的高级功能介绍。
1. 数据配准:当测量数据涉及多个测量设备或多个时间点时,需要进行数据配准以保证数据的准确性。
GeoMedia Professional培训教材第一课GeoWorkspace操作1.GeoWorkspace概念GeoWorkspace(工作空间)是你查看和处理地理数据的工作区域,文件扩展名为gws。
GeoWorkspace中存储了诸如named legends, queries, 和warehouse connections等GeoMedia对象。
2.创建一个GeoWorkspacea)启动GeoMedia Professional;b)如果出现GeoMedia Professional欢迎对话框,选择Create new GeoWorkspace,点击OK按钮;如果出现GeoMedia Professional对话框,选择GeoWorkspace template,点击OK按钮或从文件File菜单条选择New GeoWorkspace菜单项。
c)在New对话框中,确认默认模板normal.gwt,并选择Document选项,然后点击New按钮。
GeoWorkspace被创建,其缺省名为GeoWorkspace1。
GeoWorkspace包括空的legend(图例)和缺省名为MapWindow1的map window(地图窗口)。
Map window用于显示地理矢量数据和栅格数据(影像)。
介绍GeoMedia Professional的界面。
3.保存GeoWorkspace在继续练习前,我们必须保存GeoWorkspace,其方法为:a)选择File > Save GeoWorkspace;b)在File name处,删除现有的文字,键入learning。
c)点击Save后退出系统。
文件被保存到\GeoWorkspaces目录下,文件名为learning.gws。
注意:你在任何时候退出GeoMedia Professional,应该注意保存GeoWorkspace。
4.打开GeoWorkspace你可以打开任何现存的GeoWorkspace,方法如下:a)启动GeoMedia Professional;b)如果出现GeoMedia Professional欢迎对话框,选择Open existing GeoWorkspace打开Open GeoWorkspace文件对话框,选择文件列表中的learning.gws,打开刚刚创建的GeoWorkspace;c)如果出现GeoMedia Professional对话框,从文件File菜单条选择OpenGeoWorkspace菜单项打开Open GeoWorkspace文件对话框,选择文件列表中的learning.gws,打开刚刚创建的GeoWorkspace。
geoeast的数据处理流程英文回答:The data processing workflow at Geoeast involves several steps to ensure the accuracy and reliability of the data. Here is a detailed explanation of the process:1. Data Collection: The first step is to collect the raw data from various sources, such as sensors, satellites, or surveys. This data can include geographic information, weather data, or any other relevant data needed for analysis.2. Data Cleaning: Once the data is collected, it needs to be cleaned to remove any errors, duplicates, or inconsistencies. This step involves checking for missing values, outliers, and formatting issues. For example, if we are analyzing temperature data, we need to ensure that all values are in the same unit of measurement and there are no missing values due to sensor malfunctions.3. Data Transformation: After cleaning, the data may need to be transformed or normalized to make it suitablefor analysis. This can involve converting data types, scaling values, or applying mathematical functions. For instance, if we have a dataset with temperature values in Fahrenheit, we may need to convert them to Celsius for consistency.4. Data Integration: In some cases, data from different sources or formats need to be combined for analysis. This can involve merging datasets based on common variables or aggregating data at different levels of granularity. For example, if we have temperature data from multiple weather stations, we may need to merge them into a single dataset for analysis.5. Data Analysis: Once the data is prepared, it can be analyzed using various statistical or machine learning techniques. This step involves exploring the data, identifying patterns or trends, and deriving insights. For instance, we can use regression analysis to understand therelationship between temperature and other variables like humidity or wind speed.6. Data Visualization: To communicate the findings effectively, data visualization techniques are used to create charts, graphs, or maps. This helps in presenting the results in a visually appealing and understandable manner. For example, we can create a line graph to show the temperature variation over time or a heat map to display the spatial distribution of temperatures.7. Data Interpretation: Finally, the analyzed data and visualizations are interpreted to draw conclusions and make informed decisions. This step involves understanding the implications of the findings and providing recommendations based on the analysis. For example, if we find that there is a correlation between temperature and crop yield, we can recommend adjusting agricultural practices accordingly.Overall, the data processing workflow at Geoeast involves collecting, cleaning, transforming, integrating, analyzing, visualizing, and interpreting data to generatevaluable insights and support decision-making.中文回答:Geoeast的数据处理流程包括多个步骤,以确保数据的准确性和可靠性。