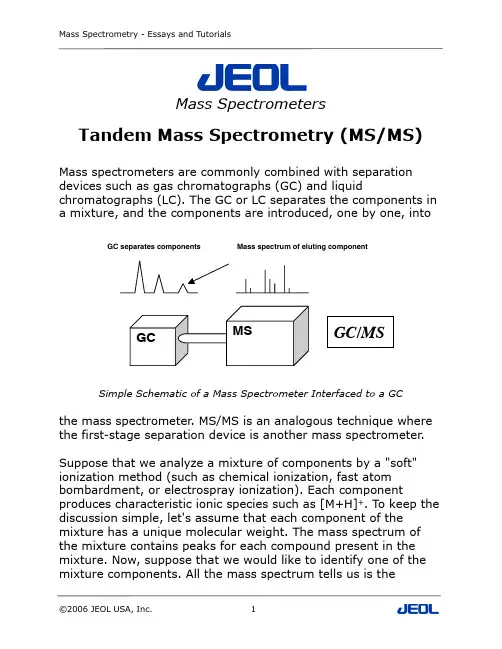
GCMSGC/MSGC separates componentsMass spectrum of elutingcomponentJEOLMass SpectrometersTandem Mass Spectrometry (MS/MS)Mass spectrometers are commonly combined with separation devices such as gas chromatographs (GC) and liquidchromatographs (LC). The GC or LC separates the components in a mixture, and the components are introduced, one by one, intoSimple Schematic of a Mass Spectrometer Interfaced to a GCthe mass spectrometer . MS/MS is an analogous technique where the first-stage separation device is another mass spectrometer .Suppose that we analyze a mixture of components by a "soft" ionization method (such as chemical ionization, fast atom bombardment, or electrospray ionization). Each componentproduces characteristic ionic species such as [M+H]+. To keep the discussion simple, let's assume that each component of the mixture has a unique molecular weight. The mass spectrum of the mixture contains peaks for each compound present in the mixture. Now, suppose that we would like to identify one of the mixture components. All the mass spectrum tells us is them 1+→m 2++NSet MS1to select this mass,m 1MS1MS2CID:Gas-filled collision chamber.m 1breaks apart to produce fragmentsFragments of m 1MS/MSmolecular weight, but we would really like to see fragment ions that provide structural information for the component of interest.The simplest form of tandem mass spectrometry combines two mass spectrometers. The first mass spectrometer is used toSimple Schematic of a Two Mass Spectrometer Tandem MS/MSselect a single (precursor ) mass that is characteristic of a given analyte in a mixture. The mass-selected ions pass through aregion where they are activated in some way that causes them to fall apart to produce fragment (product ) ions. This is usually done by colliding the ions with a neutral gas in a process calledcollisional activation (CA) or collision-induced dissociation (CID). The second mass spectrometer is used to separate the fragment ions according to mass. The resulting "MS/MS" spectrum consists only of product ions from the selected precursor . Chemical background and other mixture components are absent.Kinds of MS/MS experimentsConsider a precursor ion, m1+ that decomposes to produce a product ion, m2+, and a neutral loss , N :MS/MS experiments can be classified according to which of these species (product, precursor, or neutral loss) is a constant. Note that there is no requirement that the product and precursor ions be positively charged; the terminology is identical for negative ions.Product-ion scan (m1+ specified)If we do an MS/MS experiment to find out all of the product ions, m2+ that result from the decomposition of a specified parent ion m1+, then this is called a product-ion scan. This is the most common and well-known MS/MS experiment. It is used to determine structurally significant fragment ions for a selected precursor ion.Precursor-ion scan (m2+ specified)If we perform an MS/MS experiment that tells us all of the possible precursor ions m1+ that decompose to produce a specified product ion m2+, then this is called a precursor-ion scan. This is useful when you know that a particular product (fragment) ion mass is characteristic of a class of compounds, and you would like to identify the mixture components that belong to that compound class.Constant neutral-loss scan (N specified)An MS/MS experiment that looks for all pairs of precursor ions and product ions that differ by a constant neutral loss, N, then this is called a constant neutral loss scan. This is useful when you know that a particular neutral loss mass is characteristic of a class of compounds, and you would like to identify the mixture components that belong to that compound class. Note that the peaks in a constant neutral loss scan can be labeled with either the product ion mass or the precursor ion mass. Both naming conventions are valid, but it is more common to label the peakswith the precursor mass because it is assumed that you are interested in the identity of the intact analyte molecules.Selected reaction monitoringSelected reaction monitoring (SRM) is an MS/MS experiment that is analogous to selected ion monitoring (SIM) for target compound identification. In SIM, one only measures a set of preselected analyte masses. Other masses and the baseline noise between peaks are not detected. Compare to scanning experiments, SIM experiments provide improved selectivity and sensitivity for target compound identification and quantitative analysis. In SRM, one specifies sets of product and precursor masses that are known to be characteristic of certain target compounds.Ion activation methodsThere are many different ways to increase the internal energy of ions so that chemical bonds will break and fragments will be formed. The various ion activation methods differ in how the energy is imparted to the ions, how much energy is imparted, and how the energy is distributed in the activated ions. These factors affect the selectivity, efficiency and reproducibility of the mass spectra, and they can have dramatic effects on which product ions are formed from an activated ion. The best way to characterize an ion activation method is to look at a plot of the internal energy distribution of the activated ion (Wysocki, V. H.; Kenttamaa, H. I. ; Cooks, R. G. Int. J. Mass Spectrom. Ion Proc.75 (1987), 181-208). The internal energy distribution can be estimated from the relative abundances of fragment ions from well-characterized test compounds such as tungsten carbonyl. A broad internal energy distribution will result in many different kinds of fragmentations and an information-rich MS/MS spectrum.A narrow internal energy distribution will result in efficient conversion of the precursor ions to only a few specific product ions. Note that a low, narrow internal energy distribution willWysocki, Kettämaa, & Cooks, IJMSIP, 75 (1987), 181-208MS/MS High-energy vs. Low-energy Conversionfavor bond rearrangements while a high, narrow internal energy distribution will favor simple bond cleavage. The experimental time scale is important. It takes a certain amount of time for an activated ion to decompose. Mass analyzers such as time of flight and magnetic sector mass spectrometers may detect activated ions before they have time to decompose. In that case, the precursor ions may require additional internal energy to cause them to decompose fast enough for the product ions to be observed. This is called a kinetic shift.Metastable ionsThe majority of ionization methods form some ions that have enough excess energy to decompose spontaneously. Some ions are stable and long-lived, such as molecular ions that are observed in electron ionization (EI) mass spectra, or [M+H]+ ionsobserved in chemical ionization (CI) mass spectra. Some ions are unstable and decompose rapidly in the ion source, such asEcm =Elab×m2/(m1+m2)fragment ions observed in EI mass spectra. Metastable ions are ions that survive long enough to leave the ion source but decompose before they are detected. There are techniques for detecting and analyzing metastable ion decompositions. Strictly speaking, metastable ions do not result from an ion activation method, but it is usually hard to distinguish ions that are formed with excess internal energy from those that undergo collisions with background gas in the ion source.Collision-induced disassociation (CID)If an ion collides with a neutral atom or molecule, some of the ion's kinetic energy can be converted into internal energy. This is called collisional activation. If there is enough excess internal energy to break chemical bonds, the ion will decompose. This is called collision-induced dissociation(CID) or collisionally activated dissociation (CAD). Both terms mean the same thing. Only a fraction of the ion kinetic energy, E lab, can be converted to internal energy. This fraction can be derived from looking at the physics of the ion-neutral collision from a center-of-mass reference frame,Increasing the ion kinetic energy and/or using a more massive target can increase the amount of kinetic energy that can be converted to internal energy. Multiple collisions with the target molecules can increase the internal energy, but they can also result in randomization of the internal energy and increase the probability of undesirable rearrangements. The collision process can also affect the target. It can be activated or even ionized; polyatomic target molecules can fragment. This is why noble gases such as helium, argon, and xenon are usually used as target gases. They are monoatomic and have high ionization potentials.High-energy collisionsThis refers to collisions where the precursor ion is accelerated to kinetic energies of approximately one kilovolt or higher, resulting in the excitation of electronic states in the precursor ion. High-energy collisions produce a broad internal energy distribution. Virtually all structurally possible fragmentations have some probability of occurring. The target mass does not have a large influence on the MS/MS spectrum for high-energy CID because the center-of-mass energy is a small fraction of a large kinetic energy. This means that changes in the collision conditions (collision gas, pressure, and temperature) do not produce large changes in the product-ion mass spectrum. Therefore, high-energy CID is very reproducible. Helium is often used as the target gas for high-energy CID because it is inexpensive, it has a high ionization potential, and it does not cause large scattering of the precursor ions.Low-energy collisionsThis refers to collisions where the precursor ions have kinetic energies in the range of a few eV to a few hundred eV. Low-energy collisions are thought to excite vibrational states, and they produce narrower internal energy distributions. The product ions that are observed depend strongly on the internal energy distribution. Increasing the collision energy shifts the center of the internal energy distribution to a higher value, and changes the product ions that are observed. A product-ion mass spectrum resulting from 10 eV collisions can be dramatically different from one resulting from 25 eV collisions. The target mass does have a strong influence on the MS/MS spectrum for low-energy CID. Xenon and argon are often used as target gases for low-energy CID to increase the center-of-mass energy and increase the probability of observing high-energy fragments. The target gas pressure and temperature will also affect the number of collisions and therefore the internal energy distribution and the resultingmass spectrum. For these reasons, low-energy CID is less reproducible than high-energy CID.Low-Energy CID vs. High-Energy CIDNNCH 2OH OCH 3294166160 (H rearr.)189136310Quinine (ESI+)High-energy CID mass spec-trum is more reproducible, shows less rearrangement and is easier to interpret.In-source (low energy CID)MS/MS (high energy, 2.5kV)NH 2CO O CH 2CH OHCH OH CH NH 2CONHCHCOOHOOHO H NH 2COO CH 2CH OHCH OH CH NH 2CO NHCHCOOH OOH O H NNH OOCOOH4616038713436660306232134175191102+Polyoxin D (MW 521)MS/MS of Polyoxin D at Different Collision EnergiesMore fragmentation at high collision energies, therefore more structural information.Ion-molecule reactions (reactive collisions)Ions can undergo chemical reactions with neutral molecules. Such ion-molecule reactions have been explored at length by techniques such as ion cyclotron resonance spectrometry and flow techniques. Ion-molecule reactions are the basis for chemical ionization, but they can also be used as an MS/MS technique; however, the chemistry involved is beyond the scope of this article. Reactive collisions are not in wide use as an analytical MS/ MS method at this time.Neutralization-reionization mass spectrometry (NRMS) Tandem mass spectrometers have been developed in which an ion beam is converted to neutral molecules which may undergo chemical reactions prior to a reionization step. The resulting ion beam can be analyzed by the second-stage mass spectrometer. NRMS provides a method for creating and studying species which could not otherwise be formed in or analyzed by mass spectrometry.Surface-induced dissociation (SID)If we substitute a target surface for a collision gas chamber, we can scatter ("bounce") ions off the surface. Ions can gain internal energy from the ion-surface collisions and will subsequently decompose. This process is referred to as surface-induced dissociation (SID).SID is very efficient. High internal energies can be achieved with low collision energies. The internal energy distributions are quite narrow, but it is possible to vary the collision energy to observe all possible fragment types.SID can be performed by bouncing ions off a surface perpendicularly or at an angle, or it can be accomplished by passing ions through narrow channels so that ions bounce off thechannel surfaces ("in-line SID"). The nature of the surface affects the SID process, so a variety of surfaces and surface materials have been used in SID experimentation.PhotodissociationIf ions are irradiated with photons (light), they can absorb light and undergo electronic excitation. This requires that (1) the ions must have a chromophore that allows them to absorb light at the given wavelength and (2) the photons must have energies higher than the energy required to break a chemical bond. This usually means ultraviolet light. Furthermore, the light intensity must be high enough that the rapidly moving ions will actually interact with the photons. This usually means that a highly focused laser must be used.Trapped ion mass spectrometers are usually very effective for photodissociation experiments because the ions can be trapped in the region irradiated by the light, increasing the probability that an ion will encounter a photon. Two-photon processes can also be observed if an ion absorbs a wavelength that is not energetic enough to break a chemical bond. However, the activated ion can be trapped in the irradiating light and absorb a second photon which adds enough energy to induce fragmentation. Unlike molecules in solution the trapped ions are not cooled by solvent interactions, and so they can often be trapped for a long time without losing energy.Photodissociation is very efficient if all of the above conditions are met. It is also a selective process because activation will only occur for ions that have an absorption band corresponding to the wavelength of the irradiating light.Electron-induced dissociationIf ions encounter a high-current electron beam, the ion-electron collisions can result in ion activation. This has been observed forpositive ions trapped in the negatively charged electron beam in an ion cyclotron resonance mass spectrometer. As the electron current is increased, unexpected fragment ions begin to appear. The technique has been referred to as "electron impact excitation of ions from organics" (EIEIO). Electron-induced dissociation has also been attempted by using high-current electron sources in sector and quadrupole mass spectrometers, and referred to as "El CID" and "EID". To date it has not achieved widespread use as an analytically valuable activation method.MS/MS InstrumentationMagnetic sector MS: How can you do MS/MS with only one MS?Metastable ions are frequently observed in magnetic sector mass spectrometers as broad, low-intensity peaks at apparent m/z values that do not correspond to an expected fragment. Metastable ions that decompose in the first field-free region (between the ion source and the first sector) appear at an apparent mass of m22/m1where m2 is the mass of the product ion and m1 is the mass of the precursor ion. Double-focusing magnetic sector mass spectrometers can be used to perform MS/ MS analyses. Collision cells can be placed between the ion source and the first sector (the first field-free region) or between the magnetic sector and the electric sector (the second field-free region).Reverse-geometry mass spectrometer (MIKES)Some of the earliest MS/MS work was done with reverse-geometry double focusing mass spectrometers. A reverse-geometry mass spectrometer is one in which the magnetic sector precedes the electric sector. A magnetic sector alone can be used as a mass spectrometer, with roughly unit resolution. Therefore, one can adjust the magnetic field strength to select a given precursor mass. The precursor mass is then activated byCollision chamber 2ndField-free regionMagnet Electric sector DetectorIon sourceKE of m 2Select m 1collisions in the second field-free region (just between themagnetic and electric sectors) and then the electric sector is used to analyze the kinetic energies of the product ions. This isreferred to as "mass-analyzed ion kinetic energy spectrometry" or "MIKES". MIKES experiments are characterized by good (unit resolution) precursor mass selection and poor product-ionresolution. The latter results from the fact that we are measuring product ion kinetic energies instead of product-ion mass-to-charge ratios. MIKES spectra provide a "fingerprint" that can be used to identify a given analyte, and they are useful for ion chemistry studies.Mikes: Hold B Constant, Scan ELinked scansMost magnetic sector analyses are done by setting theaccelerating voltage and electric sector to a fixed accelerating voltage and electric sector . MS/MS experiments can also be done by scanning the electric and magnetic sectors together according to certain scan laws. Consider what happens to ions during a product-ion linked scan where collisions occur in the first field-free region (just after the ion source).Ions leaving the ion sourceB E =mv mv 2/2=2vare accelerated to a kinetic energy that depends only on the accelerating potential and the number of charges on the ion:All ions with the same number of charges will have the same kinetic energy. For the moment, let's assume that the ions have only a single charge. It is apparent from the above expression that ions with different masses must have different velocities if their kinetic energies are the same. Let's assume that precursor ions with mass m 1 fall apart in the first field-free region to for product ions with mass m 2. Lets also assume that the velocity does not change when the ions fall apart. This is a safeassumption because we will only be observing ions that undergo grazing collisions, and any change in velocity will be small compared to the total velocity of ions accelerated to, say, 10 kilovolt kinetic energies. The product ions will still have the same velocity as the precursor ions. If we can select ions according to their velocities, we can tell which product ions were formed from precursor ions with known velocities. This is easily done. Recall that the magnetic sector separates ions according to their momentum (mv ) and the electric sector selects ionsaccording to their kinetic energy (mv 2/2). The ratio of B to E is related to the velocity:One can choose a B /E ratio to select ions with a given velocity. If we scan B and E together , always keeping a constant B /E ratio, we will detect product ions from the precursor ion with the specified velocity. This means that a B /E scan is a product ion scan. Like the metastable ions discussed earlier , the product ions will appear at an apparent mass of m 22/m 1. The product ionT =eV =mv 22B 2E ∝m 2v 2mv 2/2=2m resolution can be quite good for a B/E linked scan, but theprecursor ion resolution (selectivity) is poor . The reason is that we are only relying on ion velocity differences to distinguish between the different precursor masses. Suppose that we scan the two sectors while keeping B 2/E constant. Again, the magnetic field is related to the ion momentum (m v ) and the electric field is related to the ion kinetic energy (m v 2/2), so:All ions that pass through B and E must have the product ionmass m , but their velocities may differ according to the precursor ion velocities. A linked scan that keeps B 2/E constant can be used as a precursor ion scan. The precursor peaks are very broad for this kind of linked scan. One can also perform a linked scan to detect product and precursor ions that differ by a constant neutral loss. In this case, the linked scan relation is:Tandem (4-sector) MSIn one sense, this is the simplest MS/MS method to describe. Two high-resolution double focusing mass spectrometers arecombined with a collision chamber in between. The first mass spectrometer (MS-I) is set to pass mass-selected precursor ions into the collision chamber . The second mass spectrometer (MS-II) is scanned to detect product ions produced by the collision-induced dissociation of the precursor ions. Because MS-I is a high-resolution mass spectrometer , precursor ions can beseparated if they have can be resolved by MS-I. MS-II is scanned with a linked scan at a constant B /E ratio to pass the product ions. The reason for this similar to the reason given for linked-scan MS/MS of a two sector mass spectrometer . Let’s assumeB2E (1−E )=kMagnet ElectricsectorDetectorIon sourceKE = m v2/2 =q Em v2/2m vCollision chamber1st Field-free regionm1+->m2+v1~v2B/E=m v/m v2/2=2/vLinked Scans Schematicthat the collision chamber in the third field-free region is grounded. Precursor ions that leave MS-I with a mass m1 have a kinetic energy mv2/2 and a momentum mv. Assume that these ions decompose to produce product ions with mass m2 in the collision chamber between MS-I and MS-II (the third field-free region). It is also safe to assume that the velocity of these ions does not change (see the discussion of 2-sector linked scans). The ions will have a kinetic energy of m2v12/2 and a momentum of m2v1, or m2/m1 times less than the original momentum for the precursor ions. We will still have to scan MS-II to pass all product ions that have velocity v1 if we want to detect the product ions resulting from the dissociation of precursor ions with mass m1. This requires a B/E linked scan for MS-II, just like the one described for two-sector MS/MS. One problem with this approach is that the product ions have less kinetic energy, velocity, and momentum compared to ions of mass m2 that might be formed in the MS-I ion source. These larger the mass difference between m1 and m2, the lower the detector response for the product ions. This can be improved by using a floated collision cell. If we set the collision cell to a higher potential (say +3 kV for positive-ion MS/MS), the product ions will be decelerated to 7 kV as they enter the collision chamber, but the positively charged product ions leaving the collision chamber will be accelerated by the +3Note improvement in signal for low-mass products.kV potential. These accelerated product ions will produce agreater detector response, and sensitivity for low-mass product ions will be enhanced. An efficient 4-sector mass spectrometer requires efficient ion optics. The interface region between MS-I and MS-II must ensure that ions are transported without loss through the collision chamber into MS-II.Effect of Floated Collision CellOther MS/MS SystemsA comprehensive discussion of all MS/MS instrumentation is well beyond the scope of this note. However , a brief description of several common approaches follows.Triple quadrupole MSTriple quadrupole mass spectrometers are among the most common MS/MS systems, and they are in wide use forquantitative analysis in the pharmaceutical industry. A minimal configuration for a triple quadrupole mass spectrometer consists of an ion source and:1. A first-stage quadrupole mass analyzer that acts as MS-I.2. An RF-only quadrupole ion guide that acts as the collisionchamber.3. A second-stage quadrupole mass analyzer that acts asMS-II.The ion detector is placed at the exit of MS-II. Triple quadrupole mass spectrometers operate in the low-energy collision range using a collision gas such as argon. Fragmentation efficiency tends to be high, but reproducibility can be a problem, especially between different mass spectrometers. Triple quadrupole mass spectrometers can perform all of the common kinds of MS/MS analysis: product-ion scans, precursor-ion scans, constant neutral-loss scans, and selected reaction monitoring.Trapped-ion MSThe MS/MS experiment is done in a different way for trapped ion mass spectrometers. Instead of having separate mass spectrometers in for MS-I and MS-II, a single trapped-ion mass spectrometer performs the functions of precursor-ion selection, collisional activation, and product-ion mass analysis. Sequential operations are performed by manipulating the ions contained in the trap. This is referred to as "tandem-in-time" MS/MS as opposed to the "tandem-in-space" MS/MS analysis performed on magnetic sectors and triple quadrupoles.Trapped-ion mass spectrometers can only perform product-ion scans. Constant neutral-loss scans and precursor-ion scans cannot be performed as a tandem-in-time experiment.Trapped-ion mass spectrometers can perform multi-stage mass spectrometry (MS n, or MS/MS/MS...) where the number ofsuccessive reaction or fragmentation stages can be very large. This can be useful for elucidating ionic structures. However, one should be aware that long trapping times and multiple reaction stages can lead to ion-molecule reactions, ion rearrangements and similar artifact ions that may be difficult to interpret.Fourier transform ion cyclotron resonance (FTICR)1. Precursor-ion selection In FTICR, precursor ions are selected by applying an RF waveform to eject all other ions from the trapped-ion cell, so that only the precursor ions remain. Precursor selectivity depends on the waveform used for ejection. High-resolution precursor selection is possible by using carefully tailored ejection waveforms, although one must beware of frequency shifts due to changing numbers of ions in the trapping cell.2. Collisional activation The isolated precursor ions are accelerated to a higher kinetic energy by applying another RF pulse or waveform that increases the precursor ion's radius (and kinetic energy). The maximum kinetic energy that can be achieved is limited by ejection when the radius becomes large enough for the ion to collide with the trapping cell walls. The maximum kinetic energy that can be achieved decreases with increasing mass-to-charge ratio, and increases with increasing magnetic field strength. The accelerated precursor ions are trapped for a period of several milliseconds or longer to allow them to collide with the target gas. The collision gas is either introduced continuously or added with a pulsed valve.4. Product-ion detection The product ions are then excited into coherent motion with another RF waveform and the ion image currents are detected to produce a time-varying signal. The Fourier transform of the ion signal produces the mass spectrum. Several unique experiments can be performed with FTICR. The number of possible experiments is very large, but includes:•Multiple reaction stages•Ion cooling followed by reacceleration and redetection•Photodissociation of trapped ions•Ion-molecule reaction studies•Ion-electron collisions•High-resolution analysis of product ionsAlthough there have been some exceptions, FTICR experiments generally involve low-energy CID under multiple collision conditions.Quadrupole ion trapsThe MS/MS experiment in a quadrupole ion trap is analogous to the FTICR experiment.1. A waveform is applied to eject all ions except the precursor ion.2. The trapped precursor ions are accelerated in the presence of a collision gas (continuous or pulsed). See the note below for more about this step.3. A scan ejects the product ions allowing them to hit the detector.Collisional activation in an ion trap is somewhat different from collisional activation in other mass spectrometers. The ions can be momentarily accelerated to a higher kinetic energy, but they are then deaccelerated by the "excitation" waveform. This acceleration/deacceleration process is allowed to continue in the presence of a collision gas for periods of milliseconds or longer. Because of this, the collision energy is not a single value, and the collision process involves multiple collisions. This is analogous to refluxing a liquid in a reaction vessel until a reaction occurs. Fragmentation tends to favor a few low-energy reaction processes. Hence, it is common to observe only a few fragment-。