研究生英语写作图表类
- 格式:ppt
- 大小:336.50 KB
- 文档页数:43
考研外语二作文万能模板一、图表作文。
开头段,描述图表内容,引出主题。
According to the chart/table, we can see that…。
As is shown in the diagram…。
The chart/table provides some interesting data/statistics about…。
The diagram illustrates the changes in…over the period from…to…。
The table shows the comparison between…in terms of…。
主体段1,分析数据变化原因。
There are several reasons accounting for this phenomenon. First and foremost,…。
Another contributing factor is that…。
Moreover, the rapid development of…also plays a significant role in…。
In addition, the change in…can be attributed to…。
主体段2,进一步分析数据变化原因。
Furthermore, it should be noted that…。
In addition, the improvement in…is another factor that leads to…。
Besides, the increase/decrease in…can be explained by the fact that…。
结尾段,总结图表内容,提出建议或展望未来。
In conclusion, from the above analysis, we can draw the conclusion that…。
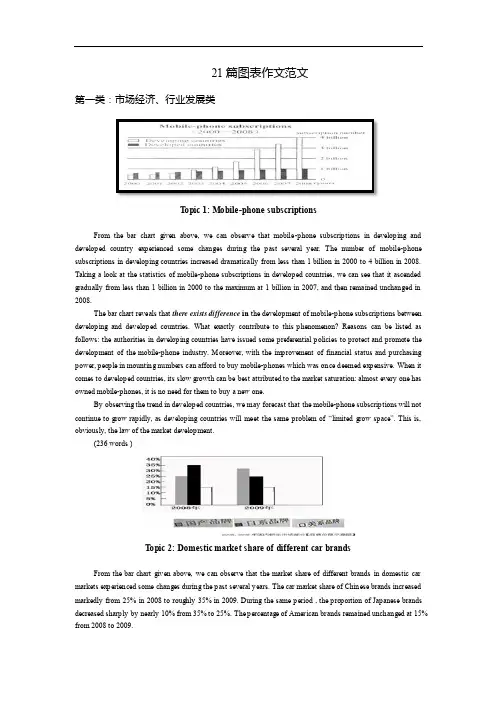
21篇图表作文范文第一类:市场经济、行业发展类T opic 1: Mobile-phone subscriptionsFrom the bar chart given above, we can observe that mobile-phone subscriptions in developing and developed country experienced some changes during the past several year. The number of mobile-phone subscriptions in developing countries increased dramatically from less than 1 billion in 2000 to 4 billion in 2008. Taking a look at the statistics of mobile-phone subscriptions in developed countries, we can see that it ascended gradually from less than 1 billion in 2000 to the maximum at 1 billion in 2007, and then remained unchanged in 2008.The bar chart reveals that there exists difference in the development of mobile-phone subscriptions between developing and developed countries. What exactly contribute to this phenomenon? Reasons can be listed as follows: the authorities in developing countries have issued some preferential policies to protect and promote the development of the mobile-phone industry. Moreover, with the improvement of financial status and purchasing power, people in mounting numbers can afford to buy mobile-phones which was once deemed expensive. When it comes to developed countries, its slow growth can be best attributed to the market saturation: almost every one has owned mobile-phones, it is no need for them to buy a new one.By observing the trend in developed countries, we may forecast that the mobile-phone subscriptions will not continue to grow rapidly, as developing countries will meet the same problem of “limited grow space”. This is, obviously, the law of the market development.(236 words )T opic 2: Domestic market share of different car brandsFrom the bar chart given above, we can observe that the market share of different brands in domestic car markets experienced some changes during the past several years. The car market share of Chinese brands increased markedly from 25% in 2008 to roughly 35% in 2009. During the same period , the proportion of Japanese brands decreased sharply by nearly 10% from 35% to 25%. The percentage of American brands remained unchanged at 15% from 2008 to 2009.The bar chart reveals that there exists some difference in the development tendency among different car brands. What exactly contribute to this phenomenon ? Reasons can be listed as follows: for one thing, the Chinese government has issued some preferential policies to protect and promote the rapid extension of domestic automotive industry. Moreover, with the decline of the prices of domestic cars, people in mounting numbers are more inclined to choose them. As for Japanese car brands, its loss of customers can be attributed to the “Recall Crisis” and low price performance ration.To maintain the leading position, Chinese automotive industry should spare no efforts to improve their capabilities of products innovation, service awareness and continue to lower its prices. Only in this way can the car industry enjoy a sustainable development. (208 words)T opic 3: The boom of overseas traveling industryFrom the bar chart given above, we can observe that the number of people traveling abroad experienced some changes during the past several years. From 1999 to 2000, the number of Chinese people traveling abroad increased rapidly from 7.5 million to 10 million, and then to 12.1 million in 2001.The bar chart reveals that people in mounting numbers are going to travel abroad. What exactly contribute to this phenomenon? Reasons can be listed as follows: for one thing, the authorities have issued some preferential policies to promote the development of the overseas tourism industry, which encourages a sudden emergence of travel agencies that can provide customers with convenient overseas tourism services. Additionally, with the improvement of financial status and purchasing power, a considerable number of Chinese people can afford the once-deemed-expensive traveling expenses. Last but not least, as there exists huge difference in cultures, customs and landscapes between China and overseas countries, quite a few people hold that overseas traveling is not only a perfect way to relax oneself, but also enrich their knowledge and expand their horizons.By observing the past trends, we may forecast that the growth tendency will continue. However,it is also a highly variable industry which is vulnerable to seasons and climates,international political situation,fluctuations in exchange.T opic 4: Changes in the ownership of houses in ChinaFrom the bar char given above, we can observe that the ownership of houses in China experienced some changes during the past several years. The proportion of state-owned houses decreased sharply by almost 50% from 70% in 1950’ to 20% in 1990’. On the contrary, during the same period, the percentage of private houses increased rapidly from 30% to 80%.The bar chart reveals that there exists an opposite trend in the development of state-owned and private houses ownership. What exactly contribute to this phenomenon? Reasons can be listed as follows: for one thing, the authorities have issued some preferential policies to the development of private houses industry. Additionally, with the improvement of financial status and purchasing power, citizens in mounting numbers can afford to buy private houses which were deemed expensive. Last but not least, people’s decision to buy a house can also be ascribed to the power of so-called “group dynamics”: when members of our social networks own their private house one after another, we unconsciously imitate them , of course, if we have enough money.The continual growth of private houses is a symbol of the improvement of people’s living standard. However, the authorities should also place a value on the restriction of houses’ price. Otherwise, it will one day be a obstacle of the rapid and sound development of economy. (224words)T opic 5: Changes in the number of TV-goers and Film-goers From the curve chart given above, we can observe that the number of film-goers and TV-goers experienced some changes over the past decade. From 1975 to 1985, the number of film-goers decreased rapidly from 80 million to nearly 10 million. During the same period, the number of TV-goers increased sharply from less than 10 million to approximately 100 million.The curve chart informs us of the phenomenon that there exists an opposite tendency between film-goers and TV-goers. Many reasons can account for this phenomenon, and the followings might be the most critical ones: for one thing, by improving the quality of programs, the TV-industry has retained a large body of televiewers and attracted quite a few potential viewers that would have swarmed into cinemas. When it comes to the cinema, the reason why it slackens might be attributed to the change of people’s consumption idea, people in increasing numbers hold the opinion that the ticket fare is sometimes too high for them to afford. Besides, by taking advantage of the convenience offered by the Internet, people can download their favorite movies from the websites directly instead of sitting in the movie theater, which also reinforces the inexorable decline of cinema industry.Whether the film industry will continue to shrink away or not is still unknown. However, no one can deny the fact that movies play an indispensable role in enriching our lives. Perhaps one day, the cinema industry will enjoy a revival, time will tell.T opic 6: Global E-commerce turnoverFrom the curve chart given above, we can observe that the turnover of global E-commerce experienced some change during the past several years. From 1997 to 2005, it rose dramatically from 20 billion to 900 billion.The curve chart reveals that the global E-commerce industry enjoys an explosive growth. Quite a few reasons can be listed to account for this phenomenon, and the followings might be the most critical ones: for one thing, the authorities of different countries have issued some preferential policies to protect and encourage the development of E-commerce, thus quite a few online-transaction websites emerge overnight. Moreover, the one-click-payment consumption mode has been widely accepted by the public thanks to the widespread availability of the Internet. Last but not least, people’s decision to purchase on-line can also be put down to the power of so-called “group-dynamics”: when our friends are shopping at network, we will be influenced by them and imitate their behaviors unconsciously.The rapid development of E-commerce signals that new business models contribute largely to the sustainable development of the global economy. However, when enjoying the fruits offered by modern technology, we should also keep an eye on the underlying threat of it. In a world features open boundary, deception and fraud sometime abound. (209 words )T opic 7: The development tendency of fast food and sitdown restaurantFrom the curve chart given above, we can observe that the number meals of fast food and sitdown restaurant experienced some changes during the past several years. The number of meals of fast food increased slowly from 20 in 1970 to nearly 30 in 1980. From 1980 to 2000, it ascended rapidly from 30 to approximately 90. On the contrary, when observing the statistics of sitdown restaurant meals, we can find that it increased slowly from 20 in 1970 to roughly 50 in 2000.The curve chart informs us of the phenomenon that there exists some difference in the development tendency between fast food and sitdown restaurants. What exactly contribute to this phenomenon? Reasons can be listed as follows: for one thing, with the pace of modern life quickening, people barely have much time to waste in lining up for restaurant meals, on the contrary, fast food meals can do help busy people save a great deal of time. Additionally, the authorities have issued some preferential policies to protect and encourage the rapid extension of fast food industry , thus the public can buy fast food at shops scattering around the city. On the contrary , people in diminishing numbers are willing to eat at sitdown restaurant. They think that eating at restaurant is always time-consuming and inconvenient. Besides, food at restaurant is comparatively expensive than fast food.by observing the trend of the past, we may forecast that the number of fast food meals will continue to rise in the years to come. However, we should also take the detrimental impact of fast food into consideration. Do remember that fast food is one of the main causing factors of diseases such as heart attack, obesity and diabetes.T opic 8: Investment in Beijing from different countries and regionsFrom the pie chart given above, we can observe that it reflects the statistics of investment in Beijing from different countries and regions. The proportion of investment from Hong Kong accounts for 44%, ranking first. The percentage of investment from other 23 countries and regions ranks second among all, making up 20.8 %. Japan occupies 19.2%, ranking third. When it comes to the U.S.A., we can find that it takes up 16% , 28% lower than that of Hong Kong.The pie chart reveals the phenomenon that most of the investment in Beijing stem from Hong Kong. What exactly contribute to this phenomenon? Reasons can be listed as follows: in the first place, China's investment policy provide preferential treatment to investors from Hong Kong. They are more likely to be immune to high taxes and other charges. Moreover, quite a few Hong Kong investors hold the opinion that, with the same language, cultures, traditions and customs, mainland is an ideal and promising investment resort which will be bound to generate considerable profits. Last but not least, it will not take a long time to commute between Hong Kong and Chinese mainland, the region advantage also has attracted more Hong Kong investors to locate their companies and factories in the mainland.The public can benefit a lot from Hong Kong investment. People can buy products with superior quality at a comparatively cheaper price. However, balancing the investment proportion from different countries is also a issue needed to be put at the top of relevant administration departments’agenda. Thus, people can be exposed to a greater variety of products and have more purchasing options. (272 words)第二类:职场职业类满意不清楚不满意小于等于40岁16.7% 50.0% 33.3%41-50岁0.0% 36.0% 64.0%大于50岁40.0 50.0% 10.0%T opic 9: The difference of job satisfaction among people at diverse ages.From the table chart given above,we can observe that it reflects the statistics of staff’s job satisfaction in a certain company. 50% of staff at the age less than and equal to 40 years old are not clear about their job satisfaction. Staff at the age between 41 and 50 years old who are not content with their jobs account for 64%. When it comes to the staff at the age over 50 years old, we can find that 40% of them are satisfied with their jobs, ranking first among all the three age groups.The table chart reveals that there exists huge difference in job satisfaction among people at different ages. What exactly contribute to this phenomenon ? Reasons can be listed as follows: the reason why people at the age less than and equal to 40s are not clear about their jobs is that they don’t have so much time and energy to reflect on whether his job is goo or not, all they have to do is to work hard and contend for more opportunities. As forthose who are at the age between 41 and 50 years old, confronted with pressures from works, families and society, they can hardly stay put. Instead, they should pour all their energies into making money, supporting their families and enhance their social status. However, entering into a new stage of life: 50 years old, they are more likely to enjoy their life. Moreover, a fat pay, high social status, sense of achievement and respect form others enables them to lead a comfortable and satisfactory life.As common saying goes, “ it is impossible to please anyone.” In terms of jobs, it also can hardly please any staffs. However, we can do something to change the situation : staffs themselves should adjust their attitude towards jobs. The companies should also enforce some policies to improve staffs’ living standard and enhance the sense of gratification. (325words)T opic 10: The changes of Chinese professionsFrom the pie chart given above, we can observe that the professions structure of Chinese people experienced some changes during the past several years. From 1980 to 1999, the percentage of agricultural professions decreased by 30% from 68% to 38%. During the same period, however, service sectors increased rapidly from 5% to 22%. When it comes to the manufacturing professions, its percentage rose markedly from 27% in 1980 to 40% in 1999.The pie chart reveals the phenomenon that there exists some difference in the development tendency among different professions in China. What exactly contribute to this phenomenon ? reasons can be listed as follows: for one thing, with the rapid process of urbanization, people in mounting numbers, especially youngster, have left their village homes ,moved into big cities and thus been out of agricultural industries. Moreover, quite a few people, especially college graduates hold that it is comparatively easy for them to make more money in the service industry. When it comes to the manufacturing industry, its transformation might be attributed to the adjustment of industrial structure: the authorities have issued some preferential policies to promote the rapid extension of manufacturing industry, thus, more workforces are required.By observing the change over the past several years, we may forecast that the proportion of professions of service and manufacture will continue to rise. However, a high value should be placed on the development of agricultural industry by the public and the authorities. Otherwise, with the number of people who are engaged in agriculture diminishing, we will one day have nothing to eat! (262words)T opic 11: Different job inclination between boys and girlsFrom the bar chart given above, we can find that it reflects the statistics of profession inclination between girls and boys. Most obviously, 40% of boys intend to be a manager, with only 15% of girls choosing this job. When it comes to the profession of teacher, we can observe that 45% of girls prefer to take this job, while the proportion of boys only account for 5%, 40% lower than that of girls.The bar chart informs us of the phenomenon that there exists some difference in profession inclination between boys and girls. What exactly contribute to this phenomenon ? reasons can be listed as follow: for one thing, quite a few boys regard being a manager as a symbol of success. As this profession stands for promising futures, fat pay and competence. Moreover, boys’ decision to be a manager can also be attributed to the power of so-called “group dynamics”: when members of their social network prefer to be a manager after graduation, they are easily influenced and imitate others’ behavior unconsciously or consciously. When it comes to girls, the are more inclined to be a teacher. As this profession features stability and respect. Take social and biological factors into account, we know that it is reasonable for girl to choose teacher as their ideal profession goals.Both girls and boys have rights to choose their profession. However, one thing we should bear in mind is that there exists no better or worse, superior or inferior jobs, but suitable and satisfactory ones. (254words)T opic 12:Different additional working hours among diverse professionsFrom the bar chart given above, we can observe that it reflects the statistics of additional working hours among different kinds of professions. Self-employed businessmen spends nearly 2 hours per day in working overtime, ranking first. On the contrary, civil servants’ additional working hours is the shortest, only less than 50 minutes per day. The overtime of scientific researchers, cultural and sports workers and teachers ranks from 80 minutes to less than 50 minutes.The bar chart informs us of the phenomenon that there exists some difference in additional working hours among diverse careers, especially between self-employed businessmen and civil servants. Ample reasons can account for this phenomenon: firstly, to make more profits, businessmen have to spend more time in manufacturing products, attracting and retaining customers and managing staffs. Moreover, with the competition becoming fiercer, they have no alternative but to work overtime to avoid being eliminated by the market and their rivals. When it comes to civil servants, things are not all the thing. Confronted with less risks and pressures, leading a steady and routine life, they don’t have to work overtime frequently.Working overtime is a two-bladed sword. Surely, it will both generate considerable benefits. However, it will give rise to some damages. We should balance our work, life and health. Otherwise we will eventually become a machine and slave of work. (224words)第三类:文化教育T opic 13: The enrollments of The master of engineeringFrom the bar chart given above, we can observe that the enrollments of master of engineering experienced some changes during the past several years. From 1998 to 2000, it increased gradually from roughly 2,500 to nearly 5000. However,it rose rapidly from 15,000 in 2001 to approximately 3,5000 in 2004.The bar chart reveals the phenomenon that the enrollments of master of engineering is growing sharply. Many factors can account for this phenomenon, and the followings might be the most critical ones: for one thing , the authorities have issued some policies to promote the development and expansion of engineering industry which includes architecture, electric engineering and so on. Thus, experts , specialists and graduates majoring in this field are needed. Moreover, Quite a few students hold that a master degree of engineering can ensure them to find an ideal and promising job with ease. Last but not least, students’ decision to pursue a master degree of engineering can also be attributed to the power of “group dynamics”: when members of their social networks take engineering as a college major, they unconsciously imitate and follow the trend.By observing the trend of the past, we may forecast that this tendency will continue. However, A master degree of engineering can not ensure students an ideal and well-paid job, it is their abilities, skills and diligence that will guarantee a satisfactory job and promising future.(234 words)T opic 14: The expansion of university enrollmentsFrom the bar graph given above, we can observe that the enrollments of colleges and universities experienced some changes during the past several years. College enrollments increased rapidly from 1.5 million in 1998 to 2.25 million in 1999. From 1999 to 2000, it ascended more dramatically by 1.15 million from 2.25 million to 3.4 million.The bar char informs us of the phenomenon that students in mounting numbers are going to colleges and universities. Quite a few reasons can account for this phenomenon, and the followings might be the most critical ones: for one thing, the authorities have issued some policies to promote the development of college education and the expansion of enrollment. Additionally, It is universally acknowledged that college education is the basic requirement for an ideal and promising job. Last but not least, with the improvement of financial status, people can afford to pay the intuition of university education.By observing the tendency of the past, combined with the current economic situation, we may forecast that the enrollments of colleges and universities will continue to rise. However, we might as well take the unemployment rate into consideration, with so many students graduating, will there be enough openings for them ? (202 words)T opic 15: Sources of income of American and Chinese studentsFrom the pie chart given above, we can observe that it reflects the statistics of sources of income of American and Chinese students. When it comes to American students, they get 15% of income from scholarship, 35% from part-time jobs and 50% from parents. In terms of Chinese students, income from scholarship accounts for 5%, and 5% of their income are from part-time jobs, 90% from their parents, 40% higher than that of American students.The pie charts informs us of the phenomenon that there exists some difference in the sources of income between American and Chinese students. What exactly contribute to this phenomenon? Reasons can be listed as follows: for one thing, the reason why Chinese students get most of income from their parents is that Chinese parents hold that students should focus all their energies on study, they don’t need to worry about their living expense and endeavor to make money. For another, However, American students tend to have a strong sense of independence. They would rather make money through part-time jobs or scholarship than ask their parents for money.This difference between American and Chinese students may stem from cultural difference. Americans emphasize independence, to encourage students from their parents earlier. While Chinese people emphasize interpersonal relationships ,mutual aid and rely on. From my perspective, Chinese students should enhance their consciousness of independence. On in this way can they be mature sooner. (235 words )T opic 16: Students’ graduation intentionsFrom the table chart given above, we can observe that it reflects the statistics of students’ graduation intention. From 2004 to 2012, the proportion of students who are determined to further study increased rapidly from 45% to 76%. During the same period, the percentage of students who are willing to work after graduation remains steady.The table chart informs us of the phenomenon that students in increasing numbers are willing to further study after graduation. What exactly contribute to this phenomenon? Reason can be listed as follows: for one thing, facing with intense competition in the employment market, quite a few students regard further study as a buffer. moreover, they are convinced that a higher education will put them in a competitive position in the future employment market. their decision could also be attributed to the power of so-called “group dynamics”: when their friends and classmates choose to study after graduation, they will be influenced easily and imitate others’behaviors.By observing the tendency of the past, we may forecast that the proportion of further study will continue to rise. However, students should bear in mind that a higher education will not guarantee them an ideal job. It iscapabilities and skills that determine their future. (206words)第四类:社会负面现象话题T opic 17: The correlation between population growth and extinct speciesFrom the curve chart given above, we can observe that the number of population and extinct species in U.S. experienced some changes during the past several hundreds of years. From 1800 to 2000, the number of population increased rapidly from 0 to 250 million. From 1600 to 1800, the number of extinct species rose gradually from 10 to 30. However, it increased sharply from 30 in 1800 to 70 in 1900.The curve graph informs us of the phenomenon that there exists close correlation in the growth between extinct species and population. Many reasons can account for this phenomenon, and the followings might be the most critical ones: firstly, the growing extinction of species could be attributed to the absence of people’s consciousness of wild animal’s protection. Moreover, to rake in excessive profit margins from animal-products transaction, quite a few businessmen tend to overlook the existence rights of wild animals and poach them savagely. Last but not least, relevant laws and regulations might not have been strictly enforced to impose a heavy penalty on those who poach and kill animals, which also reinforces this trend.something must be done to change the current situation. For one thing, the public should enhance their consciousness of animals’protection. Moreover, a large-scale education campaign should be launched to popularize the idea that wild animals are also members of our nature and ecosystem. Only in this way can we balance the relationships between human being and other species. (244 words)T opic 18: The phenomenon of aging populationFrom the table chart given above, we can observe that it reflects the statistics of the trend of population in China. From 1990 to 2003, the number of people aged 60 and above increased gradually from 97.19 million to 136 million. While from 2020 to 2050, it will ascend from 230 million to 410 million. From 1990 to 2003, the proportion of people aged 60 and above rose slowly from 8.8% to 10.2%. While from 2020 to 2050, it will rise from 15.6% to 27.4%.The table chart informs of the phenomenon that the aging population is becoming increasingly severe. What exactly contribute to this phenomenon? Reasons can be listed as follows: for one thing, the authorities have issued some preferential policies to improve senile security’s system, which enables the elders to lead a comfortable life. Moreover, with the improvement of living standard, elderly people in mounting numbers are placing a high value on health care, thus people can live longer than ever before. Moreover, the phenomenon of aging population canalso be attributed to the improvement of medical technology, many once-seemingly-incurable diseases could be healed nowadays, which means that people lead a much longer life.The aging of the population is a result of social progress and economic development. However, This phenomenon will bring about undesirable consequences in the future. By 2035, economists say, there will be two retirees for each worker. Thus, the problem of how to deal with it should be on the agenda. (247words)T opic 19:Life expectancy and infant mortalityFrom the bar chart given above, we can observe that the life expectancy and infant mortality experienced some changes during the past several years. From 1960 to 1990, the life expectancy increased from 40 years old to roughly 60 years old. During the same period, the rate of infant mortality decreased from nearly 20% to 10%.The bar chart inform us of the phenomenon that people can live longer nowadays. What exactly contribute to this phenomenon ? Reasons can be listed as follows: for one thing, with the improvement of living standard, elderly people in mounting numbers are placing a high value on health care, thus people can live longer than ever before. When it comes to the decline of the rate of infant mortality, it can be attributed to the improvement of medical technology, many once-seemingly-incurable diseases could be healed nowadays, which means that less infant will suffer from fatal diseases and can lead a longer life.Rising life expectancy and decline of infant mortality is a symbol of social progress and economic development. However, it will also bring about some undesirable consequences such as the aging of population. Thus, the problem of how to deal with it should be on the agenda.(204 words)T opic 19: Accidents in a Chinese cityThe table chart given above reveals the statistics of accidents in a Chinese city. 608 accidents are caused by drivers turning left without due care, ranking first, and it increased by 10% over 2004. The number of accidents caused by drivers driving under the influence of alcohol is 208, and it increased rapidly by 15%.The table chart informs us of the phenomenon that accidents are mainly caused by drivers turning left without due care and accidents caused by drivers driving under the influence of alcohol is rising dramatically. What exactly contribute to this phenomenon ? Reasons can be listed as follows: for one thing, accidents caused by turning left without due care can be attributed to the absence of people’s consciousness of driving security. In terms of the causing factor of alcohol, the reason why people often drive after drinking is that laws and regulations might not have been strictly enforced to warn people not to do this.Due attention should be paid to this phenomenon before things get worse. The authorities should impose a。
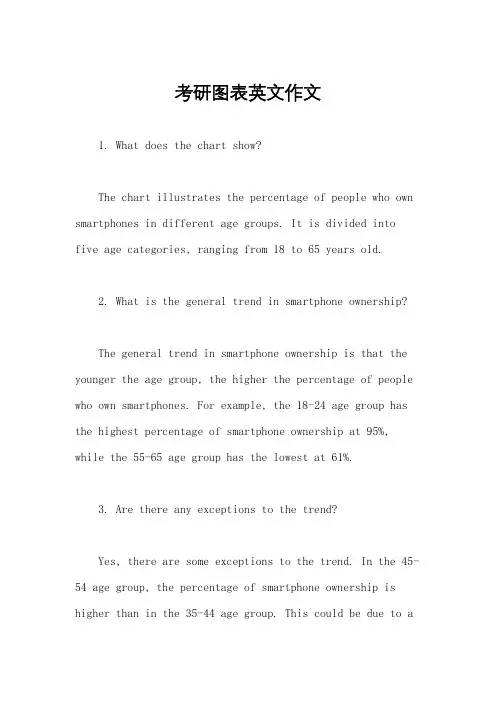
考研图表英文作文1. What does the chart show?The chart illustrates the percentage of people who own smartphones in different age groups. It is divided into five age categories, ranging from 18 to 65 years old.2. What is the general trend in smartphone ownership?The general trend in smartphone ownership is that the younger the age group, the higher the percentage of people who own smartphones. For example, the 18-24 age group has the highest percentage of smartphone ownership at 95%, while the 55-65 age group has the lowest at 61%.3. Are there any exceptions to the trend?Yes, there are some exceptions to the trend. In the 45-54 age group, the percentage of smartphone ownership is higher than in the 35-44 age group. This could be due to avariety of factors, such as increased access to technologyor changes in work and social habits.4. What do you think are the reasons for the trend?There are several reasons for the trend of higher smartphone ownership in younger age groups. One reason is that younger people are more likely to be early adopters of new technology. Additionally, smartphones are often seen as a status symbol among young people, and they may be more likely to prioritize purchasing one over other expenses. Finally, younger people tend to be more tech-savvy and may be more likely to use their smartphones for a variety of purposes, such as social media and entertainment.5. Do you think the trend will continue in the future?It is likely that the trend of higher smartphone ownership in younger age groups will continue in the future. As technology continues to advance and become moreintegrated into daily life, younger people will likely continue to be early adopters and prioritize technology intheir spending. However, it is also possible that as older generations become more comfortable with technology, the gap between age groups may begin to narrow.。
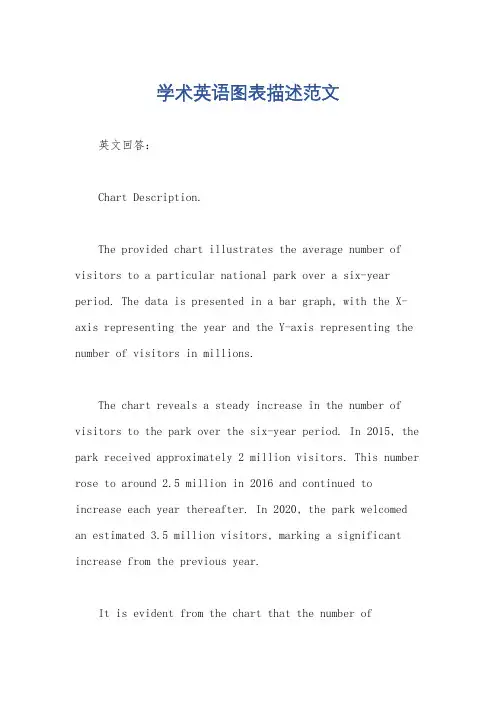
学术英语图表描述范文英文回答:Chart Description.The provided chart illustrates the average number of visitors to a particular national park over a six-year period. The data is presented in a bar graph, with the X-axis representing the year and the Y-axis representing the number of visitors in millions.The chart reveals a steady increase in the number of visitors to the park over the six-year period. In 2015, the park received approximately 2 million visitors. This number rose to around 2.5 million in 2016 and continued to increase each year thereafter. In 2020, the park welcomed an estimated 3.5 million visitors, marking a significant increase from the previous year.It is evident from the chart that the number ofvisitors to the park has grown substantially since 2015. This growth trend suggests that the park is becoming increasingly popular, possibly due to factors such as improved accessibility, increased marketing efforts, or the introduction of new attractions and facilities.中文回答:图表描述。
2023年考研英语一作文范文(精选6篇)2023年考研英语一作文篇1一、不同体裁(一)图表类1.开头句:As is vividly shown/described/depicted inthe picture,______________(图表总内容).From the graph/chart/table/pie/bar, we knowthat______________(图表总内容).2.具体描述:In the first/second/left right cartoon,______________ (单个图表内容).As is shown in the second drawing,______________ (单个图表内容).On the one hand, the picture tells us that______________(单个图表内容); On the other hand, the other one informs us that______________(单个图表内容).3. 结尾句:It is safe to draw the conclusion that______________ (结论).It can easily be seen that______________ (结论).(二)说明类1. Some people are in favor of the ideathat______________ (话题). They point out the fact that______________ (正方观点1).They also argue that_________________ (正方观点2). There might be some element of truth in these people’s belief. However, other people stand on a different ground since they consider it harmful to do so. They firmly point out that______________ (反方观点).2. Recently the issue of whether or not_________________(话题) has been in the limelight and has aroused wide concern in the public. There are two major arguments that can be made for. For one thing, the obvious advantage is that______________ (优点1). For another, it is widely hold that people usually when______________ (优点2). But we must not lose sight of the fact that there are still some drawbacks, one of which is that______________ (缺点1).二、不同题材1.保护环境Though being a little exaggerating, the picture illuminates a serious fact that ______________.And for that matter, a recent report also supported this viewby_____________. On the contrary, we are sad to perceive that _____________. Therefore, in my opinion, it is already high time for the whole world to form a solid cooperation fighting against _____________, because not a single government or person can be exempt from its harm. A series of down-to-earth measures need to be urgently implemented to control _____________.2.人口增长The picture depicts a scene in which_____________. The scene is presented in an artistic and ironic manner. Crowds of people are crammed in_____________. Further examination reveals that_____________. Apparently, the picture symbolizes that humans, with such a huge population, may one day suffer from the exhaustion of earth resources.Take_____________for example. Given the fact that _____________, we find that _____________. To make things worse,_____________. If the conflict between population boom and shortage of resources is not properly controlled, we have every reasonto hold a pessimistic perspective towards human’s future on Earth. Perhaps eventually we would face the situation suggested by the picture, that is,_____________. Accordingly, I strongly recommend that the whole globe launch aggressive programs to address this fatal contradiction.3.身体健康The picture_____________. What is strikingly noticeable is _____________ , but it can be easily explainedby_____________shown in the picture. The unhealthiness discloses a prevalent phenomenon that has long existed in the China. One the one hand,_____________. On the other hand,_____________. As a result, the integration of poor living conditions and work pressure leads naturally to theirpoor health and short life-span, just as the picture tells us. The situation is rather depressing because_____________, and it is largely owing to_____________. To solve the problem, I think there should be a thriving social trend_____________, and those who_____________should be rewarded with good living and working conditions.2023年考研英语一作文篇2一、正面话题模板:As is shown above, in the middle of the cartoon stands + 主题词,which symbolizes + 主题词的另一种表达,+ 同位语即主题词第三种表达 + 表示主题词动作的非谓语动词 (例如:in the middle of the cartoon stands a hot pot,which symbolizes culture,the one containing many Chinese culture symbol. The drawer"s intention seems to be highly self-evident and the meaning causes us to be thought-provoking. It is therefore safe to draw the conclusion that + 主题词 + is momentous and fundamental to the mind what food is vital and significant to the body.)Not only I, but also the best philosophers and poets also praise that this concept should be a permanent universal values. Obviously, I can think of no better reasons for the phenomenon other than the following two. Initially, the millennia-long run of + 主题词+ left us with a lot of traditions that are extremely profoundly rooted. 加拓展句:主题词is a kind of emotional strength, which can support us no matter how dark around us becomes.(比如:爱心/自信/亲情/团结/坚持/诚信/友谊/乐观的态度/是一种情感的力量,无论我们周围有多么的黑暗,它都能支持我们。
2024考研英二作文万能模板一、图表作文。
Nowadays, with the rapid development of economy, the issue of X has aroused wide concern in the public. According to the chart/ graph/ table, it can be observed that X has been on the rise/ decline in recent years. Specifically, in 20XX, the number/ percentage of X reached the highest/ lowest point, which was X. However, in the following years, there was a sharp increase/ decrease, leading to a new figure of X. The reasons for this phenomenon can be explained as follows.To begin with, the primary cause of X is that X. For example, X. In addition, X. Furthermore, X. As a result, X. What's more, X. Last but not least, X. Therefore, X. Consequently, X.In conclusion, based on the above analysis, we can draw a conclusion that X. Therefore, it is of great importance to take effective measures to solve this problem. Only in this way can we X. As far as I am concerned, I believe that X. In this case, X. Only by doing so can we X.二、观点对比类作文。
考研英语图表作文范例50篇(9篇)在学习培训、工作中或日常生活,大家都难以避免地会触碰到作文吧。
尤其是在其中的话题作文,也是普遍,话题作文的主题风格无须从原材料中提炼出,只是从话题讨论引起出去的,原材料的功效取决于阐发话题讨论,启迪学生作文构思,就原材料自身来讲,既能够应用到创作中,还可以不用选用。
下边是我为大伙儿搜集的考研英语图表作文案例50篇【优选9篇】下边是我为大伙儿搜集的,仅作参考,期待可以协助到大伙儿。
If the salinity of ocean waters is analyzed, it is found to vary only slightly from place to place. Nevertheless, some of these small changes are important. There are three basic processes that cause a change in oceanic salinity. One of these is the subtraction of water from the ocean by means of evaporation--- conversion of liquid water to water vapor. In this manner the salinity is increased, since the salts stay behind. If this is carried to the extreme, of course, white crystals of salt would be left behind.The opposite of evaporation is precipitation, such as rain, by which water is added to the ocean. Here the ocean is being diluted so that the salinity is decreased. This may occur in areas of high rainfall or in coastal regions where rivers flow into the ocean. Thus salinity may be increased by the subtraction of water by evaporation, or decreased by the addition of fresh water by precipitation or runoff.Normally, in tropical regions where the sun is very strong, the ocean salinity is somewhat higher than it is in other parts of the world where there is not as much evaporation. Similarly, in coastal regions where rivers dilute the sea, salinity is somewhat lower than in other oceanic areas.A third process by which salinity may be altered is associated with the formation and melting of sea ice. When sea water is frozen, thedissolved materials are left behind. In this manner, sea water directly materials are left behind. In this manner, sea water directly beneath freshly formed sea ice has a higher salinity than it did before the ice appeared. Of course, when this ice melts, it will tend to decrease the salinity of the surrounding water.In the Weddell Sea Antarctica, the densest water in the oceans is formed as a result of this freezing process, which increases the salinity of cold water. This heavy water sinks and is found in the deeper portions of the oceans of the world.英文很重要,不只是在初试中,在复试中,针对名牌大学而言,通常便是一个挑选的副本,针对同等学力同学们而言更是如此,而英语中,作文充分体现你的综合能力了,因此大伙儿要提升自己的作文涵养,借着也有時间要多多的勤奋,下边就从2个层面来谈一谈这个问题。
考研英语图表类作⽂考研英语图表类作⽂模板 图标类的作⽂应该怎么写⽐较合适呢?以下是⼩编整理的考研英语图表类作⽂,欢迎参考阅读! 考研英语图表类作⽂模板1 From the table chart given above, we can observe that it reflects the statistics of students’ graduation intentions. From 2004 to 2012, the proportion of students who were determined to further study increased rapidly from 45% to 76%. During the same period, the percentage of students who were willing to work after graduation remains steady, around 55% to 60%. The table chart informs us of the phenomenon that students in increasing numbers are willing to further study after graduation. What exactly contributes to this phenomenon? Reasons can be listed as follows: for one thing, faced with intense competition in the society, quite a few students are convinced that a higher education will put them in a competitive position in the future employment market. For another, their decision could also be attributed to the power of so-called “group dynamics”: when their friends and classmates choose to study after graduation, they will be influenced easily and imitate other’s behavior. By observing the tendency of the past, we may forecast that the proportion of further study will continue to rise. However, students should bear in mind that a higher education will not guarantee them an ideal job. It is capabilities and skills that determine their future. 考研英语图表类作⽂模板2 The pie charts inform us of the phenomenon that there exists some difference in the sources of income between American and Chinese students. When it comes to American students, they get 15% of income from scholarship, 35% from part-time jobs and 50% from their parents. In terms of Chinese students, income from scholarships accounts for 5%, and another 5% is from part-time jobs. The largest part for Chinese students, 90%, comes from their parents, which is 40% higher than that of American students. This difference reflected in the charts may stem from cultural differences. On the on hand, Americans emphasize independence, and encourage children to learn the ability of earning their living. Chinese students, in a certain degree, don’t have a strong sense of independence. They would rather ask their parents for money than make money through part-time jobs or scholarships. On the other hand, American parents believe part-time jobs can help children master different abilities and improve their learning efficiency while Chinese parents hold that students should focus all their energies on study and they don’t need to worry about their living expenses or endeavor to make money. From my perspective, independence is the symbol of a person’s maturity as well as the crucial ability of surviving in the competitive environment. Chinese students should enhance their consciousness of independence and only in this way can they be mature sooner. 考研英语图表类作⽂模板3 The above bar chart informs us of the phenomenon that there exist some differences in additional working hours among diverse careers, especially between self-employed businessmen and civil servants. Self-employed businessmen spend nearly 2 hours per day in working overtime. On the contrary, civil servants’ additional working hours is the shortest, only less than 50 minutes per day. The overtime of scientific researchers, cultural and sports workers and teachers is 80 minutes, 70 minutes and 55 minutes respectively. Ample reasons can account for this phenomenon. Firstly, to make more profits, self-employed businessmen have to spend more time in manufacturing products, attracting customers, providing after-sale services and managing staff. Moreover, with the competition becoming fiercer, they have no alternative but to work overtime to avoid being eliminated by the market and their rivals. When it comes to civil servants, things have gone otherwise. Confronted with less risks as well as pressures and leading a steady and routine life, they don’t have to work overtime frequently. Working overtime is a two-bladed sword. Surely, it will generate considerable benefits. However, it will give rise to some damages, especially to our health. We should balance our work, life and health or we will eventually become a machine and salve of work.【考研英语图表类作⽂模板】相关⽂章:1.2.3.4.5.6.7.8.。
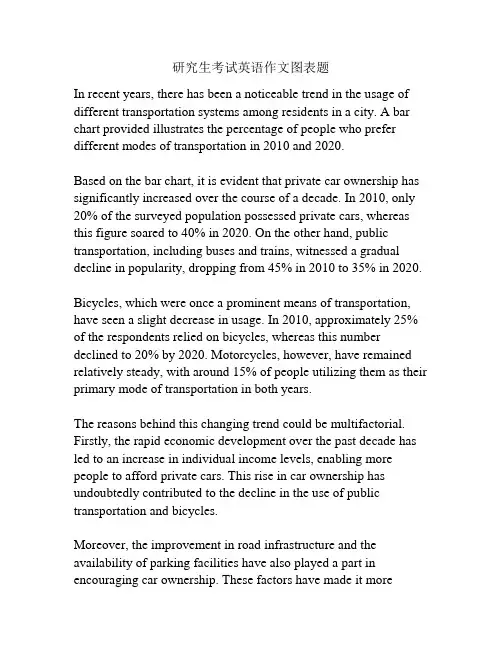
研究生考试英语作文图表题In recent years, there has been a noticeable trend in the usage of different transportation systems among residents in a city. A bar chart provided illustrates the percentage of people who prefer different modes of transportation in 2010 and 2020.Based on the bar chart, it is evident that private car ownership has significantly increased over the course of a decade. In 2010, only 20% of the surveyed population possessed private cars, whereas this figure soared to 40% in 2020. On the other hand, public transportation, including buses and trains, witnessed a gradual decline in popularity, dropping from 45% in 2010 to 35% in 2020.Bicycles, which were once a prominent means of transportation, have seen a slight decrease in usage. In 2010, approximately 25% of the respondents relied on bicycles, whereas this number declined to 20% by 2020. Motorcycles, however, have remained relatively steady, with around 15% of people utilizing them as their primary mode of transportation in both years.The reasons behind this changing trend could be multifactorial. Firstly, the rapid economic development over the past decade has led to an increase in individual income levels, enabling more people to afford private cars. This rise in car ownership has undoubtedly contributed to the decline in the use of public transportation and bicycles.Moreover, the improvement in road infrastructure and the availability of parking facilities have also played a part in encouraging car ownership. These factors have made it moreconvenient and comfortable for individuals to choose private cars over public transportation or bicycles.However, it is important to consider the negative consequences of such a shift towards private car usage. With more cars on the road, traffic congestion and air pollution have become persistent issues in the city. Additionally, the designs of city roads and public transportation systems may need to be revised and updated to accommodate this changing transportation landscape.In conclusion, the bar chart clearly presents the changing preferences of residents in terms of transportation modes. The significant rise in private car ownership, along with the decline in the use of public transportation and bicycles, can be attributed to various factors such as increased income levels, better road infrastructure, and parking facilities. However, it is crucial to address the negative consequences associated with this shift towards private car usage, such as traffic congestion and pollution.。
图表类英语作文范文图表类型的英语写作如果不擅于观察漫画的话,作文写出来可能会偏题。
下面是小编给大家带来图表类英语作文,供大家参阅!图表类英语作文范文篇 1 第一段:说明图表开篇句:As the bar chart shows, ____ during the years of ____to____.扩展句:1、As early as _____.2、Then _____ years later, ____.3、And arriving in the year ____, ____.第二段:解释图表变化原因主题句:Several factors contribute to _____.扩展句:1、______. 原(因1)2、And ______.(原因2)3、Furthermore, ______ ( 原因3)4、All these result in ____.第三段:提出解决办法结尾句:However, ____ is faced with some problems.扩展句:1、With _____, ____, the effect of which is not only discouraging, but also challenging.2、So my principle is to pay due attention to ___, but notjustto____.示范第一段:说明图表开篇句:As the bar chart shows, the number of people below the poverty line decreased dramatically during the years of 1978 to1997.扩展句:1、As early as 1978, about 250 million people were under the poverty line.2、Then seven years later, the number became three fifthsthatof1978.3、And arriving in the year 1997, the number was reducedto50millions.第二段:解释图表变化原因主题句:Several factors contribute to the sharp decrease ofthe below-poverty population.扩展句:1、The reform and opening following 1978 enabledthe peasants to become much better off. ( 原因1)2、And with the development of Chinese economy, that policy also improved city dwellers lives greatly. ( 原因2)3、Furthermore, the high-tech introduced made it possiblefor the countrys economy as a whole to take off. ( 原因3)4 、All these result in the great fall of theChinesepopulationbelow the poverty line.第三段:提出解决办法结尾句:However, a further decrease in the number of poverty-stricken people is faced with some problems.扩展句:1、With quite few employees being laid off, the effect of which is not only discouraging, but also challenging.2 、So my principle is to pay due attention to the newcomers, but not just to care for the poor, say, in remote mountain areas.范文As the bar chart shows, the number of people below thepoverty line decreased dramatically during the years of 1978to 1997. Asearly as 1978, about 250 million people were underthe poverty line.Then seven years later, the number became three fifths that of 1978.And arriving in the year 1997, the number was reduced to 50 millions.Several factors contribute to the sharp decrease of the below-poverty population. The reform and opening following1978 enabled the peasants to become much better off. And with the development of Chinese economy, that policy also improved city dwellers lives greatly. Furthermore, the high-tech introduced made it possible for the countryseconomy as a whole to take off. All these result in the great fallof the Chinese population below the poverty line.However, a further decrease in the number of poverty-stricken people is faced with some problems. With quite few employees being laid off, the effect of which is notonly discouraging, but also challenging. So my principle is topay due attention to the newcomers, but not just to care forthe poor, say, in remote mountain areas.图表类英语作文范文篇2The past years have witnessed a mounting number of Chinese scholars returning from overseas. As is lively illustrated by the column chart, the number of returnees climbed from a mere 69.3 thousand in 2008 to over 272.9 thousand in 2012, at an annual increase rate of around 50%.A multitude of factors may have led to the tendency revealed by the chart, but the following are the critical ones from my perspective. First and foremost, along with the development of Chinese economy and society, the number ofChinese studying abroad has been soaring in the past years,which has provided an expanding base for the number of returnees. In the second place, the government has enacted aseries of preferential policies to attract overseas Chinesescholars back home. Last but not least, the booming economy, science and technology in this country have generated moreattative job opportunites for scholars returning from overseas.The waves of returnees will definitely contribute to this nation’s development, since they have brought back not only advanced science and technology but also pioneering concepts of education and management. With more scholarscoming back from overseas, and with the concerted efforts ofthe whole nation, we have reasons to expect a faster rejuvenation of this country.图表类英语作文范文篇 3 一、图表类型基本单词图表类型:table( 表格)、chart( 图表)、diagram( 图标)、graph( 多指曲线图) 、column chart( 柱状图) 、pie graph( 饼图) 、tree diagram( 树形图)、饼图:pie chart 、直方图或柱形图:bar chart/histogram 、趋势曲线图:line chart/curve diagram 、表格图:table 、流程图或过程图:flow chart/sequence diagram 、程序图:processing/procedures diagram二、图表描述基本词语1、描述:show 、describe 、illustrate 、can be seen from 、clear 、apparent 、reveal 、represent2、内容:figure 、statistic 、number 、percentage 、proportion三、常用的描述句型The table/chart diagram/graph shows (that)According to the table/chart diagram/graphAs (is) shown in the table/chart diagram/graphAs can be seen from the table/chart/diagram/graph/figures ,figures/statistics shows (that)……It can be seen from the figures/statisticsWe can see from the figures/statisticsIt is clear from the figures/statisticsIt is apparent from the figures/statisticstable/chart/diagram/graph figures (that) ……table/chart/diagram/graph shows/describes/illustrates看过图表类英语范文的人还。
考研英语大作文图表作文范文及模板图表作文1.写作攻略图表作文是考研英语写作中较为常见的题型之一,也是难度较大的一种写作题型。
这类作文可综合提供题目、数据、图像、提纲,形式多样,但实际上只涉及5个方面:描述图表、指明寓意、分析原因、联系实际、给出建议,而每次考试只是从这5个方面的内容中选出3个结合在一起。
从写作类型来看,基本上属于说明文。
要求考生围绕题目将有关信息转化为文字形式,考生应该具有一定数据分析和材料归纳的能力,同时会运用一定的写作方法。
考研试题一般以三段式写作方法来组织文章,第一段总结归纳信息反映的整体情况,点出主题思想,第二段回答第一段所得出的问题,对数字、数据等做出有条理的分析比较,第三段做出总结或给以简单的评论。
表格和图表题型写作要点:(1)考生应仔细研究题目以及提示信息,认清图表中的数字、线条、阴影等部分的变化趋势和走向,抓住其主要特点,然后根据图表所显示的中心信息确定内容层次以及主题句。
(2)考生应该仔细研究图表所给出的大量信息,从中选取最重要,最有代表性的信息,然后根据全文的主旨去组织运用所获取的关键信息。
切忌简单地罗列图表所给出的信息。
(3)图表作文一般采用的时态为一般现在时,但如果图表中给出了具体时间参照,考生则应对时态进行相应的调整。
(4)图表作文有一些固定句型和表达法,考生应对此融会贯通。
(5)图表作文可以细分为表格,曲线图、柱形图和饼形图。
除了上述共同要点,考生还应了解这四种图在写作方面的不同特点。
——表格可以表示多种事物的相互关系,所以考生要对表格中所给出的大量数字进行比较分析,从中找出其变化规律。
——曲线图常表示事物的变化趋势,考生应认真观察坐标系所显示的数据信息,并且密切注意交汇在坐标横轴和纵轴上的数字及单位。
——柱形图用来表示各种事物的变化情况及相互关系,要求考生通过宽度相等的柱形的高度或长度差别来判断事物的动态发展趋势,因此考生应密切关注坐标线上的刻度单位及图表旁边的提示说明与文字。
2023考研英语:大作文写作必背框架2023考研英语:大作文写作必背框架一、图表描绘段【例一】①From the picture (graph / chart / table / pie / bar) , we know that 图表内容总概括.②On the one hand, the left / first picture tells us that 情况一, 图一/表一的内容.③On the other hand,(the right/second) picture informs us that 情况二,图二/表二的内容.④It can easily be seen that 提醒图画/表寓意.【例二】①As is vividly shown / described / depicted in the cartoon / picture, 图表内容总概括.②In the first picture, 描绘图 / 表一内容,假如是一个表, 那么可左或上半局部.③As is shown in the second drawing/picture, 描绘图 / 表二内容, 假如是一个表, 那么右或下半局部.④It is safe to draw the conclusion that 提示寓意, 或主题句, 回应主题但不是主题句的重复.二、意义阐述段【例一】①Judging from the pictures, we can clearly infer that the drawer’s intention is 主题句.② 扩展句.③For one thing / First of all / Firstly, 第一个层面.④For another / B esides / Moreover / In addition / Secondly, 第二个层面.⑤Thus / As a result / Therefore / Finally, 总结句.【例二】①To begin with, the purpose of the drawings is to show us that 主题句 , yet the symbolic meanings subtly conveyed should be taken more seriously.② 扩展句 is naturally associated with, to be specific 第一个层面 .③Besides / Moreover / In addition, 第二个层面 .④As a result / Therefore, 总结句 .三、原因阐释段【例一】①There are many reasons responsible for this phenomenon / case/ instance and the following are the typical ones.② The first reason is that 理由一 .③The second reason is that 理由二 .④The third reason is that / A case in point is that/The typical exle is that 理由三 .【例二】①There are many reasons to explain / explaining the effect / phenomenon / case / instance.②The most contri buting one is / the main reason is no other than 理由一 .③What is more, 理由二 .④ 理由三 also play a role in this case.四、建议措施段【例一】①Considering all these reasons / this situation / Confronted with such a problem, I think we need to take some positive measures.②On the one hand, 方法 / 建议一 .③On the other hand, it is necessary for us to 方法 / 建议二 .④Thus / Only in this way, can 总结自己的观点 / 建议 / 态度 .【例二】①In order to improve the situation/To sum up the above argument / Confronted with such an issue/problem, we should find several solutions to it / need to take some positive measures.②On the one hand/For one thing, we should 方法 / 建议一 .③On the other hand/For another, 方法 / 建议二 .④Therefore / Thus / Only in this way, can 段落总结句 .五、趋势预测段【例一】① Accordingly, it is vital fo r us to derive positive implications from these though-provoking drawings.②On the one hand, we can frequently use them to enlighten that 主题 .③On the other hand, we should be sensible enoughto 观点 / 态度 .④Only by 段落总结句 , and only in this way can we have a brilliant future.【例二】①The effects of 主题 can never be overlooked.②To start, 影响一 .③More importantly, 影响二 .④Hence, I believe that we will see a 提出展望 / Nevertheless, I do not think we will see a 或反面展望 , which has produced on can be boiled down to two major ones.以上给出的只是一个简单的框架,通过这个框架考生们可以理解考研英语大作文都写些什么,大家可以在此根底上进展丰富和扩展,形成自己的写作套图或者叫做模板。
考研英语作文模板图表类——积极型考研英语作文模板图表类——积极型(适用于旅游人增多、饮食结构变化、生活水平提高等)(适用于旅游人增多、饮食结构变化、生活水平提高等)It is undeniable that recent years have witnessed a significant change of _the tourist increase__. In light of (比According to 好) statistics profoundly betrayed in the chart, _chart, _The traveller The traveller _ is on the dramatic(或者用extreme 、exceeding) increase with _ over 15% __accounting for _accounting for __80%__ __80%__ of the total. What captures (或者用catches ) my eyes in the chart is there will be two time times s boostin the number of _ visitor numbers __from from __100__ __100__ to to ___300__ ___300__ in the range (或者用scope ) of __of __10_10__ years. It is no difficult job to bring forward 或用put forward (比用come up with 好) some possible factors that underlie the positive changes. Primarily (Initially ), with the remarkable development (或者用swift growth , steady and rapid growth ,) in economy in our country ,It is obvious that our living standards have been greatly improved. People have enough money to enjoy (比用make 好)好)a better life. What’s more (或者用Furthermore, There is one more point, I should touch on ), people have realized (或者用been aware of , been conscious of ,been apprehensive of ) the importance of tourism __ to their physical and mental health. Increasingly, more reports regarding(或者concerning ,with respect to ,regard to 比用about 好) the benefits of ) the benefits of ____ taking a trip __ can be found in TV programs, newspapers and many other fields (或other aspects )of our daily life (或者用in everyday life ), to some extent, play contributing roles in promoting the _ physical and psychological health _.The preceding analysis made leads to the safe conclusion that (或者用As stated above )these changes these changes _of tourism population ___of tourism population __ manifest (或者用demonstrate 、indicate 、state clearly) the notable (比significant 好) social build-up (2011年考研必备新词汇或者用improvements). If this trend proceeds(或者用continues), it will surely be conducive to promote economic development pattern and push forward the construction of harmonious society .考研英语作文模板图表类——消极型考研英语作文模板图表类——消极型(适用于老龄化,社会、人才外流等)(适用于老龄化,社会、人才外流等)It is undeniable that recent years have witnessed an awful phenomenon of __ recent years have witnessed an awful phenomenon of __brainbrain drain _, which has attracted a high degree of concern (或者用has received much attention ) and should demand time ly (或者用immediate 、prompt 、seasonable ) solutions. In light of (比According to 好) statistics profoundly betrayed in the chart above, over the period from 2000 to to 2010 2010 the number of old people remained level. What captures (或者用catches )my eyes in the chart is that there will be a my eyes in the chart is that there will be a two times two times boost in the number of world ’s aging populations from from 300 million 300 million to to 800 million 800 million in the range of the range of 10 10 years.It is common to hear on TV that many countries list __talented person__ as their primary apprehensions in maintaining individual and national survival and prosperity. In the matter of (或者用As for the issue of )____the outward migration of talent the outward migration of talent _, it is situation that (that 也可以省略)has been becoming increasingly unsatisfactory in spite of the fact that most people are still ignorant of the problems it brings about. Primarily (Initially ), if we can , if we can’’t deal well with the trouble of __t deal well with the trouble of __a continual brain drain a continual brain drain _, it will be harm to our social development and harmonious. What ’s more, s more, _lack of _lack of talented people_ would also trigger (或者produce ) some other social problems.As stated above, the rapidity of _As stated above, the rapidity of _ brain drain brain drain _ has made it more urgent for the adoption of counter measures. The common recognition of the importance of the serious situations might be the first step on the right way. So a public educational campaign should be carried out to enhance people campaign should be carried out to enhance people’’s awareness about the problem of __ talent outflow __. If we can . If we can’’t take useful measures, we may not control this trend and some undesirable results may come out unexpectedly, we will see the gloomy future of future of _ strategy of talent powerful nation _ _ strategy of talent powerful nation _.图表的几种表示方式:chart, figure, graphic, diagram, plot ,一篇作文图表词尽量多样化。
In recent years, the trend of pursuing higher education has been on the rise, especially among the younger generation. The chart provided illustrates this phenomenon by comparing the number of undergraduate students and graduate students in a certain university from the year 2000 to 2010.According to the chart, the number of undergraduate students has seen a steady increase from approximately 10,000 in 2000 to around 20,000 in 2010. This indicates a significant growth in the demand for undergraduate education over the decade. On the other hand, the number of graduate students has also experienced a substantial rise, starting from just over 1,000 in 2000 and reaching nearly 5,000 in 2010. This suggests that not only is there a growing interest in undergraduate studies, but the pursuit of advanced degrees has also become increasingly popular.Several factors could account for this trend. Firstly, the rapid development of the economy and the job market has led to a higher demand for skilled professionals, which in turn has driven more individuals to seek higher education. Secondly, the expansion of the university system, with more institutions offering a wider range of programs, has made higher education more accessible to a broader audience. Lastly, societal values that place a premium on academic achievement have also contributed to the surge in the number of students pursuing higher degrees.In conclusion, the chart clearly demonstrates the growing trend of students opting for higher education, both at the undergraduate and graduate levels. This trend is likely to continue as the demand for educated professionals remains high and the opportunities for personal and professional development through education continue to expand.。
考研英语写作:图画图表类2017年考研英语写作模板:图画图表类考研冲刺复习阶段,英语作文部分一定要多练多背,以下是店铺搜索整理的.关于2017年考研英语写作模板:图画图表类,供参考复习,希望对大家有所帮助!想了解更多相关信息请持续关注我们店铺!考研英语大作文模板(图画作文)This illustration depicts_________ (图画中的人物)Ving,with______________(补充说明) Recently it has become common for people in many walks of life to_____________(进一步阐释) It seems to me that the cartoonist is sending a message about _______(图画主题), which is ______________(进一步的说明) He seems to be saying that_______________(给出细节) In my opinion,___________(个人阐述)This simple picture is a wake up call for ______(所涉群体,如the whole of the human race) Therefore, it is imperative for us to take drastic measures to put an end to _____________(问题所在) One the one hand, we must _________________(建议一) It is clear that the drawer of the illustration is urging us to _________(进一步说明) On the other hand,________________(建议二) Only in this way can we___________(展望前景)考研英语大作文模板(图表作文)The chart gives us an overall picture of the ____________(图表主题) The first thing we notice is that_______________(图表最大特点) This means that as __________, _________________(进一步说明) We can see from the statistics given that _______________(图表细节一) After ving_________(细节一中的第一个变化), the _____Ved+幅度+时间(紧跟着的变化) The figures also tells us that_________________________(图表细节二) (数据位置,如In the second column),we can see that ____________accounts for_______(进一步描述)Judging from these figures,we can draw the conclusion that___________(结论) The reason for this,as far as I am concerned is that_____________(给出原因) / It is high time that we Ved(发出倡议)【拓展阅读】2017考研英语作文谚语20句1.Practice makes perfect.熟能生巧。
一、图表作文写作常识1、图形种类及概述法:泛指一份数据图表: a data graph/chart/diagram/illustration/table饼图:pie chart直方图或柱形图:bar chart / histogram趋势曲线图:line chart / curve diagram表格图:table流程图或过程图:flow chart / sequence diagram程序图:processing/procedures diagram2、常用的描述用法The table/chart diagram/graph shows (that)According to the table/chart diagram/graphAs (is) shown in the table/chart diagram/graphAs can be seen from the table/chart/diagram/graph/figures,figures/statistics shows (that)……It can be seen from the figures/statisticsWe can see from the figures/statisticsIt is clear from the figures/statisticsIt is apparent from the figures/statisticstable/chart/diagram/graph figures (that)……table/chart/diagram/graph shows/describes/illustrates how……3、图表中的数据(Data)具体表达法数据(Data)在某一个时间段固定不变:fixed in time在一系列的时间段中转变:changes over time持续变化的data在不同情况下:增加:increase / raise / rise / go up……减少:decrease / grow down / drop / fall……波动:fluctuate / reb ound / undulate / wave……稳定:remain stable / stabilize / level off……最常用的两种表达法:动词+副词形式(Verb+Adverb form)形容词+名词形式(Adjective+Noun form)二、相关常用词组1、主章开头图表类型:table、chart、diagramgraph、column chart、pie graph描述:show、describe、illustrate、can be seen from、clear、apparent、reveal、represent内容:figure、statistic、number、percentage、proportion2、表示数据变化的单词或者词组rapid/rapidly迅速的,飞快的,险峻的dramatic/dramatically戏剧性的,生动的significant/significantly有意义的,重大的,重要的sharp/sharply锐利的,明显的,急剧的steep/steeply急剧升降的steady/steadily稳固的,坚定不移的gradual/gradually渐进的,逐渐的slow/slowly缓慢的,不活跃的slight/slightly轻微的、略微地stable/stably稳定的3、其它在描述中的常用到的词significant changes图中一些较大变化noticeable trend明显趋势during the same period在同一时期grow/grew增长distribute分布,区别unequally不相等地in the case of adv.在……的情况下in terms of / in respect of / regarding在……方面in contrast相反,大不相同government policy政府政策market forces市场规率measure n.尺寸,方法,措施v.估量,调节forecastn.先见,预见v.预测三、考研英语图表写作套句精选1.the table shows the changes in the number of……over the period from……to……该表格描述了在……年之……年间……数量的变化。
考研英语图表作文真题One of the common tasks in the Graduate Entrance Examination (GRE) is to write an essay based on a given bar chart, line graph, or pie chart. This type of question aims to assess your ability to interpret and analyze visual data, as well as your writing skills. In this article, we will explore a sample GRE writing question and provide a step-by-step guide to help you handle such tasks successfully.The given visual data presents the percentage of different age groups participating in physical activities in a certain country. The data is divided into three age groups: 18-25, 26-35, and 36-45. The chart displays the percentage of people engaging in sports, fitness activities, and outdoor activities within each age group.To tackle this writing task effectively, follow the steps below:1. Analyze the chart: Start by carefully examining the chart and understanding the information it conveys. Note any significant trends, patterns, or notable differences between the age groups.2. Introduction: Begin your essay with an introductory paragraph that introduces the given data and outlines the main trends or patterns you observed. Avoid simply restating the chart's information; instead, provide a concise overview of the data.3. Body paragraphs: Develop two to three body paragraphs, each focusing on a distinct trend or comparison between the age groups. Use topic sentences to introduce the main idea of each paragraph and provide supporting evidence from the chart to justify your statements. Remember touse appropriate linking words and phrases to ensure a smooth logical flow between sentences and paragraphs.4. Conclusion: Summarize the key findings from the chart, emphasizing the main points discussed in the body paragraphs. Avoid introducing new information or providing personal opinions in the conclusion. Instead, restate the main trends and outcomes shown in the visual data.To illustrate the above steps, let's write an essay based on the provided chart:---Introduction:The given chart illustrates the proportions of different age groups participating in various physical activities in a particular country. By analyzing this chart, we can gain insights into the exercise habits of individuals aged 18-25, 26-35, and 36-45.Body Paragraph 1:Among the three age groups, individuals between the ages of 18 and 25 display the highest participation rates in all three categories. Specifically, approximately 70% of this age cohort engages in sports activities, making it the most active group in this regard. Furthermore, around 60% and 50% of individuals in this age range partake in fitness activities and outdoor activities, respectively. These findings suggest a strong enthusiasm for physical exercise among young adults.Body Paragraph 2:Moving on to the 26-35 age group, we observe a gradual decline in participation rates compared to the youngest age bracket. Around 55% of individuals in this group involve themselves in sports, indicating a significant decrease compared to the previous age range. Similarly, approximately 45% and 40% of individuals in this category engage in fitness activities and outdoor activities, respectively. These statistics demonstrate a decline in interest and dedication to physical exercise as individuals transition from their early twenties into their thirties.Body Paragraph 3:In the oldest age group, 36-45, the participation rates in physical activities continue to decrease. Approximately 40% of individuals within this age range are involved in sports, while around 30% and 20% participate in fitness and outdoor activities, respectively. These figures suggest a considerable decline in physical exercise engagement among middle-aged individuals.Conclusion:In conclusion, the chart provides a comprehensive overview of how different age groups in a particular country engage in physical activities. The data suggests that individuals aged 18-25 display the highest levels of participation across the categories, followed by a gradual decline in the 26-35 age group. With the oldest group, 36-45, the participation rates experience a further decrease. This information highlights the importance of promoting physical activity across all age groups, particularly in the older population, to enhance overall health and wellbeing.---。