基坑工程的应力路径
- 格式:ppt
- 大小:32.56 MB
- 文档页数:58
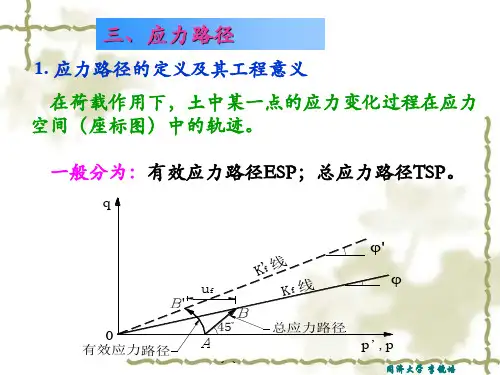
D o w n l o a d e d f r o m a s c e l i b r a r y .o r g b y T o n g j i U n i v e r s i t y o n 12/04/12. C o p y r i g h t A S CE .F o r p e r s o n a l u s e o n l y ; a l l r i g h t s r e s e r v e d .FIG. 1.Idealized Stress Path Associated with Stress Relief:(a)Effective-Stress Path;(b)T otal StressPathFIG. 2.Instrumented PanelIn contrast to element P ,the total stress change experienced by element A results from a reduction in horizontal stress.Changes in vertical stress are comparatively small.The total stress path A 2A 3will move toward the K f compression line with a gradient of 45Њin s Ϫt space,i.e.,⌬t /⌬s =Ϫ1.If the soil is unloaded rapidly so that undrained conditions are main-tained,the corresponding effective-stress path A 2ЈA 3Јwill be vertical.The induced pore-water pressure is negative.As the excess pore-water pressure disspates,the effective-stress path will shift toward the K f compression line.TOP-DOWN CONSTRUCTION AT LION Y ARDThe Lion Yard site is located in the city center of Cam-bridge,U.K.and it is approximately 65ϫ45m on plan.The site was developed as a three-level underground car park be-neath a five-story hotel above ground.The 10-m-deep under-ground car park is retained by a 17-m-deep perimeter rein-forced concrete diaphragm wall that is 0.6m thick (Fig.2).The initial stiffness of the uncracked concrete wall is estimated to be 580MN иm 2/m run.The car park floors,which prop the diaphragm wall,are supported by steel columns connected to the tops of bored piles.The design of the supporting system was fairly conservative and a K 0value of 3was adopted to calculate the design earth pressures for gault clay.The ground conditions comprise approximately 3m of fill and gravel over 38m of gault clay.The gault clay is over-consolidated heavily and consists of stiff-to-hard silty grey fis-sured clay of high plasticity.The ground-water table was at approximately 3m below ground surface before construction.To speed up the construction and to minimize ground de-formations during excavation,the top-down construction method was adopted.For providing a working platform,the ground floor slab (level 4)was cast as soon as the diaphragm wall and bored piles and associated steel columns had been completed.Soil then was excavated from beneath it by me-chanical plants down to the next level (level 3)and removedthrough an opening left in the slab.Similar operations were repeated for subsequent stages of construction until the bottom level (level 1)was reached.Erection of the superstructure was carried out simultaneously.Other details of the construction are given by Ng (1998).For providing vehicle access to each underground parking level after construction,there was a 3.5-m-wide and 19-m-long rectangular opening left in the slabs,adjacent to an instru-mented panel shown in Fig.2.The selected instrumented panel was located near the center of one long side of the site.Tem-porary steel props (152ϫ152ϫ23universal steel columnsD o w n l o a d e d f r o m a s c e l i b r a r y .o r g b y T o n g j i U n i v e r s i t y o n 12/04/12. C o p y r i g h t A S CE .F o r p e r s o n a l u s e o n l y ; a l l r i g h t s r e s e r v e d .TABLE1.Key Construction StagesStage(1)Construction operation(2)Week number(3)I Construction of diaphragm wall 1–7II Excavation to level 318–20III Excavation to level 223–25IV Excavation to level 129–32V 9months after casting level 1slab 78VI25months after casting level 1slab150FIG. teral Displacement of Diaphragm WallFIG. 3.T otal Lateral Pressures during and after Constructionat level 4and 203ϫ203ϫ60universal steel columns at levels 2and 3)were installed at 1.7m spacing (on plan)across these 3.5-m-wide openings at each level to support the dia-phragm wall (including the instrumented panel)during exca-vation.The props were not prestressed,but the ends were grouted after installation.After completion of the level 1slab,the vehicle access ramps were constructed from the lowest level upward and the temporary props were removed once all the concrete ramps had been completed.Key excavation stages,which are relevant to this paper,are summarized in Table 1.During the course of construction,comprehensive instru-ments were installed to monitor the performance of the mul-tipropped excavation.At the instrumented panel shown in Fig.2,seven total earth pressure cells (EPCs)(Glo ¨tzl)and seven pneumatic piezometers were installed on both faces of the di-aphragm wall panel.Each total pressure cell consisted of a sensitive pad (150ϫ250mm),formed by joining two thin plates of steel at their edges.The space between the plates was filled with mercury.The pressure applied by the surrounding ground was transmitted through the mercury to an integral pneumatic diaphragm similar to those used in pneumatic pi-ezometers.The mercury pressure was measured with a pneu-matic readout unit as used for reading piezometers.The cells were designed to operate to a maximum pressure of 1,500kPa.The seven pneumatic piezometers were positioned 150mm below the EPCs to measure the pore-water pressures on the faces of the wall.Hence the effective horizontal stresses can be determined.The surface contact tips of the piezometers were fitted with flat flush stones,which were pushed approx-imately 5mm into the excavated clay surface.The pneumatic piezometer system selected had been developed to measure positive pore pressures only.This imposed a limitation on measuring negative pore-water pressures caused by stress re-lief.In fact,one of the piezometers (PP 1)went to zero during the final stage of excavation (level 1)and so changes of ef-fective stress were not known at that location.Details of other instrumentation and interpreted results including wall deflec-tions,prop forces,and ground deformations are given by Ng (1998).FIELD STRESS P ATHST otal Earth Pressures at Soil-Wall InterfaceInitial stresses in the ground are very difficult to measure and determine accurately.At Lion Yard,initial stresses in the ground were estimated using a self-boring pressuremeter,Schmidt’s (1966)semiempirical rules allowing for reloading,and numerical simulations of the geological processes.Simp-son’s (1992)nonlinear Brick model was used for the numerical simulations.Based on results obtained from these methods,it was concluded that the initial K 0values varied somewhere be-tween 1.0and 2.0for the top 10m of the clay (Ng 1998).The measured lateral pressures on both sides of the wall are shown in Fig.3.A constant initial K 0=1.5with depth is provided for reference.Reduction in lateral stresses at the soil-wall interface following the construction of the diaphragm wall was observed.The reduction in total horizontal stress wassubstantially larger during wall installation than during any subsequent stage of construction.During the subsequent ex-cavation stages,all EPCs excluding EPC7,showed consistent reduction in lateral stresses until the deepest basement level was reached.This observed reduction in lateral stresses was consistent with gradual inward deflections of the wall (Fig.4).In the long-term,there was a general trend of increasing in lateral stresses with time following excavation,except at EPC3.At stage VI (25months after casting level 1slab),four EPCs,EPC4–7(those still functioning properly),recorded an increase in total earth pressure,compared with measurements made before the main excavation.The increase in pressure probably resulted from general swelling of the clay.More de-tails are discussed later in this paper.When considering the measured earth pressures in the ground,it is important to check that equilibrium requirements are satisfied.From beam bending theory,it is well known that there are relationships between applied net pressure,shear force,bending moment,wall curvature,rotation,and deflec-tion.At the instrumented diaphragm wall panel (Fig.2),the field data recorded including measured prop forces (Table 2)and wall rotations measured by electrolevels,enabled an in-ternal check to be carried out on the measured earth pressures if some boundary conditions and wall stiffness were known.This was done by constructing net earth pressure diagrams,which in conjunction with measured prop forces,satisfied the requirements of horizontal force and moment equilibrium,and after triple integration showed agreement with measured wallD o w n l o a d e d f r o m a s c e l i b r a r y .o r g b y T o n g j i U n i v e r s i t y o n 12/04/12. C o p y r i g h t A S CE .F o r p e r s o n a l u s e o n l y ; a l l r i g h t s r e s e r v e d .TABLE2.Summary of Measured Prop ForcesProp force(1)Measured(2)Average L4prop forces (kN/m)14Average L3prop forces (kN/m)119Average L2prop forces (kN/m)144FIG. 5.Interpreted Field Effective-Stress Pathrotations.These deduced earth pressure diagrams then were compared with the measured values of earth pressure (Ling et al.1993).Reasonable consistency was obtained,with an ex-ception at EPC3,which underrecorded lateral stress by ap-proximately 50kPa at the final stage of excavation based on the equilibrium analysis.The continuous decrease of total earth pressure at EPC3probably was caused by the softening of the clay.The EPC1recorded abnormal high stress at stage V (9months after casting level 1slab),and subsequently both EPC1and EPC2ceased functioning.Effective-Stress Paths at Soil-Wall InterfaceChanges in effective stress at the soil-wall interface are pre-sented in Fig.5in the form of stress paths.Four limiting pressure lines also are plotted,which represent Rankine’s ac-tive and passive pressures with and without wall friction.The limiting pressures have been calculated using the results of laboratory tests on intact specimens trimmed from block sam-ples obtained from the site.Details of the laboratory tests on gault clay are given in a subsequent section in the paper later on.Horizontal effective stresses shown in the figure were cal-culated from measured total earth pressures and pore-water pressures at the seven locations of a vertical section at the soil-wall interface.The measured total earth and pore-water pres-sures were very likely to represent the localized behavior at the soil-wall interface only.Vertical effective stresses were cal-culated by assuming that total vertical stresses were equivalent to overburden pressures remote from the wall.The calculated horizontal and vertical effective stresses did not take wall fric-tion into account.The presence of wall friction (or shear stress)at the soil-wall interface would reduce the actual mag-nitude of the vertical stress.However,this reduction is likely to be small and will not affect any conclusions drawn in this paper.As the total vertical stress is assumed to be constant,any change of pore-water pressure thus is reflected by a change of vertical effective stress.The initial state of stress corresponding to the location of each EPC has been determined using the varying K 0profile with depth predicted by the nonlinear brick model.Reloading from gravel on the site has been taken into account (Ng 1992).Immediate after the installation of the instrumented panel,there were substantial reductions in horizontal effective stress at the soil-wall interface at all seven EPCs.Pore-water pres-sures at the soil-wall interface returned to their initial condi-tions within 10days later (Lings et al.1991;Ng 1992).If similar total stress and pore pressure reductions occurred in the soil farther away from the wall,then it would be expected that subsequent equalization of pore pressures would have been accompanied by swelling of the clay during the 3-month period after the construction of the wall.This would be ex-pected to result in an increase in total horizontal stress.On the contrary,all the earth pressure cells registered a decrease rather than an increase in total earth pressures (Fig.3).The recorded decrease in the total earth pressures could be caused by the gradual contraction of the EPCs as the temperature in the ground had decreased continuously after concrete curing.During the main excavation,three effective-stress paths (EPC2,4,and 6)behind the wall moved almost vertically up-ward,as a result of reducing pore pressures accompanied by a small increase in horizontal effective stress.The states of stress behind the wall at the soil-wall interface reached,or were close to,the assumed active condition.After stage V (9months after casting level 1slab),there was a continuous in-crease in horizontal effective stress accompanied by a decrease in vertical effective stress behind the wall.The increase in horizontal effective stress in the long-term is a result of an increase of total earth pressure,which is greater than the rise of pore-water pressure.The increase in the total earth pressure might be caused by long-term swelling of the clay behind the wall.In front of the wall,all three stress paths show an increase in horizontal effective stress with a decrease in vertical effec-tive stress during the period of the main excavation.The soil at EPC3appears to have reached passive failure at stage V as illustrated by the abrupt change of direction of the stress path toward the origin.In contrast,the lowest two EPCs show a continuation of the same stress paths and do not appear to have reached passive failure.D o w n l o a d e d f r o m a s c e l i b r a r y .o r g b y T o n g j i U n i v e r s i t y o n 12/04/12. C o p y r i g h t A S CE .F o r p e r s o n a l u s e o n l y ; a l l r i g h t s r e s e r v e d .The field-observed effective-stress paths behind the wall clearly are very different from the idealized conceptual model shown in Fig.2.The idealization of constant mean effective stress (s Ј)during each excavation stage does not hold (not an undrained behavior)for the stiff fissured clay at the soil-wall interface.This discrepancy could be caused by a number of factors such as observed rapid equilibrium of pore-water pres-sures at the interface during and after each stage of excavation as reported by Lings et al.(1991).‘‘Opening up’’fissures in the clay caused by lateral stress relief or the formation of a ‘‘bleed channel’’at the soil-wall interface during diaphragm wall construction could result in the observed rapid rise of pore-water pressure.On the contrary,the field-observed effec-tive-stress paths in front of the wall can be represented rea-sonably by the idealized conceptual model during the main excavation stages.It can be deduced that the mean effective stress holds approximately constant (an undrained behavior)probably as a result of inward movement of the diaphragm wall during the main excavation.This inward movement could suppress the opening up of fissures in the clay caused by ver-tical stress relief and closing up the bleed channel at the in-terface.LABORATORY STRESS P ATHSDuring the last two stages of excavation at Lion Yard,300ϫ300mm intact block samples were taken using an electric chain saw.They were covered immediately with cling film and nonshrinkable wax and stored in a humidity-controlled room.All the samples used in the tests were from the elevation of ϩ4.8m above ordinary datum (OD)outside diameter,i.e.,approximately 5m below the original ground surface and 2–3m below the clay surface.At that depth,the estimated over-consolidation ration was 25–50.Very few laboratory tests on gault clay have been performed using stress paths and stress levels that are relevant to deep excavations,during which the soil is subjected to unloading either vertically or horizontally at relatively low stress levels.Therefore,a laboratory program was carried out to investigate the response of gault clay related to the excavation at Lion Yard.T est ProgramNatural specimens were reconsolidated isotropically to var-ious preshearing pressures,which were relevant to the stress conditions around the excavation,and then loaded or unloaded along specified stress paths.The K 0reconsolidation was not carried out because zero lateral strains were difficult to achieve even in a computer-controlled triaxial stress path apparatus.In the following,the first and second letters of each set of ab-breviations are used to denote the drainage condition and the shearing mode.1.Drained compression (DC)tests in triaxial cell •DC1:undisturbed,constant p Ј•DC2:undisturbed,constant axial stress but with de-creasing radial stress•DC3:undisturbed,⌬q /⌬p Ј=Ϫ12.Drained extension (DE)tests in triaxial cell •DE1:undisturbed,constant p Ј•DE2:undisturbed,⌬q /⌬p Ј=13.Undrained compression (UC)tests in triaxial cell•UC1:undisturbed,constant radial total stress but with increasing total axial stress•UC2:undisturbed,constant axial total stress but with decreasing total radial stress4.Undrained extension (UE)tests in triaxial cell•UE1:undisturbed,constant radial total stress but withdecreasing total axial stress•UE2:undisturbed,constant axial total stress but with increasing total radial stressAll the tests were conducted under a constant room tem-perature of 24ЊC using a computer-controlled triaxial stress path apparatus.Sample Preparation and T est ProcedureFor the triaxial tests,each block sample was divided into four specimens using a thin wire.Each specimen then was mounted in a soil lathe and trimmed carefully to the required size (150mm long and 75mm in diameter)using various sharp blades.Great care was taken because the clay was fis-sured highly and very apt to fall apart.Small hard nodules frequently were found during the preparation process.The nodules were removed carefully and the cavities were filled with fine material from the parings.For all triaxial tests,the specimens initially were consoli-dated isotropically unless stated otherwise to various pressures before shearing.No side drains were used.The consolidation was carried out against an elevated back-pressure of 200kPa (Atkinson et al.1989)to ensure complete saturation of the specimen.During the shearing stage,the loading or unloading rate was applied slowly at 1.0–1.5kPa/h in drained tests and 5–10kPa/h in undrained tests.On completion of a test,the specimen was removed from the cell.It then was weighed and measured with venier cali-pers,and its water content was determined.Observed Stress Paths and Measured Shear Strength The applied or observed stress paths for the natural speci-mens are shown in Fig.6.The stress paths are expressed in the (s Ј,t )stress space to compare field observations that are likely to be under plane strain conditions.For clarity,only a single stress path is used to denote each series of tests.The critical state line shown in the figure was obtained from tests on reconstituted samples,which possess a critical state friction angle of 26Њ.Details of the tests are given by Ng (1992).All the test results for both reconstituted and natural specimens are summarized in Fig.7,which shows the end points of the stress paths based on the maximum deviator stress failure cri-terion.Although the specimens were subjected to various stress paths,the failure points lie on two common failure en-velopes for each type of material.It is evident that the failure envelopes are different in compression and in extension for both reconstituted and natural samples.For all tests on natural samples,failure took place abruptly along a single slip surface.It was not possible to ascertain whether failure occurred along a preexisting discontinuity,al-though all specimens contained numerous fissures.A higher shear strength was mobilized in extension than in compression.Similar results were found by Tedd and Charles (1985)from tests on natural London clay from Bell Common.Slightly dif-ferent Mohr-Coulomb parameters were found in compression (c Ј=3kPa and Ј=32Њ)and in extension (c Ј=2kPa and Ј=34Њ).COMP ARISON OF FIELD AND LABORATORY STRESS P ATHSFour representative field stress paths monitored at the soil-wall interface are compared with four corresponding stress paths measured in the laboratory in Fig.8.The stress path of UE1terminated a long way from the average passive pressure line probably because the specimen was noted to be extremely fissured during sample preparation and failure took place along a preexisting fissure.D o w n l o a d e d f r o m a s c e l i b r a r y .o r g b y T o n g j i U n i v e r s i t y o n 12/04/12. C o p y r i g h t A S CE .F o r p e r s o n a l u s e o n l y ; a l l r i g h t s r e s e r v e d .FIG. 6.Effective-Stress Path for NaturalSpecimensFIG.7.Failure Points of All SpecimensThe stress paths followed in the UE tests are similar to the field stress paths in front of the wall.There is no obvious difference between a test with constant radial total stress but with decreasing total axial stress (UE1)and an experiment with constant axial total stress but with increasing total radial stress (UE2).This seems to suggest that the stress changes in front of the wall can be represented reasonably by UE tests in the laboratory.In contrast,neither type of compression tests (UC1and UC2)modeled the field conditions behind the wall particularly well,except when the stress state approached ac-tive failure.This is not surprising because the soil at the soil-wall interface had already been reached or was close to the active condition after wall installation,resulting from a sub-stantial horizontal stress relief during the wall construction.Details of a three-dimensional numerical analysis of the dia-phragm wall panel construction at Lion Yard are given by Ng and Yan (1998).Thus it would be consistent to compare the field and laboratory stress paths only in the region near the active condition.It can be seen that the field and laboratory stress paths compare favorably during the main excavation stages.Based on the comparisons of field and laboratory stress paths,practicing engineers may realize that stiff clays locatedbehind a diaphragm wall may easily reach the active condi-tions locally after wall installation.Experimental results from undrained triaxial compression tests (i.e.,reducing radial but keeping axial stress constant)and an undrained assumption only may be used with caution when analyzing and design-ing retaining-wall systems in stiff clays.On the contrary,an undrained assumption inside excavations and the use of un-drained triaxial extension stress path tests (i.e.,reducing axial but keeping radial stress constant)seem to be relevant for en-gineers to derive design parameters for excavations in stiff clays.CONCLUSIONSHorizontal earth and pore-water pressures at the soil-wall interface during the construction of a deep excavation in the stiff fissured clay (gault clay)at Lion Yard,Cambridge,U.K.were measured locally using seven total EPCs and seven pneu-matic piezometers,respectively.Effective-stress changes as-sociated with the vertical and horizontal stress relief during the excavation were obtained from these measurements and expressed in terms of stress paths.The field stress paths were compared with an idealized conceptual model and laboratory measured stress paths.Because the field measurements wereD o w n l o a d e d f r o m a s c e l i b r a r y .o r g b y T o n g j i U n i v e r s i t y o n 12/04/12. C o p y r i g h t A S CE .F o r p e r s o n a l u s e o n l y ; a l l r i g h t s r e s e r v e d .parison of Laboratory and Field Stress Pathstaken locally behind the wall,the conclusions drawn in this paper should be considered carefully for general applications.Based on the local field-observed effective-stress paths be-hind the wall,the theoretical concept of constant mean effec-tive stress during each excavation stage does not hold in the stiff fissured clay,i.e.,the response of the clay was not un-drained at the interface.On the contrary,the field effective-stress paths in front of the wall seem to support the conven-tional assumption about undrained behavior of the clay (constant mean effective stress)inside the excavation.The field effective-stress paths in front of the wall were similar to those stress paths observed in the UE tests in the laboratory.There is no obvious difference between a test with constant radial total stress but with decreasing total axial stress and an experiment with constant axial total stress but with increasing total radial stress in terms of effective-stress path and shear strength.However,for the stress paths behind the wall the field observations did not correspond particularly well with those from laboratory undrained tests on natural speci-mens in compression,except when the stress state approached active failure.ACKNOWLEDGMENTSThe writer would like to thank the financial support from JT Design Build and the Science and Engineering Research Council,and the co-operation of site staff of JT Design Build.The writer also thanks Dr.B.Simpson of Arup Geotechnics and M.Lings and D.Nash of Bristol Uni-versity,U.K.for their useful discussions and comments on the field mon-itoring results.APPENDIX I.REFERENCESAtkinson,J.H.,Lau,W.H.W.,Powell,J.J.M.(1989).‘‘Determination of soil stiffness parameters in stress path probing tests.’’Proc.,12th Int.Conf.on Soil Mech.and Found.Engrg.,Rio de Janeiro ,V ol.1,Balkema,Rotterdam,The Netherlands,7–10.Lambe,T.W.(1967).‘‘Stress path method.’’J.Geotech.Engrg.Div.,ASCE,93(6),309–331.Lings,M.L.,Nash,D.F.T.,and Ng,C.W.W.(1993).‘‘Reliability of earth pressure measurements adjacent to a multi-propped diaphragm wall.’’Retaining structures ,Thomas Telford,London,258–269.Lings,M.L.,Nash,D.F.T.,Ng,C.W.W.,and Boyce,M.D.(1991).‘‘Observed behavior of a deep excavation in Gault clay:A preliminary appraisal.’’Proc.,10th Eur.Conf.on Soil Mech.and Found.Engrg.,Florence ,V ol.2,Balkema,Rotterdam,The Netherlands,467–470.Ng,C.W.W.(1992).‘‘An evaluation of soil-structure interaction asso-ciated with a multi-propped excavation,’’PhD thesis,University of Bristol,U.K.Ng,C.W.W.(1998).‘‘Observed performance of multipropped excavation in stiff clay.’’J.Geotech.and Geoenvir.Engrg.,ASCE,124(9),889–905.Ng,C.W.W.,and Yan,W.M.(1998).‘‘Stress transfer and deformation mechanisms around a diaphragm wall panel.’’J.Geotech.and Geoen-vir.Engrg.,ASCE,124(7),638–648.Schmidt,R.(1966).‘‘Discussions.’’Can.Geo.J.,Ottawa,3(4),239–242.Simpson,B.(1992).‘‘Thirty-second Rankine lecture:Retaining struc-tures:Displacement and design.’’Ge ´otechnique ,42(4),541–576.Tedd,P.,and Charles,J.A.(1985).‘‘The strength of London Clay in relation to the design of embedded retaining walls.’’Ge ´otechnique ,35,199–204.APPENDIX II.NOTATIONThe following symbols are used in this paper:c Ј=effective cohesion;h =subscript h means horizontal direction;K 0=coefficient of earth pressure at rest;K f -line=failure line in s ЈϪt stress space;p Ј=ϩ;(Ј2Ј)/313q =Ϫ;(ЈЈ)13s =(v ϩh )/2;s Ј=ϩ(ЈЈ)/2;v h t =t Ј=(v Ϫh )/2;v =subscript v means vertical direction;u =pore pressure;⌬=increment;1,3=major and minor principal total stresses;Ј,Ј13=major and minor principal effective stresses;h =total horizontal stress;v =total vertical stress;Јh =horizontal effective stress;Јv =vertical effective stress;and Ј=effective angle of friction.D o w n l o a d e d f r o m a s c e l i b r a r y .o r g b y T o n g j i U n i v e r s i t y o n 12/04/12. C o p y r i g h t A S CE .F o r p e r s o n a l u s e o n l y ; a l l r i g h t s r e s e r v e d .。
三向应力状态下应力路径对土体的变形特性的影响作者:朱志政庄心善何世秀来源:《科教导刊》2010年第21期摘要对粉质粘土进行固结不排水真三轴剪切试验,探讨了三向应力状态下应力路径对土体的变形特性的影响,研究结果表明:土体在三向受力状态下,应力路径土体的变形特性的影响显着,平面应变加载试验试样在整个剪切过程中表现为剪缩性,平面应变卸荷试验试样在固结压力较低时表现为剪胀性,在固结压力较高时试样表现为先剪缩再剪胀。
关键词应力路径真三轴试验三向应力中图分类号:TU4文献标识码:A0 引言应力路径对土体的变形特性的影响是一个十分复杂的课题。
大量的试验研究表明,土的应力-应变关系是非线性的,应力路径不同则土体的变形也不同,且与其受的应力状态密切相关。
基于这种认识,我们利用真三轴仪,分别就同一种土在不同的应力路径下,对土体进行固结不排水的平面应变加荷与平面应变卸荷两种不同系列的试验研究,来探讨三向应力状态下应力路径对土体的变形特性的影响。
1 不同应力路径试验1.1 开挖过程中土体的应力路径在软土中进行基坑开挖,由于开挖卸荷改变了原位土体的应力场及地下水等环境因素的变化,土体中平均正应力下降,偏应力则大增,其应力释放及变形过程是十分复杂的,为了便于分析,我们将开挖过程中土体的应力路径做一定的简化。
由于开挖卸荷,支挡结构在两边土压力作用下,将产生水平变位,因此土体的应力状态可简化为是竖向应力基本保持不变,水平向应力在静止侧压力与主动土压力水平分量之间变化;同时基坑底部会产生隆起,应力状态是竖向卸荷量大于横向卸荷量,总体上可简化为竖向卸荷,横向荷载保持不变。
1. 2 试验方案在真三轴仪上,我们进行了两种应力路径试验。
一是对基坑周边为主动区土体的卸荷应力路径进行模拟,其应力状态是竖向荷载不变,横向卸荷,即1不变,3减小,并控制2方向上的应变为零;二是为了对比分析的加载应力路径,应力状态为竖向加荷,横向荷载保持不变,1即增加,3不变,并控制2方向上的应变为零。

基坑开挖应力路径试验与有限元变形分析的研究的开题报告一、研究背景及意义基坑开挖是土木工程中常见的一项工作,将要施工的建筑物下部所需的土壤、岩石等物质从地下部分中挖掘出来。
开挖土体会承受来自上部建筑物及周边土体的水平和竖向荷载,因此施工中应考虑基坑土体的稳定性,充分评估基坑开挖所产生的不同形式的内力和变形特征,以及不断调整支护结构,确保施工安全和环保。
近年来,伴随着计算机技术的发展和数值模拟方法的成熟,在理论研究和数值计算方面,已经取得了许多趋近于实际的成果。
最新技术的广泛应用为有效地保护人类生命和财产的安全提供了支持和补充。
二、研究内容和目标本文旨在从实验和数值模拟两方面入手,对基坑开挖过程中产生的应力路径影响及其成因进行深入探究,刻画其反射至上方建筑物结构的影响程度,并通过有限元数值模拟技术,为基坑开挖设计及施工提供理论参考。
研究内容包括以下几个方面:1.通过现场实验掌握基坑开挖过程中土体应力路径的变化规律,重点研究基坑开挖时土体受到的竖向荷载和水平荷载的影响,以及不同土壤类型的应力路径差异。
2.将实验结果输入到有限元分析软件中,根据现场实际条件建立基坑开挖的三维数值模型,进行应力与变形分析。
通过有限元方法追踪基坑开挖引起的地面变形,识别变形类型、分析特点和模拟过程,并进一步掌握地面变形的规律和变化规律,预测基坑开挖过程中沉降量、应力变化规律以及裂缝产生原因。
3.基于地面变形及裂缝的精确分析,开展结构响应分析,以解决基坑开挖对上部工程建筑物的影响问题。
三、研究方法1.现场实验法:在现有基础条件下建立基坑开挖实验模型,并通过测量土体体变、沉降、裂缝发生情况等指标,对基坑开挖后土体应力路径的变化规律进行观测和测试,收集实验资料,为数值模拟提供数据支撑。
2.数值分析法:采用有限元分析方法,根据实验数据制定三维地下空间的数学模型,对考虑不同土体类型、不同开挖方法及支护措施的基坑开挖问题进行仿真计算。
计算结果包括基坑开挖影响下的土体变形量、沉降量、塑性区域及应力分布情况等参数,进一步解决结构响应分析问题。
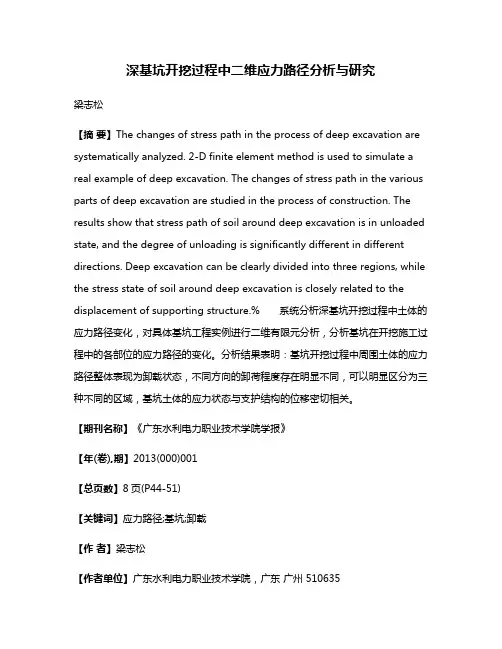
深基坑开挖过程中二维应力路径分析与研究梁志松【摘要】The changes of stress path in the process of deep excavation are systematically analyzed. 2-D finite element method is used to simulate a real example of deep excavation. The changes of stress path in the various parts of deep excavation are studied in the process of construction. The results show that stress path of soil around deep excavation is in unloaded state, and the degree of unloading is significantly different in different directions. Deep excavation can be clearly divided into three regions, while the stress state of soil around deep excavation is closely related to the displacement of supporting structure.% 系统分析深基坑开挖过程中土体的应力路径变化,对具体基坑工程实例进行二维有限元分析,分析基坑在开挖施工过程中的各部位的应力路径的变化。
分析结果表明:基坑开挖过程中周围土体的应力路径整体表现为卸载状态,不同方向的卸荷程度存在明显不同,可以明显区分为三种不同的区域,基坑土体的应力状态与支护结构的位移密切相关。
【期刊名称】《广东水利电力职业技术学院学报》【年(卷),期】2013(000)001【总页数】8页(P44-51)【关键词】应力路径;基坑;卸载【作者】梁志松【作者单位】广东水利电力职业技术学院,广东广州 510635【正文语种】中文【中图分类】TU470随着大规模城市地下空间的开发与利用,深基坑工程日益增多,且规模和深度也在逐渐加大。
基坑开挖应力路径分析摘要:基坑工程的特殊性在于开挖卸荷,而且基坑中不同部位土体卸荷的应力路径是完全不同的。
本文分析表明,基坑开挖有两个主要影响因素:插入比和宽高比。
插入比主要影响基坑变形;宽高比主要影响基坑卸荷应力增量比。
卸荷应力增量比变化幅度很大,宽基坑卸荷应力增量比介于-0.9~0.6之间,窄基坑卸荷应力增量比介于-2.2~1.0之间。
关键词:基坑;卸荷;应力路径Abstract: the foundation pit engineering is the particularity of the excavation unloading, and foundation pit in different parts of the soil mass unloading stress path is completely different. This paper analysis shows that, excavation has two main influence factors: insert ratio and wide aspect ratio. Insert the main influence than deformation; Wide main influence excavation unloading aspect ratio than stress increment. Unloading stress increment the extent than change, wide excavation unloading than stress increment between-between 0.9 and 0.6, and narrow excavation unloading than stress increment between-between 2.2 and 1.0.Keywords: foundation pit; Unloading; Stress path1引文在基坑工程中,土体处于卸荷扰动状态。
试说明深基坑工程中坑周土体与坑底土体的应力路径坑工程的应力路径主要指杆件(如桩和管支护)插入坑壁和坑底,
坑周土体和坑底土体之间的接触面以及有效的应力传递的形式。
1、坑周土体的应力路径
(1)土体自身抗拔作用:坑工程具有自身的抗拔力,一般来说,随着
坑或墙面深度的变深,抗拔力也会增大。
(2)坑壁、坑底和坑土体之间的接触面抗剪作用:通常在拔桩过程中,桩往坑土体中推进,造成坑壁和坑底与坑土体之间的接触抗剪应力,
该应力在拔桩过程中穿越桩体,从而形成完整而有效的应力路径,从
而起到作抗力的作用。
2、坑底土体的应力路径
(1)坑壁、坑底和坑底土体之间的接触面抗剪作用:在拔桩过程中,
由于桩的推力,会造成坑壁和坑底上的接触作用,使产生的抗剪应力
通过桩杆,穿越有效地抵抗拔桩的作用。
(2)坑底土体的自身抗剪作用:抗剪应力也会在坑底土体内部产生,
即平面抗剪应力。
这是由于坑底土体填充在坑壁内,当桩推入坑壁时,土体会抗拒外来的拔桩力,产生内部的抗剪应力,从而形成整个坑底
应力路径。
以上就是坑工程中坑周土体和坑底土体的应力路径的详细介绍:坑周
土体主要是土体自身抗拔作用、坑壁、坑底和坑土体之间的接触面抗
剪作用,而坑底土体主要是坑壁、坑底和坑底土体之间的接触面抗剪
作用、以及坑底土体的自身抗剪作用。
其中,坑壁、坑底和坑土体之间、坑壁、坑底和坑底土体之间的接触面抗剪作用是坑工程应力路径的核心,决定了拔桩作业的安全性。
基坑围护结构应力与变形分析基坑工程作为土木工程中一项重要的工程项目,在建设过程中必然会涉及到基坑围护结构的设计和施工。
基坑围护结构的应力和变形分析是保证基坑工程稳定性和安全性的重要环节。
本文将对基坑围护结构的应力和变形进行分析和探讨。
一、基坑围护结构的类型与特点基坑围护结构按照应力传递方式的不同可以分为传统的支护结构和无支护结构。
支护结构一般采用深基坑回填土或钢支撑墙等形式,通过支撑墙和地基之间的摩擦力来承担地面荷载。
而无支护结构则主要是利用地下水的水压力来支撑周围土体,如土压平衡墙等。
不同类型的基坑围护结构在应力和变形方面存在着差异。
支护结构受到的应力主要来自土体的自重和外部荷载,其应力集中在支护结构和周边土体之间的接触面上。
而无支护结构则受到地下水的压力控制,其应力较为均匀分布在围护结构表面。
在变形方面,支护结构由于存在外部支撑,其变形相对较小,而无支护结构则相对更容易发生较大的变形。
二、基坑围护结构应力分析1. 支护结构的应力分析支护结构的应力分析可以通过有限元数值模拟的方法来进行。
首先,需要建立基坑模型,包括地基的材料特性、支撑墙的几何形状和材料特性等。
然后,通过施加重力荷载和周边土体的侧向土压力,来模拟实际工况下的应力情况。
最后,根据计算结果,可以得到支护结构及周边土体的应力分布情况。
2. 无支护结构的应力分析无支护结构的应力分析主要涉及到地下水的压力计算。
首先,需要了解地下水位的变化规律和地下水的水压力计算公式。
然后,根据地下水水位和土体饱和度,计算出地下水的水压力大小。
最后,根据计算结果,可以得到无支护结构及周围土体的应力分布情况。
三、基坑围护结构变形分析基坑围护结构的变形主要包括纵向和横向的变形。
纵向变形主要指基坑的挖掘深度对围护结构产生的影响,横向变形主要指基坑周边土体对围护结构产生的侧向变形。
变形分析在基坑工程设计和施工中起到了决定性的作用。
对于支护结构,变形分析可以通过两种方式进行。
第18卷第1期铁道科学与工程学报Volume18Number1 2021年1月Journal of Railway Science and Engineering January2021 DOI:10.19713/ki.43−1423/u.T20200270考虑应力路径基坑变形计算及支护性能研究牛建东1,李泽玮1,肖剑2,王克宏3(1.中南大学土木工程学院,湖南长沙410075;2.长沙市规划勘测设计研究院,湖南长沙410007;3.湖南省核工业地质局三〇三大队,湖南长沙410119)摘要:基于半无限大弹性空间在条形荷载作用下应力的Melan解,首先根据基坑开挖过程应力状态的变化,建立基坑开挖问题的平面力学分析模型。
利用Duncan-Chang曲线模型中的参数计算方法,推导加载和卸载模量公式,进而结合平面应变问题的物理方程和几何方程,建立平面应变问题的本构方程,得到基坑开挖后土体位移计算方法。
然后建立土压力与支护结构位移的正弦和幂函数关系曲线,提出土压力计算方法。
最后将理论成果应用于工程实践,将土体位移和土压力的理论值与实测数据进行对比分析。
研究结果表明:该计算模型得到的基坑变形位移与实测结果吻合较好,验证了土压力与位移计算方法的合理性,同时由监测数据得到锚索预应力随时间的三阶段变化趋势,以及深层水平位移和坡顶竖向位移的匙形分布特点。
关键词:深基坑;Melan解;应力路径;位移;土压力;实测数据中图分类号:TU470文献标志码:A文章编号:1672−7029(2021)01−0071−10Deformation calculation and supporting performance offoundation pit considering stress pathNIU Jiandong1,LI Zewei1,XIAO Jian2,WANG Kehong3(1.School of Civil Engineering,Central South University,Changsha410075,China;2.Changsha Planning&Design Survey Institute,Changsha410007,China;3.303Brigade of Hunan Nuclear Geology,Changsha410119,China)Abstract:Based on the Melan’s solution of stress and displacement of semi-infinite elastic space under strip load, the plane analysis model of foundation pit excavation was established according to the change of stress state in the excavation process.By using the parameter calculation method of Duncan-Chang curve model,the modulus formula was deduced.Then,the calculation method of soil displacement after foundation pit excavation was established by combining the physical equation and geometric equation of plane strain problem.The curve of sine and power function between earth pressure and displacement of supporting structure was established and the method of calculating earth pressure was proposed.Finally,the theoretical results were applied to engineering practice,the theoretical value and the measured data were compared and analyzed,and the deformation law of foundation pit excavation was summarized.The results show that the deformation of the pit obtained by the calculation model are in good agreement with the measured results,and the rationality of the calculation method收稿日期:2020−04−06基金项目:国家自然科学基金资助项目(51778634)通信作者:肖剑(1977–),男,湖南长沙人,高级工程师,从事岩土工程勘察、设计和检测方面的研究;E−mail:*****************铁道科学与工程学报2021年1月72of earth pressure and displacement is verified.At the same time,the monitoring data shows the three-stage trend of anchor cable prestress with time is obtained,as well as the spoon shape distribution characteristics of the deep horizontal displacement and the vertical displacement of the slope top.Key words:deep pit;Melan’s solution;stress path;displacement;earth pressure;measured data近年来,随着城市建设的快速发展,大量的深基坑开挖都分布在城市中心建筑物比较密集的地区。
基坑支撑结构挡土的应力传递路径基坑支撑结构挡土的应力传递路径,哎呦,听起来像个很复杂的工程术语对吧?别担心,咱们一起来理一理。
说白了,这就是怎么通过一堆钢筋、混凝土、支撑系统,让基坑周围的土壤不跑到你正在开挖的地方去。
就像你想在家里搞个花园,旁边土堆一大堆,没个护栏怎么能让它老老实实待着?这就是基坑支撑结构的基本任务啦——挡土,保持基坑稳定。
首先啊,你得知道,这个支撑结构可不是随便搭个木头就行的,它必须承受来自土壤的巨大压力。
想象一下,围墙旁边土壤的重量就像一座小山,一旦没有支撑系统稳稳地压住它,那整个基坑就可能一塌糊涂。
哎,真的是一步错,步步错啊。
支撑结构的工作就是承担这些压力,然后把这些应力“传递”到其他地方去,避免它们全部集中在一个地方,搞得土堆和支撑都压力山大。
要讲到“应力传递”这件事,其实就是把这些土壤施加的压力通过支撑结构传递到地面,甚至更深的地方。
你可以想象,这就像是你搬一块大石头,自己肩膀吃不消,赶紧找朋友来帮忙,大家分摊一下,肩膀才不痛。
支撑结构就像这群“好朋友”,它们分担土壤压力,避免单个支撑点承担过多的负荷。
那这些支撑系统是怎么做的呢?嗯,通常有几种方式。
比如钢支撑、混凝土支撑,还有最常见的土钉墙。
钢支撑啊,它一般就是那种看着很霸气的钢材,既结实又能承受很大的力。
它们就像是在基坑四周摆起的坚实“屏障”,把压力一步步传递到更牢固的土层。
混凝土支撑呢,则更像是一块块“大饼”,把压力均匀地分散开。
至于土钉墙嘛,嘿,它的名字也挺有意思的,像土里钉个钉子一样,把土壤固定住,不让它四处溜走。
不过,单靠这些支撑系统,光有“墙”可不行,还得配合其他设备一起工作。
比如说,支撑结构的基础必须足够稳,不能让它自己也因为土壤压力变得不靠谱。
你想,支撑系统得根基深厚,它才敢“顶天立地”。
这些基础部分的设计和施工,尤其是它们的“负担”设计,得考虑得细致入微,不能马虎大意。
稍有疏忽,压力就会像发疯的洪水一样把所有结构都压垮,前功尽弃。