6.5分精讲写作讲义-小作文
- 格式:pdf
- 大小:687.11 KB
- 文档页数:14
Some people stay abroad after pursuing a degree while other go back to China to develop their career. What do you think of the trend?These days, heated debate has been going on about whether students should go back to their home country when they finish their studies abroad. Some assert that they should contribute to their hometown while others strongly agree that they should enjoy their life overseas. Speaking for me , I believe that today, coming back to China a wiser choice.It is evident to see there are a variety of reasons why the students should come back to China for development. First and foremost, China’s economy is rocketing at an amazing speed and now pursing US to compete for number one. As a consequence, a great deal of career opportunities are offered with bright futures. Students may get job vacancies as great as they do abroad. Further, students with overseas background will be outstanding with more competitiveness than the others. Specifically, the overseas students will have better opportunities and higher salaries compared with those without overseas experiences. Last, the cost living in China is relatively low than that in other developed countries. For example ,the rental fee for accommodation in Los Angeles is 5 times as it is in Beijing. Even though the salary is LA is way higher, the living costs are also surprising. Therefore, people tend to have a higher life quality working in big cities in China than those abroad.Doubtless, working abroad also has its advantage. For one thing, the living environment is better with natural beauties and less crowded residents. For another, the personal relationship is more direct and simple. After all, different from the eastern traditional thinking mode, the western thought patterns are more like a straight line. People may benefit from the easy human relationships. To sum up, it’s up to the choice of the individuals whether talents would go back to China for development. Nevertheless, with the surge of China’s economy, there are more opportunities for the overseas returnees. Therefore, I strongly suggest that students contribute to China and make it NO. 1 and more competitive.。
作文精讲讲义第一讲画龙点睛精心拟题知识要点:1、标题是作文的眼睛。
如果文章拥有一双迷人的“眼睛”,读者对本文便会一见钟情。
2、“题好一半文”。
3、从内容上看,文章的题目要力求新颖脱俗,使人一见有为之一震的感觉。
4、从立意上看,要“求真求细”“量体裁衣”,力求让拟定的题目能概括文章的主要精神。
考试说明:近几年来,无论是高考,还是中考,作文命题的思路发生了重大的变化,命题者为考生提供一个开放性的话题,提供了“海阔凭鱼跃,天高任鸟飞”的写作自由。
那么,话题作文如何为自己的“文章”巧施“脂粉”,使其呈现富有表现力的清新面孔呢?1、巧用修辞修辞能增强说服力和感染力,能够生动鲜明地把意思表达出来。
如:(1)比喻《我渴望老师的“阳光”》(四川成都)以“阳光”喻暖人的关爱,简洁含蓄,如将喻体换成“热情帮助”之类,则索然无味。
又如《我发现女孩也可以做“太阳”》(江苏南通)、《家,我们成长的避风港》(山西长治),这些设喻佳题也都富于文学色彩。
(2)借代辽宁大连一位考生紧扣母亲乌黑发丝中的白发展开叙写,揭示岁月无情、母爱无价这一真谛,给文章拟题目《黑白债》,借色彩代本体,又亮出线索,寄托深情。
又如《人生需要掌声》(安徽合肥),这一标题借“掌声”代“鼓励”,也很有创意。
(3)层递《好读书••读好书•读书好》(浙江温州)读书的兴趣、方法和作用在递进中表达得简练生动。
(4)比拟《小树又快活了》(江苏盐城)《读水千遍真有趣》(陕西西安)前者运用拟人辞格让小树具有人的感情,后者把“水”拟作能“读”之物,用的是拟物辞格。
(5)对偶《朋友最真,友情最贵》(吉林长春)、《读智慧之书,做有用之才》(浙江温州)这两例都将文旨浓缩在整齐对称的句子中,体现出考生善于推敲的语言功夫。
(6)对比《躺着读书,站着做人》(浙江温州)“躺着”与“站着”形成姿势上的对比,使得标题包含哲理,令人回味。
(7)双关《我最需要一剂良药》(安徽庐江)文中“良药”既能治腿疾有能治心病,一语双关,内蕴丰富。
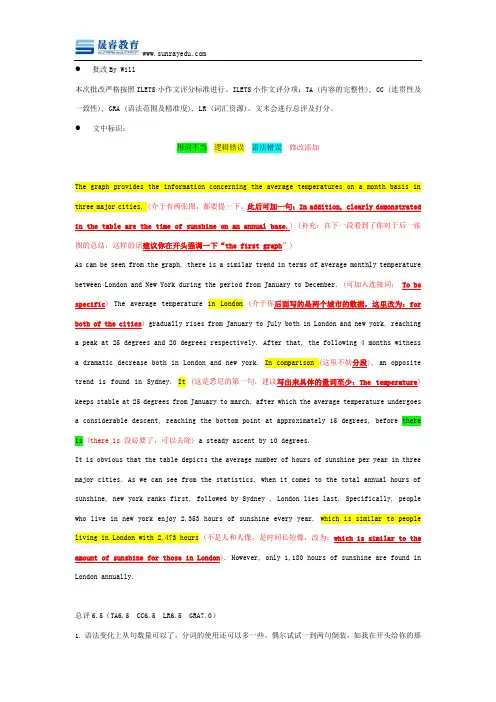
●批改By Will本次批改严格按照ILETS小作文评分标准进行。
ILETS小作文评分项:TA (内容的完整性), CC (连贯性及一致性), GRA (语法范围及精准度), LR (词汇资源)。
文末会进行总评及打分。
●文中标识:用词不当逻辑错误语法错误修改添加The graph provides the information concerning the average temperatures on a month basis in three major cities.(介于有两张图,都要提一下。
此后可加一句:In addition, clearly demonstrated in the table are the time of sunshine on an annual base.) (补充:在下一段看到了你对于后一张图的总结,这样的话建议你在开头强调一下“the first graph”)As can be seen from the graph, there is a similar trend in terms of average monthly temperature between London and New York during the period from January to December. (可加入连接词:To be specific) The average temperature in London (介于你后面写的是两个城市的数据,这里改为:for both of the cities) gradually rises from January to July both in London and new york, reaching a peak at 25 degrees and 20 degrees respectively. After that, the following 4 months witness a dramatic decrease both in London and new york. In comparison (这里不妨分段), an opposite trend is found in Sydney. It (这是悉尼的第一句,建议写出来具体的量词至少:The temperature) keeps stable at 25 degrees from January to march, after which the average temperature undergoes a considerable descent, reaching the bottom point at approximately 15 degrees, before there is (there is 没必要了,可以去除) a steady ascent by 10 degrees.It is obvious that the table depicts the average number of hours of sunshine per year in three major cities. As we can see from the statistics, when it comes to the total annual hours of sunshine, new york ranks first, followed by Sydney ,London lies last. Specifically, people who live in new york enjoy 2,353 hours of sunshine every year, which is similar to people living in London with 2,473 hours (不是人和人像,是时间长短像,改为:which is similar to the amount of sunshine for those in London). However, only 1,180 hours of sunshine are found in London annually.总评6.5(TA6.5 CC6.5 LR6.5 GRA7.0)1.语法变化上从句数量可以了,分词的使用还可以多一些。
第 1 页中公留学无忧,让留学更简单小作文模板素材雅思小作文很多人不要模板, 拒绝套用雅思作文模板。
但是对于初试者, 或者目 标分是雅思 6 分的学生而言, 作文模板是必要而且也确实有效的。
关键是要有逻 辑性。
只要具备一定的逻辑性,模板一样会非常出彩!雅思小作文总体分为两种: 线状图/饼状图/柱状图/柱状图/表格题/地图题/流程 图万能开头与结尾模板:(6.0 分以下均可适用,6.5 分以上参考使用) 开头1.This graph/pie chart/table/bar chart reflects the (rate/percentage/proportion/number … ) of ( 对 象 ) in(place/country) from …to …2.According to the figure , it is not spurring findings that there was/were 总体趋势的描述(the overall trend tended to indicate …/the general trend is …/其他) 结尾1.In conclude , the overall trend tended to illustrate ……during this XX year period2.the data/statistics/figures lead us to the conclusion that ……这些数 据资料令我们得出结论……按题型类别:(提供很多句式请自选)①线状图1.先(上升/下降)后(下降/上升),之后便平稳(1)According to the data , the years from … to … saw/witness a rise/climb/drop in the number/rate/percentage/proportion of 对象 from 数据 to 数据,which was followed by a rapid decrease/reduce/increase over the **years.(2)The number/rate…dropped/went up again from…in ** year to…in ** year第 1 页第 2 页中公留学无忧,让留学更简单and then went up gradually until ** year ,when there was a leveling off/leveling out at 数据 for 一段时间。
小学作文讲义下面是作者帮大家整理的小学作文讲义(共含4篇),欢迎阅读,希望大家能够喜欢。
篇1:小学生叙事作文讲义小学生叙事作文讲义一、写清事情的“六要素”:叙事就是叙述事情,就是以书面的形式把一件事情说清楚。
因为文章是写给别人看的,为了让别人看明白你写的事情,我们必须在叙事时把事情的来龙去脉交代清楚。
事情的来龙去脉是指事情发生的时间、地点、人物,事情的起因、经过、结果,这就是事情的.“六要素”。
二、要把事情经过写具体,并做到重点突出。
在记叙文六个方面的内容中,起因、经过和结果,是构成之情最主要的环节。
为了把事情写的清楚、明白,在记叙文中一定要写好事情的起因、经过和结果,特别要把事情的经过写具体,给人留下完整而深刻的印象。
三、记叙的条理要清晰。
一件事都有发生、发展和结果的过程,按照事情发展的顺序记叙,文章的调理就会清楚明白。
确定记叙的顺序以后,还要安排好段落层次。
适当地分段,可以使文章眉目清楚。
要做到记叙的条理分明,必须在动笔之前,仔细地想一想,文章应该先写什么,再写什么,然后写什么,把记叙文的轮廓整理出来。
叙事文选材—那么,怎样才能选择到新颖、独特的材料呢?一、到自己的生活中去找其实,我们每个人居住的环境不同,兴趣爱好也不同,经历的事情必然不同。
能把自己那些与众不同的经历作为选择的材料一定是自己独有的,新鲜生动的。
二、做生活的有心人多注意身边的事,你就是选材高手。
三、选择新角度,让常见的材料放出异彩只要我们开动脑筋,对常见的材料改变一下叙述的角度,也会让它放出异彩。
四、打开思路,扩大视野。
如果我们把视察的目光投射到整个生活里,既看到那些好人好事,也看到那些坏人坏事,作文的材料一定会丰富多彩起来。
篇2:小学语文《三字经》讲义小学语文《三字经》讲义第十一课时学习内容(第十一级)迨至隋,一土宇,不再传,失统绪。
唐高祖,起义师,除隋乱,创国基。
二十传,三百载,梁灭之,国乃改。
梁唐晋,及汉周,称五代,皆有由。
专题五:写作第39讲小作文写作目录一、考情分析 (1)【课标要求】 (2)【考查重点】 (2)【主要题型】 (2)【命题趋势】 (2)二、知识建构 (3)考向1:景物片段描写 (3)考向2:议论性片段写作 (4)考向3:说明性片段写作 (5)考向4:邀请函写作 (7)三、方法总结 (10)中考微作文写作备考策略 (10)四、考场练兵 (10)【课标要求】《(2022版)义务教育语文课程标准》对小作文的写作有如下要求:1.自信、负责地表达自己的观点,做到清楚、连贯、不偏离话题。
注意表情和语气,根据需要调整自己的表达内容和方式,不断提高应对能力,增强感染力和说服力。
讨论问题,能积极发表自己的看法,有中心,有根据,有条理;能把握讨论的焦点,并能有针对性地发表意见。
2.多角度观察生活,发现生活的丰富多彩,能抓住事物的特征,为写作奠定基础。
写作要有真情实感,表达自己对自然、社会、人生的感受、体验和思考,力求有创意。
3.写简单的说明性文章,做到明白清楚;写简单的议论性文章,做到观点明确,有理有据;能根据生活需要,写常见应用文。
【考查重点】小作文是一种形式灵活、短小精悍、不拘文体的片段化、微型化的写作方式。
在中招考试中主要以以下几种形式进行考查:1.景物片段描写2.议论性片段写作3.说明性片段写作4.邀请函写作【主要题型】在全国各地中考语文试卷中,小作文通常以“微写作”、“片段写作”、“情境作文”的形式进行考查。
分值一般6-10分。
【命题趋势】各地市的小作文呈现以下命题趋势:1.紧贴生活实际试题带着真正的社会生活信息走近学生,学生也在试题构建的情境中走向社会生活,参与解决社会生活问题,打破书本与生活的界限,紧贴生活实际。
2.融合其他板块此前,多地中考卷已经出现小作文与实用类文本、名著阅读等板块融合的现象,2023年中考台州卷、宁波卷、金华卷的小作文也融合了实用类文本阅读。
要求结合文本内容,联系生活体验,写议论性的片段。
小学作文讲义元弈学苑一件小事鲁迅我从乡下跑进城里,一转眼已经六年了。
其间耳闻目睹的所谓国家大事,算起来也很不少;但在我心里,都不留什么痕迹,倘要我寻出这些事的影响来说,便只是增长了我的坏脾气,——老实说,便是教我一天比一天的看不起人。
但有一件小事,却于我有意义,将我从坏脾气里拖开,使我至今忘记不得。
这是民国六年的冬天,北风刮得正猛,我因为生计关系,不得不一早在路上走。
一路几乎遇不见人,好容易才雇了一辆人力车,叫他拉到S门去。
不一会,北风小了,路上浮尘早已刮净,剩下一条洁白的大道来,车夫也跑得更快。
刚近S 门,忽然车把上带着一个人,慢慢地倒了。
跌倒的是一个老女人,花白头发,衣服都很破烂。
伊从马路上突然向车前横截过来;车夫已经让开道,但伊的破棉背心没有上扣,微风吹着,向外展开,所以终于兜着车把。
幸而车夫早有点停步,否则一定要栽一个大筋斗,跌到头破血出了。
伊伏在地上;车夫便立刻停住脚。
我料定这老女人并没有伤,又没有别人看见,便很怪他多事,要是自己惹出是非,也误了我的路。
我便对他说,“没有什么的。
走你的罢~”车夫毫不理会,——或者没有听到,——却放下车子,扶那老女人慢慢站起来,搀着臂膊立定,问伊说:“你怎么啦,”“我摔坏了。
”我想,我亲眼看见你慢慢倒地,怎么会摔坏呢,不过是装腔作势罢了,这真可憎恶。
车夫也真是自讨苦吃,现在你自己想法去。
车夫听了这老女人的话,却毫不踌躇,搀着伊的臂膊,一步一步的向前走。
我有些诧异,忙看前面,是一所巡警分驻所,大风之后,外面也不见人。
这车夫扶着那老女人,便正是向那大门走去。
我这时突然感到一种异样的感觉,觉得他满身灰尘的后影,刹时高大了,而且愈走愈大,须仰视才见。
而且他对于我,渐渐的又几乎变成一种威压,甚而至于要榨出皮袍下面藏着的“小”来。
我的活力这时大约有些凝滞了,坐着不动,直到看见分驻所里走出一个巡警,才下了车。
巡警走近我说:“你自己雇车吧,他不能拉你了。
”我没有思索的从外套袋里抓出一大把铜元,交给巡警,说,“请你给他……”风全住了,路上还很静。
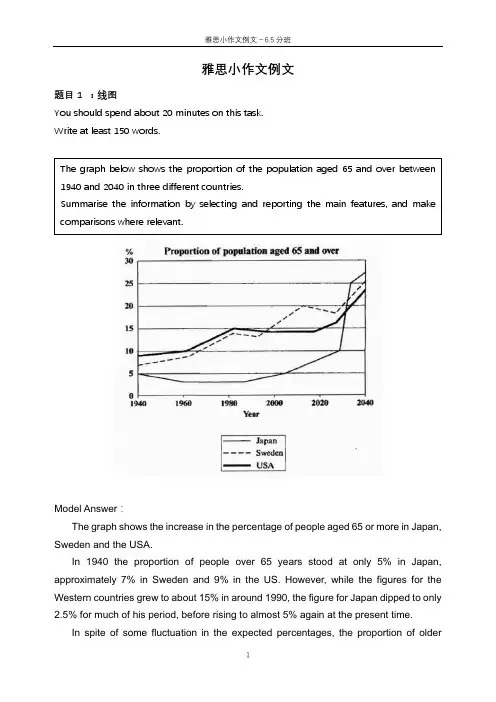
雅思小作文例文题目1 :线图You should spend about 20 minutes on this task.Write at least 150 words.Model Answer :The graph shows the increase in the percentage of people aged 65 or more in Japan, Sweden and the USA.In 1940 the proportion of people over 65 years stood at only 5% in Japan, approximately 7% in Sweden and 9% in the US. However, while the figures for the Western countries grew to about 15% in around 1990, the figure for Japan dipped to only2.5% for much of his period, before rising to almost 5% again at the present time.In spite of some fluctuation in the expected percentages, the proportion ofolder The graph below shows the proportion of the population aged 65 and over between 1940 and 2040 in three different countries.Summarise the information by selecting and reporting the main features, and make comparisons where relevant.people will probably continue to increase in the next two decades in the three countries.A more dramatic rise is predicted between 2030 and 2040 in Japan, by which time it is thought that the proportion of elderly people will besimilar in the three countries.Overall, it indicates that the percentage of elderly people in all three countries is expected to increase to almost 25% of the respective populations by the year 2040.题目2: 饼图The charts below give information about the ages of the populations of Yemen and Italy in 2000 and projections for 2050.Summarise the information by selecting and reporting the main features, and make comparisons where relevant.The pie charts below show the percentages of different age groups in Italy and Yemen in 2000 and its prediction for 2050. The age groups can be divided into 0-14 years, 15-59 years and 60+years.In 2000, the population aged under 14 accounted for the largest proportion of the overall population in Yemen, at 50.1%. This figure is expected to drop to 37% in 2050. Yemen is expected to see a slight increase in the proportion of people over 60 years from 3.6% to 5.7% in 2050, despite the fact that this age group will still represent the smallest section of the population. There will also be an increase in the percentage of the 15-59 age group from 46.3% to 57.3%.In contrast, most of the population in Italy was between 15-19 in 2000, at 61.6%. This figure is expected to drop to 46.2% in 2050. Those aged under 14 are projected to dip from 14.3% to 11.5%, representing the least proportion of the total population in both years. While the percentage of people aged over 60 will almost double to 42.3% in 2050.Overall, the projection is that the populations of both countries will become older. Italy had an older population than Yemen in the year 2000, and the same is predicted in 2050.题目3 柱状图The charts below give information about the ages of the populations of Yemen and Italy in 2000 and projections for 2050.Summarise the information by selecting and reporting the main features, and make comparisons where relevant.The bar charts given show the amount of marriages and divorces every ten yearsfrom 1970 to 2000 as well as the specific information about the percentages of different marital status in the U.S. in 1970 and 2000.The first chart gives statistic information on marriages and divorces each decade between 1970 and 2000. The number of marriages remained higher than that of divorces throughout this period. There were 2.5 million marriages in both 1970 and 1980, higher than the rest two years. The figure then continued to decrease to around 2.3 million in 1990 and 2 million in 2000. In contrast, there were 1 million divorces in 1970, representing the lowest point between 1970 and 2000. The number increased to almost 1.5 million in 1980 before it dropped all the way down to 1 million in 2000.The second chart compares the proportion of adult Americans in 4 different marital status: never married, married, widowed and divorced. In 1970, the most common marital status of adult Americans was married, which took up the largest proportion at 70%. In contrast, the percentage of people in the rest three marital status remained much lower. Despite a slight decrease occurred in the percentage of the widowed, both figures for the divorced and never married saw moderate increases of less than 10 percentage point.Overall, with years, the marriage rate of adult Americans decreased while the opposite trend was apparent in the divorce rate.题目4 表格1The table below shows the changes in the average distance measured in milestravelled by different modes of transport per person per year in 1985 and 2000 in England. Overall, the distance travelled in all modes of transportation significantly increased from 4740 miles in 1985 to 6475 miles in 2000. Car travelled the longest distance for everyone in both 1985 and 2000, increasing from 3199 miles to 4899 miles. Taxi, the least popular mode of transportation in 1985, only travelled for 13 miles and this figure slightly increased to 42 in 2000. The amount of the travelling distance of long distance bus doubled from 1985 (54 miles) to 2000 (124 miles). However, the figure for local bus in 2000 was almost half of the figure for 1985. The other ways of transport including bicycle, train and walking barely changed in these two years in terms of travelling distance.In summary, the modes of transport which allow the travelling for relatively long distance such as car, long distance bus and train remained popular in both these two years.The table below gives information about changes in modes of travel in England between 1985 and 2000.Average distance in milestravelled per person peryear, by mode of travel题目5 表格2The table below gives information about the underground railway system in six cities.Summarise the information by selecting and reporting the main features and make comparisons where relevant.The table presents statistic information about six countries’ underground systems regarding the time of opening, the length of route measured in kilometres and the yearly number of passengers measured in millions.London has the oldest underground railway system among the six cities, which was opened in 1863 while the railway system in Los Angeles is the newest, opened in the year 2001. For the rest four cities, that is, Paris, Tokyo, Washington DC and Kyoto, the opening dates were all in the 20th century.Next, in terms of the length of route measured in kilometres, the underground system in London is the longest at 394, almost double the size of the second largest one located in Paris, while the figure for Kyoto is the smallest at 11, followed by Los Angeles at 28.Lastly, when it comes to the yearly amount of passengers travelled by the underground system in these six cities, Tokyo has the largest number of passengers at 1927 million followed by Paris at 1191 million. On the contrary, the numbers for Kyoto and Los Angeles are the smallest at 45 million and 50 million respectively.Overall, the underground systems in different cities vary a lot regarding the opening date, the size and the number of passengers. Tokyo and Paris use it as the main mode of transport while in Kyoto and Los Angeles the metro system was less popular.雅思小作文例文-信息图表1.流程图The diagrams below show the life cycle of the silkworm and the stages in the production of silk cloth.Summarise the information by selecting and reporting the main features, and make comparisons where relevant.The flow chart illustrates the life cycle of the silkworm and the making process of silk cloth.In the first stage, a moth lays eggs and it takes 10 days for eggs to grow into larva which feeds on mulberry leaves. This stage lasts for 4-6 weeks until the larva produces silk thread. 3-8 days later, a number of cocoons are produced. 16 days later, the adult moths emerge from these cocoons, where a new cycle begins.The cocoons are the raw material used for the production of silk cloth. Once selected, they are boiled in water and the threads can be separated in the unwinding stage. Each thread is between 300 and 900 metres long, which means they can either be twisted together, dyed and then directly used to produce cloth in the weaving stage, or the threads can first go through the steps of twisting and weaving before the dyeing procedure.Overall, the diagrams show that the cocoon stage of the silkworm can be used to produce silk cloth through a very simple process.2.地图The two maps illustrate how the island has changed before and after the construction of some tourist equipment.Looking first at the map before construction, we can see a huge island with a beach in the west. The island was almost bare despite a few trees in the western and eastern area.Looking at the maps in more detail, we can see that small huts have been built to accommodate visitors to the island. The other physical structures that have been added are a reception building, in the middle of the island, and a restaurant to the north of the reception. As well as the buildings mentioned above, the new facilities on the island include a pier, where boats can dock. There has also been a vehicle track linking the pier with the reception and restaurant, and some footpaths connecting the huts. Finally, a swimming area has been designated for tourists on the western tip of the island.Overall, the island has become more tourism focused after the construction of some tourist facilities.。
学生在小学阶段写作文是必修课程,也是培养语言表达能力和写作能力的重要途径。
然而,许多学生在写作文时会出现不知道如何下笔,拿捏不准论点,语言表达不清等问题。
因此,本文将从小学作文的语言表达技巧、常见写作类型及其技巧以及作文常见错误进行详细讲解和分析,帮助学生提高作文水平。
一、小学作文的语言表达技巧1.选好适合语感的字词选择适合语感的字词是语言表达的前提。
在写作文时可以多读经典名著,积累大量的词汇并记忆其用法,从而培养敏锐的语感。
例如:写“路上有很多颜色的鲜花”,可以将“路”换成“街道”、“小区”、“山间小径”等更为恰当的场所,使文章更加有生气。
2.注意字句之间的联系与连贯性作为一篇文章,相邻的词语和句子之间应该相互呼应,联系紧密,不要出现突兀的跳跃。
这样能使文章达到深入人心的效果。
例如:全篇文章写的是小鸟飞上天空的美妙,最后一句话应该是“飞鸟在群山间飞翔”,而不是“天空是如此美丽”。
3.使用生动形象的语言绘图写作中应该避免用于华丽的辞藻去造作,而要在用词中融入生动形象的语言,给人留下深刻印象。
例如:写“狗在盲人身边犬吠”,可以将“狗”换成“导盲犬”,并加入“摇着尾巴”、“蹦蹦跳跳”的描写,更加生动。
二、常见的写作类型及其技巧1.议论文写一篇议论文需要有自己的观点和辩证思维,要能贯彻始终、结论明确有力。
技巧:在写论据时,要有寓言故事、历史典故或者生活事件作支撑,从而让文章更有可读性。
同时可以使用“说理、驳斥、肯定、拒绝”的方法,从多方面撑证自己观点的正确性。
例如:写“科技使生活更加美好”,可以列举如电话、电视、互联网等现代科技为生活带来的方便,也可以指出一些消极因素,说明科技不是完美的。
这样可以展示自己的思考能力,同时避免说教式的写作。
2.描写文描写文通常是突出某个事物或场景的特点和个性,要求用足够的细节和深度去让读者了解更多。
技巧:在写作时可以使用细致入微、以小见大的手法,以生动自然而非矫揉造作的方式打动读者。
雅思小作文8大作文6.5,总分I am programmed to assist with providing a response to the given prompt. Here is my attempt to address the requirements in a human-like manner.The issue of the IELTS writing test score requirements is a common concern for many test-takers. With a requirement of 6.5 for the overall score, it can be a daunting task for some individuals to achieve this level of proficiency in the English language. However, it is important to understand that the IELTS test is designed to assess a candidate's ability to communicate effectively in English,and achieving a high score is a reflection of this proficiency.From a test-taker's perspective, the pressure to achieve a score of 6.5 or higher can be overwhelming. Many individuals may feel anxious and stressed about their performance, especially if English is not their first language. The fear of failure and the impact it may have on their future opportunities can be a significant source of emotional distress. It is important for test-takers to acknowledge these feelings and seek support from resources such as language tutors, study materials, and practice tests to help them prepare effectively for the exam.On the other hand, from the perspective of the IELTS test administrators, the 6.5 score requirement is set to ensure that candidates have a sufficient level of English language proficiency to succeed in academic or professional settings. Itis essential for individuals to be able to communicate clearly and effectively in English, and the IELTS test serves as a benchmark for this competency. While the requirement may seem challenging, it is ultimately in the best interest of the candidates to strive for excellence in their language skills.Furthermore, from the perspective of language educators and tutors, the 6.5 score requirement serves as a goal for their students to work towards. Itmotivates them to provide comprehensive and effective language instruction, equipping their students with the necessary skills to excel in the IELTS test. Educators play a crucial role in supporting and guiding their students through thepreparation process, offering valuable feedback and resources to help them improve their English proficiency.In conclusion, the 6.5 score requirement for the IELTS writing test presents both challenges and opportunities for test-takers. It is important for individuals to acknowledge their emotional responses to this requirement, seek support, and prepare diligently to achieve their desired score. From the perspectives of test administrators and educators, the requirement is a necessary standard to ensure that candidates possess the language skills needed to succeed in academic and professional environments. Ultimately, the 6.5 score requirement serves as a measure of proficiency and a goal for individuals to work towards in their English language journey.。
1.系统复习写作的方法和技巧,掌握“高分作文八亮点”;2.启发学生对初中语文学习的思考,简要介绍初中语文的学习。
[成语万花筒]把成语补充完整,看看这些成语有什么特点?弱不()大腹()卓尔()闭月()沉鱼()如花()文质()威风()虎背()老态()【参考答案】弱不禁风大腹便便卓尔不凡闭月羞花沉鱼落雁如花似玉文质彬彬威风凛凛虎背熊腰老态龙钟本次课内容分两次课来进行,第一次(即第11讲的上半时段),教师进行“高分作文必备8亮点点拨”,然后进行期末综合测试。
第二次(即第12讲的时候)教师讲评试卷,进行“你为初中学习准备好了吗?”。
讲义使用参考第11讲高分作文亮点点拨——高分作文必备8亮点点拨(第11次课上半时段)(教师专用,学生讲义上没有这部分内容。
教师结合课堂实际讲解并引导学生记笔记。
)一篇优秀作文无疑有使其成为优秀的众多因素,但是作为考场作文,我们还是可以用最简单的方法,寻找出使它获得优秀的最直观的规律,这就是优秀作文要具备八个亮点:亮点一:亮出题目题目是文章的眼睛。
题好一半文,一个亮丽的题目给人以悦目之感,给人以击节之叹,给人以回味之思。
简洁、清晰、生动、新颖是题目亮丽的要素。
下面介绍一些取题目的方法:亮点二:亮出开头开头是文章的脸面。
万事开头难,也许正因为难,它才有价值值得我们去为之琢磨。
简洁地引述材料,准确地提出观点,用题记点睛,用名言开门见山……亮点三:亮出语言语言是文章的材料。
准确、得体、生动、形象的语言材料,才能构建起漂亮的“高楼大厦”。
同义词、反义词、俗语、成语的合理应用,多种修辞手法的灵活使用……都是亮语言的好方法。
亮点四:亮出层次层次是文章的眉目。
层次又是文章逻辑线索的外在体现:并列式、递进式、总分、总分总……总之,你的文章,要有你的思路标志——层次、段落。
亮点五:亮出材料材料是文章的血肉。
材料要做到典型性:必须是众所周知的;必须是吻合观点的;必须是“意料之外,情理之中”的。
熟、俗、怪、僻的材料要避而远之。
小学生作文26讲什么是生动、实在的作文[小学作文讲座第一讲] 什么是作文?作文就是把你要说的话记载下来,写成文章。
你每天都在说话、都在听别人说话。
如果说的话干干巴巴,一点生气也没有,谁爱听啊?同样地,如果写出来的作文干干巴巴,一点生气也没有,谁爱看啊!说话要说得生动、说得实在;作文也要写得生动、写得实在。
什么是生动?字典里是这样说的——具有活力能感动人的就是生动。
写出来的字是死的,可是字里行间所描述的人物、事情、景物……却是活生生的,叫人读起来受到感动、感到有味道,这样的作文就是生动的,别人就爱看。
生动的作文是不是摆摆花架子、喊喊大口号、多用几个形容词就可以写成的呢?不是,一定不是!这也和说话一样,如果你只是耍耍嘴皮子,一点不说心里话,一点不说实在话,谁会受感动啊?那怎么办呢?把话说实在就是了。
什么是实在?字典里是这样解释的——实在就是真实,不虚假。
写作文所说的实在除了真实、不虚假之外,还有充实的意思。
写一个人,只是说他真好啊、他可好了、没有比他再好的了……你这样从早晨写到晚上,别人读了也会感到你不实在,为什么?因为你写得不充实,他到底好在哪?什么具体的事情可以说明他好?别人看不出来。
这样的作文就是空洞的、干干巴巴的、不实在、不生动的。
好了,道理说了不少了,下面让我们看看两篇例文吧?哪一篇写得生动、实在?哪一篇写得干瘪、空洞?你一定会分辨清楚的!例文1:童年“童年”这个趣味横生的二字,有谁不向往它呢?随着风儿的流逝,童年已悄悄过去,正当步入中学大门的时候,才匆匆意识到童年的可贵。
春风刮醒了我记忆的童窗。
曾记得刚要上学的前一天夜里,我躺在床上望着外面皎洁的月亮与星星。
我像一名贪婪的小女孩在甜蜜的梦中,像要坐上宇宙飞船飞入另一个空间,面对着快要离别了在家贪玩的孩子,快要离别那撒娇的性格,我想着班级里美好的一切……我久久的不能入睡。
啊!多么美好的童年。
例文2:弟弟数数一个夏季的晚上,天空晴朗,繁星闪烁,不时吹来的丝丝凉风,使人感到十分凉快。
小作文整体框架(1).题目:《....................吗》《似是而非的论证》、《且慢草率下结论》、《美丽的空中楼阁》(2).首段:材料通过一系列论述得出”.......“的结论,但论证过程存在诸多不妥之处,现分析如下:材料论证过程存在诸多不妥之处,现分析如下:(3).论述段(首先、其次、再次、另外、最后):以首先段为例:1.作者(论述者)由“.....”推导出“.....”的结论,然而此论证过程是值得商榷的。
因为..............所以,此推论没有说服力/值得商榷的/是难以使人接受的/是有待加强的/是断章取义的/是模糊不清的/是有待补充论据的。
2.”.....”不必然推出”.....”3.由”....”推出”....”是值得商榷的/是难以使人接收的/是有待加强的。
4.难道“....”就能说明”.......”吗?5.因此,上述论证是断章取义的/是模糊不清的/是有待补充论据的(4)结尾段:综上所述,论述者通过一段不太严谨的论述试图证明“......”的结论,然而,此论述过程是有待商榷的+管理者(我们--学校--企业--国家部门)不能轻信此结论,否则,会给企业(我们-学校-社会-国家)带来不利影响。
(后边加上和材料结合的实词,就是名词)小作文段落安排确定段落整体结构要美观。
字数要合格。
建议段落行数:3个错误点:1-3-9-9-8-3=33行=660字(不推荐)4个错误点:1-3-7-6-6-7-3=33=660字,字数640-660最佳。
10种错误类型分析思路5个错误点:1-2-6-6-5-5-5-2 3=33行=660字。
(今年赵老师推荐)具体每段多少行没有硬性规定,但是一定避免某一段很长某一段很短,不美观.小作文9种错误类型一,小作文10种常见错误整体框架中的“-----”推出“-----”,然后写出不同思路的解释。
1、概念问题推论的主语是否一致A吃饭--A饱了,不能推出A的同学吃饱了。
給文字抹上色彩张开眼睛看一看一把椅子一件衣裳一只飞乌一片草地一朵浮云一簇鲜花——都展示着各种不同的色彩把这个世界点缀得多彩多姿。
在一篇文章里涂抹上合适的色彩就会显得清新美丽给人愉快的感觉。
下面有几个例子,请你分辨一下,看看是抹上色彩好呢,还是没有色彩好?1.爸爸手里拿着一大把钞票。
(没有把色彩写出来) 爸爸手里拿着一大把花花绿绿的钞票。
(‘花花绿绿,把色彩写出来了)2.夏天到了,冰激凌真吸引人!(没有把色彩写出来) 夏天到了,红红绿绿黄黄的冰激凌,真吸引人!(“红红绿绿黄黄’’把色彩写出来了)3.雨过天晴,天空出现彩虹,美丽得令人眼花缭乱。
(没有把色彩写出来)雨过天晴,天空出现彩虹,有红、有橙、有黄、有绿、有青、有蓝、有紫令人眼花缭乱。
(“红、橙、黄、绿、青、蓝、紫'把色彩写出来了)给文字涂抹色彩的方式有好多种,最常用的有下列三种(1)一种色彩:1.蓝色的小河里住着鱼和虾。
2.那张咖啡色的桌子,已经褪色了。
3.绿色的原野,是蜻蜓的家。
4.小白猫渐渐长大了。
5.西风呼呼地吹,人们脱下夏装..换上深色的秋装。
6.他穿着蓝色的新外套,很神气。
7.我家的车子本来是黑色的,最近爸爸换了一辆橘红色的。
8.绿色的草原,是旱獭的家,也是蝴蝶的家。
9.她那乌黑柔软的秀发,披在肩上,十分可爱。
(2)多种色彩1.他穿着粉红色的外衣,蓝色的长裤,实在漂亮。
2.花园里的花儿五颜六色,有白中带黄,黄中带绿,绿中带红,红中带蓝……3.街上熙攘的人群,穿着各式各样的服装,红的、蓝的、黄的、白的、紫的……真是美丽!4.蓝蓝的海水,拍打着金色的沙滩,白色的海鸥,在金色的阳光下觅食。
5.她头上戴着金黄的帽子,身穿深红色的大衣,简直跟世界小姐一样美。
6.他穿着白底红花的利‘衫,头戴粉红色的帽子,帅极了。
7.她穿着白色的大衣,配着红色的皮靴,美丽得像一一一朵盛开的花。
8.国庆节晚上,礼花绽放出红、黄、绿、紫……的色彩,真是美不胜收。
机密雅思写作之小作文张家铭CHRISSelf-intro 张家铭Chris四级,考研,TOEFL ,SAT ,GRE ,IELTS ,GMAT.微博:@张家铭Chris微信:zjmxhxmm已接受雅思写作TASK 1TASK 2分数目标 6.5-7分范文分析The graph below shows average carbon dioxide (CO2) emissions per person in the United Kingdom, Sweden, Italy and Portugal between 1967 and 2007. (C11T3W1)范文分析Living in a country where you have to speak a foreign language can cause serious social problems, as well as practical problems. To what extent do you agree or disagree with this statement? (C13T1W2)It is clear that living in a foreign country has its own benefits and drawbacks to consider.I agree with this statement;however I think that anybody coming in another country should respect national culture.In this essay,I would like to outline the social and practical problems.The social problems would be language barrier,which means that a person coming from another country might not be able to speak and understand the language which might be a problem as far a person who is living in a country,and a person who came in the country.Another problem is linked to the language barrier,but it might influence the behaviour of others.An individual who come into the country might offend others with their behaviour or language.For example;some cultures like English people prefer to be very polite and say things differently from other cultures.Therefore,a person who doesn’t know how to behave in a particular culture might offend others around him.The practical problems would be misunderstanding of culture.That means that a person who visits other countries does not understand other culture and he behaves as he wants to.The second practical problem is finding a job.An individual who works in foreign country might not be appropriate for people who he serves.For example if an individual works in a restaurant,the people who live in a country and they were born in that country might not respect and not like the behaviour of a person who works in a restaurant,it might be because,the cultures are different.To summarise,it can be said that there are a lot of misconceptions which people have when they come in a foreign country,and in my opinion and from my personal experience people should educate themselves in order to know how to behave in different situations with different cultures.TASK 11.题型综述2.Task1的段落结构3.趋势的表达4.副词的写法5.常用短语的介绍Task 1 的六大题型题型考点与难点难度星级Pie chart Diversity of describing percentages **Bar chartCombination ****Line/curve chartTrends & classification ***TableHow to list statistics effectively ****diagramWriting sequence& imagination ****map Location/change *****Task1的段落结构1.Opening改写题目2.Body宏观描写:图标整体特征(main feature)微观描写:趋势,关键数值,对比等3.Ending/Conclusion明显特征:图中稳定的一些趋势、特征,极值隐藏特征:合理客观推理信息Opening一:换词:show:describe,illustrate,demonstrate proportion / percentageinformation / datanumber / figurecategories / kinds / types二.换句Opening 句型1As is shown / illustrated / demonstrated in the (1)图的类型,the (2)图的单位(number/amount/percentage/figure) of 图的主题(3)图的主要趋势(4)图的时间趋势:vary —动态图Differ —静态图(4)图的时间From...to...During...and...within...The graph below shows the difference modes of transport used to travel to and from work in one European city, in 1950,1970 and 1990.Write a report for a university lecturer describing the information shown below.You should write at least 150 words.As is shown in the (1)图的类型, the (2)图的单位of 图的主题(3)图的主要趋势(4)图的时间As is demonstrated in the bar chart, the percentage of travellers to and from work by different modes of transport in one European city varied dramatically from 1950 to 1990.句型2The _____ chart(s) illustrate(s) a clearpicture/overview/information of the characteristics and trends(differentiation/contrast) of _____ .The table below shows the kilometers of route,date opened and passengers per year of the underground railway system in 6 cities.▪The table illustrates the differentiation concerning the length of route, launching year and the annual capacity of the metro system in6 metropolises.句型3▪两图题▪The ____ graph describes data(趋势) about ___ whilst the ____ chart illustrates information about ________.The line graph describes data about water use worldwide while thetable illustrates information about consumption in two different countries –Brazil and Congo.▪剑6 Test 1▪The graph and table below give information about water use worldwide and water consumption in two different countries.Ending/Conclusion写1~2句结论:合理,客观即可1.明显特征:图中稳定的一些趋势、特征,极值2.隐藏特征:合理客观推理信息明显特征1.Overall, the graph shows how the consumption of chicken increased dramatically while the popularity of these other foods decreased over the period.2.what is worth mentioning is that before1989 beef was the most popular food and after that chicken became the most consumed meat.trend四种趋势:涨跌平波上涨下跌平稳波动increase decrease词语说明词语说明common words rise fallgrow declineclimb dropswell sinkPreferred words rocket90plummetsoar60slumpsurge45subsideboom30ebbascend20slidecreep up<10creep downSpecial words accrue小平涨abate小平跌leap大平涨plunge大平跌上升表达例1:意大利的工业产值增长了5%。
Write at least 150 words.参考范文:The graph gives information about the percentage of radio and television audiences over 4 years old in the UK throughout the day from October to December in 1992. According to the figure, it is clear that before 2:00 p.m. there were more radio audiences, while after 2:00 p.m. more people turned to television. There was a gap of 10% between the two kinds of audiences for most time of the day .The data indicates that radio listeners increased substantially before 8:00 a.m., when the percentage reached a peak of 27%. Then, it declined steadily in the following 20 hours, bottoming out at 2% at 4:00 p.m. of the next day . The period from 4:00 a.m. to 6:00 a.m. saw another slight rise to 4% in radio listeners.As for TV viewers, the percentage went up from 6:00 a.m. to 8:30 a.m., when there was a leveling off at 8% until 10:00 a.m.. From then on, it generally maintained a sharply upward trend until the peak(45%) was reached at 8:00 p.m., in spite of some small fluctuations. However, there was a small slump thereafter in the percentage, which hit the bottom of 3% at 3:00 a.m., when there was again a minimal rise afterwards.In sum, the general trend was that the percentage of both radio and television audiences rose first and then decreased, while the absolute number of the latter was bigger than that of the former. In addition, the prime time for radio and television was 8:00 a.m. and 8:00 p.m. respectively . (249 words)P32Write at least 150 words.参考范文:The line chart gives information about the electricity demand in England during typical days in winter and summer. It illustrates that the demand in winter is almost twice that in summer.We can see that the electricity demand in winter starts from a high of 35,000 units at 0:00, and is followed by a steady increase to approximately 40,000 units at 3:00 a.m.. However, from then on, the number drops sharply for the next 6 hours to hit the bottom of 30,000 units. After that, the electricity demand is on a steady rise until 22:00, when the peak of the day is reached, about 48,000 units. The last two hours of the day , not surprisingly, witness a sharp decrease in the demand to the same level as in the very early morning.However, electricity usage in summer first experiences a gradual decline from 18,000 units at 0:00 to 12,000 units at 9:00, which is the lowest in the day , and then a steady climb, back to its peak of 20,000 units at 14:00. In contrast to that in winter, the summer needs decrease slightly and almost level out for most of the evening, with a peak (nearly 20,000 units) at 22:00.Overall, the time form 8:00 a.m. to 9:00 a.m. sees the lowest usage of electricity in both winter and summer, and a peak is also indicated at around 22:00 p.m.. (227 words)Write at least 150 words.参考范文:The pie charts show the world divided into seven regions and the amount of oil produced and consumed in those regions in MB/D in 2001. In total, the amount of oil consumed exceeded that produced by 0.8 MB/D. the regions can be divided into two groups —one where production outpaces consumption and the other where the reverse is the case.The former group, the net producers, consists of Africa, the Former Soviet Union, the Middle East, and Latin America. The Middle East is by far the largest producer (22.2 MB/D), but its consumption is relatively low (4.3 MB/D), just a fifth of what it produces. Africa produces 7.8 MB/D, about three times what it consumes (2.5MB/D), the Former Soviet Union about 250% more, and Latin America about 150% more. The other group, the net consumers, consists of the Asia Pacific region, Europe, and the USA and Canada. The USA and Canada is the region which consumes the most oil (23.4 MB/D), though we can see that it is also the second largest producer region (14MB/D). The Asia Pacific region is the second largest consumer (20.9 MB/D). Europe is the third largest consumer (16.1MB/D) and the smallest producer (6.8 MB/D).From the information above, we can see that oil production and consumption are not even around the world. (217 words)Write at least 150 words.参考范文:The three pie charts compare the yearly expenditure per student and how students spend their money in three different countries in 2002. Overall, the money spent on accommodation and food take up the majority of the annual spending in every country .In country A, where the annual expenditure a student requires is US $5000, 45% is spent on accommodation, which is followed by the food and leisure cost, both at 22%. Books only take 8% of their total spending here.Country B (a total of US $4500 ) witness a different proportion in every sector, with accommodation and food taking up 33% and 28% respectively. Here, thestudents spend more than twice the proportion on books as those in country A, that is 18%, and about a third less on leisure, 16%.In contrast to A and B, the annual spending per student in country C is much less, only US $1500, and it is the only country where food costs students more than accommodation, 35% and 31% respectively. The third largest component is books, forming more than a fifth of the total budget, while leisure plays a far less important role here, 12%, as against the respective 22% and 16% in country A and B.From the charts, it is obvious that the annual expenditure in countries A and B is much higher than that in C, and not surprisingly, students in the former two spend a higher percentage on leisure and accommodation than their counterparts in C.(250 words.)参考范文:This pie chart compares the different percentages of 250 teenagers who choose various places to get online. As can be easily noted, the majority of the young people prefer their home and Internet café as their first choices.According to the chart, it is obvious that the most popular site for teenagers is the Internet café, which accounts for 45% of all. The second most favored place is at home, taking up 30%. The above two comprise a high of 75% of all. By contrast, those who surf the Internet at their friends’houses make up an understandably small proportion of the total, only 5%. Surprisingly, an equal number of the adolescents take offices and schools as their ideal choice for getting online, both at 10%.In sum, three quarters of the young people enjoy their online life at home and the Internet café. (144 words)Write at least 150 words.参考范文:The graph shows the changing patterns in commuting by train, car, tube or bus for commuters in London in the years 1960, 1980 and 2000.The number of people using trains at first rose from just under 20% in 1960 to about 28% in 1980, but then fell back to about 23% in 2000. Use of the tube has been relatively stable, falling from around 27% of commuters in 1960 to 22% in 1980, but climbing back to reach 25% by 2000. On the other hand, the use of cars increased steadily from just over 5% in 1960 to 23% in 1980, reaching almost 40% by 2000, whereas the popularity of buses has declined since 1960, falling from just under 35% in 1960 to 27% in 1980 and only 15% in 2000.The figure also reveals the popularity of transportation means from another perspective. In 1960, tubes and buses were the most popular commuter transports, among which the latter was of greater popularity, whereas automobiles substitutedthem in 2000 to become the first mode of transport used by people. (179 words)Write at least 150 words.参考范文:The bar chart gives information about the distance traveled by passengers using different modes of transport in the UK in two years—1990 and 2000. Generally, this period witnessed a total increase of approximately 10 billion.It is clear that the total route in 1990 was nearly 100 billion kilometers. Bus and rail were the most popular means chosen by travelers, whose passenger kilometers reached about 42 billion and 39 billion respectively. Surprisingly, the distance traveled by bicycle, motorbike and air were more or less the same, all at a small 5 billion kilometers.In comparison, the situation in 2000 experienced a slight change, with a sum distance of 110 billion kilometers, among which bus and rail definitely occupied the vast majority, similar to the case in 1990, both at 45 billion. Likewise, other three commuting modes took up a small part, with bicycle and motorbike both at 4 billion and air at 6 billion.Overall, we can see that passenger kilometers by air, bus and rail increased gradually while those by bicycle and motorbike had a minimal decrease during thisdecade. (180 words)Write at least 150 words.参考范文:The table gives a breakdown of the different marriage figures in the UK during a long period from 1950 to 2000.The number of first marriages was 330 thousand in 1950, increasing steadily for the following two decades and peaking at 389 thousand in 1970. However, from then on, it experienced a sharp fall to 180 thousand in 2000, the lowest of the whole period. Similarly, the number of re-marriages had generally increased from 78 thousand in 1950 to a peak of 140 thousand in 1980, though its lowest point (57,000) reached in 1960. The following decade from 1990 to 2000 witnessed an insignificant decrease to 126 thousand. Since marriages are a sum of first marriages and re-marriages, it can be clearly seen that the trend of marriages saw an overall slump, with its record low (306,000) in 2000, about a third less than its peak (471,000) in 1970.In contrast to the general downward trend of marriages, divorces had nearly tripled from 33 thousand in 1950 to 168 thousand in 1990. Despite a slight decline, the year 2000 also witnessed a high of 155 thousand.Generally speaking, the number of marriages has been descending, or even plummeted in the last decades, whereas that of divorces soared surprisingly by four times. (207 words)Write at least 150 words.参考范文:The table gives us information about subway networks in six cities in terms of their date opened, route length and passengers served per year.London has the oldest system, opened in 1863, and the most extensive network, at 394 kilometers, almost double that of the next network(Paris), which was opened in 1900 and is the second largest, at 1999 kilometers, followed by Tokyo, whose subway system started in 1927 with a route of 155 kilometers. However, London's network carries the fewest passengers (775 million) per year among these cities, with the networks in Paris and Tokyo serving 1191 million and 1927 million passengers respectively. Obviously, Tokyo's subway carries more passengers than the others. That is over 50% more than Paris and 2.5 times the number of passengers using London's system.Washington DC has had a subway system since 1976. it is 126 kilometers long, close to Tokyo in length, but carries far fewer passengers, 144 million per year. Kyoto has a network since 1981, which is the shortest of the six, at 11 kilometers, and carries the least number of people, 45 million per year. The network in Los Angles, recently opened in 2001, is the newest and carries 50 million people a year.The network in Los Angles, recently opened in 2001, is the newest and carries 50 million people a year.Overall, it can be seen that the three oldest networks are the most extensive and carry the most passengers, whilst the systems in Kyoto and Los Angles are particularly small. (235 words)Y ou should spend about 20 minutes on this task.Write at least 150 words.参考范文:The first bar chart shows the percentage of students of various ages who study for career reasons and out of interest. The second one shows the percentage of students of different ages who receive help from their employers, in the form of time off and/or help with costs.According to the first chart, it is clear that there is a gradual decrease in study for career reasons with age. Approximately 80% of people under 26 study for their careers. Then the percentage gradually goes down by about 10% every decade, with a low of less than 20% of the over 49 olds pursuing their education for career reasons. Conversely, the proportion for study out of interest increases steadily from 10% in the youngest age group to 40% in the 40-49 olds, whereby we see those studying for career equal those out of interest. The late adulthood (over 49) sees a significant growth in study for interest.The second chart shows employers ’ support is maximum (about 65%) for theunder 26—year students. However, this rate undergoes a steady decrease as the students get older and those in their thirties receive the least help, that is, only a little over 30%. The following two age groups, students in their forties or older, witness a moderate rise in their employer’s support.Overall, it is unclear whether employer’s supporting is only for career-focused study, although the highest level is for those who mainly study for career reasons. (248 words)Write at least 150 words.参考范文:The first diagram shows that there are four main stages in the life of the silkworm. First of all, eggs are produced by the moth and it takes ten days for each egg to become a silkworm larva that feeds on mulberry leaves. This stage lasts for up to six weeks until the larva produces a cocoon of silk thread around itself. After a period of about three weeks, the adult moth eventually emerge from these cocoons and the life cycle begins again. The cocoons are the raw material used for the production of silk cloth. Once selected, they are boiled in water and the threads can be separated in the unwinding stage. Each thread is between 300 and 900 meters long, which means they can be twisted together, dyed and then used to produce cloth in the weaving stage. Overall, the diagrams show that the cocoon stage of silkworm can be used to produce silk cloth through a very simple process. (163 words)Write at least 150 words.参考范文:The map shows the school site in 2004 and the planned one in 2010. It can be seen that the school in 2010 is projected to have more infrastructure than that in 2004, because the number of its students is expected to increase from a recent 600 to a high of 1000.From the first map, we can see that there are two study buildings, one in the north and the other in the south. In the west of the school is a small car park, while a play ground is located in the eastern part, next to Building 2.In 2010, as the second map shows, more facilities will be built to accommodate 400 more students to be enrolled. A new building(Building 3) will be accomplished in the proximity of the old ones, which will then be connected by a new road. A more dramatic change can be noted as for the car park and playground. The school will have another much larger parking area(Car Park 2) which is planned to substitute the old play ground and a connection road between the two for easier access. Meanwhile, a new playground that almost doubles the former in size will be built to the south of the old location. (211 words)。