经济学原理曼昆Chapter 02
- 格式:doc
- 大小:102.05 KB
- 文档页数:7

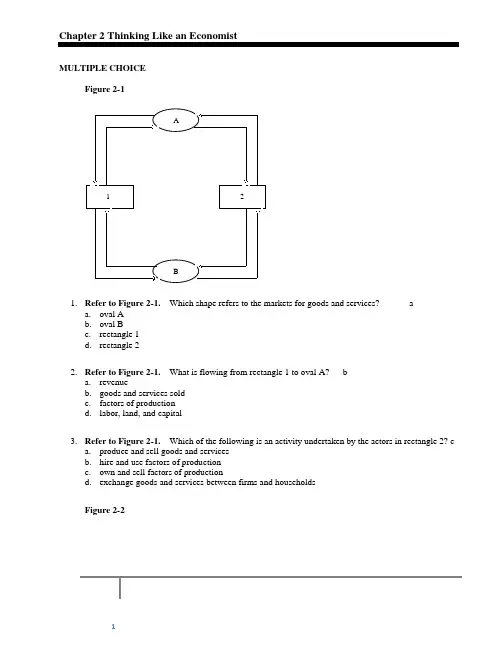
Chapter 2 Thinking Like an EconomistMULTIPLE CHOICEFigure 2-1AB 211. Refer to Figure 2-1.Which shape refers to the markets for goods and services? aa. oval Ab. oval Bc. rectangle 1d. rectangle 22. Refer to Figure 2-1.What is flowing from rectangle 1 to oval A? ba. revenueb. goods and services soldc. factors of productiond. labor, land, and capital3. Refer to Figure 2-1.Which of the following is an activity undertaken by the actors in rectangle 2? ca. produce and sell goods and servicesb. hire and use factors of productionc. own and sell factors of productiond. exchange goods and services between firms and householdsFigure 2-212345678910Consider the production possibilities curve for a country that can produce cars, corn (in bushels), or a combination of the two. 4. Refer to Figure 2-2. If this economy devotes all of its available resources to producing corn, then itwill produce da. 0 bushels of corn and 10 cars.b. 135 bushels of corn and 3 carsc. 160 bushels of corn and 10 cars.d. 160 bushels of corn and 0 cars.5. Refer to Figure 2-2. Which combination of points show production possibilities only achievablewith improvements in technology or increases in resources? da. A, D, and Eb. B and Gc. C and Fd. None of the above is correct.6. Refer to Figure 2-2. If this society moves from point D to point E, da. it gives up 25 bushels of corn to get 3 cars.b. it gives up 135 bushels of corn to get 3 cars.c. it gives up 3 cars to get 135 bushels of corn.d. it gives up 3 cars to get 25 bushels of corn.7. Refer to Figure 2-2. If this society is producing at point C, da. there is unemployment.b. production is efficient.c. growth can only be achieved through an advancement in technology.d. the opportunity cost of producing one more car is approximately 10 bushels of corn.8. Which of the following is a positive, as opposed to a normative, statement? ba. The US Department of Justice should allow a merger between AT&T and T-Mobilebecause it would have little effect on consumers.b. Antitrust laws should be used to prevent further concentration in the wireless telephoneservice market.c. The US Department of Justice sued AT&T to block its merger with T-Mobile.d. The wireless telephone service market is too highly concentrated.9. Which of the following famous people did not major in economics in college? ba. Donald Trumpb. Natalie Portmanc. John Elwayd. Mick Jagger10. Which of the following statements is correct about environmental economists? da. They view economics as a framework for natural resource allocation.b. They work at government agencies as well as universities and advocacy groups.c. They use economic arguments and systems to persuade companies to clean up pollutionand conserve natural resources.d. All of the above are correct.11. In the ordered pair (20, 100), 20 is the aa. x-coordinate.b. y-coordinate.c. scatterplot.d. slope.12. Between the two ordered pairs (20, 100) and (30, 80), the slope is ba. 1/2.b. -1/2.c. 2.d. -2.Figure 2-4snowblowers solds n o w s t o r ms 1020304050607080901234567891013. Refer to Figure 2-4. According to the graph, snowstorms aa. and snowblowers sold are positively correlated.b. and snowblowers sold are negatively correlatedc. and snowblowers sold are uncorrelated.d. are caused by more snowblowers being sold.14. Refer to Figure 2-4.Your friend John created the graph above to illustrate that snowstorms arecaused by more snowblowers being sold. You inform him that his interpretation is incorrect due to aa. omitted variable bias.b. reverse causality.c. slope mismatch.d. shifting versus moving along a curve.15. Refer to Figure 2-4.Which of the following could be an omitted variable in the graph? da. the price of snowblowersb. a change in consumers’ incomesc. a change in the seasonsd. All of the above are correct.PROBLEMFigure 2-1AB 211. Refer to Figure 2-1. What is the name of the model depicted in the figure?The Circular Flow2. Refer to Figure 2-1. What do the ovals represent in the figure?A: Markets for goods and service B: Markets for factors of production 3. Refer to Figure 2-1. What do the rectangles represent in the figure?1:Firms 2:Households4. Refer to Figure 2-1. What do the outer arrows represent in the figure?A to 1:revenue 1 toB :wages,rent, and profit B to 2 income 2 to A :spending 5.Refer to Figure 2-1. What do the inner arrows represent in the figure? A to 2:goods and services bought 2 to B:Labor,land,and capital B to1:Factors of production 1 to A: goods and services sold6. Refer to Figure 2-1. What does the arrow going from oval A to rectangle 2 represent in the figure? A to 2:goods and services bough7. Refer to Figure 2-1. What does the arrow going from oval B to rectangle 2 represent in the figure? B to 2 income 8.Refer to Figure 2-1. What are two elements not included in this figure that could be included in a more complex model? 9. The three main factors of production, or categories of inputs, used by firms to produce goods andservices areFigure 2-212345678910Consider the production possibilities curve for a country that can produce cars, corn (in bushels), or a combination of the two. 10.Refer to Figure 2-2. The bowed outward shape of the production possibilities curve indicates that opportunity cost of corn in terms of cars is 11.Refer to Figure 2-2. Which point(s) on the graph is(are) efficient production possibilities? 12.Refer to Figure 2-2. Which point(s) on the graph show unemployment of resources? 13. Refer to Figure 2-2. Which point(s) on the graph is(are) unattainable given current resources andtechnology?14.Who would be more likely to study the effects of government spending on the unemployment rate, a macroeconomist or a microeconomist? 15.Who would be more likely to study the effects of foreign competition on the accounting industry, a macroeconomist or a microeconomist? 16.Who would be more likely to study the effects of rent control on housing in New York City, a macroeconomist or a microeconomist? 17.Who would be more likely to study the inflation rate in the United States, a macroeconomist or a microeconomist? 18.Is the following a positive or normative statement? The federal minimum wage is lower than many state minimum wages. 19.Is the following a positive or normative statement? The Federal Reserve should set an inflation target and employ policies to meet the target. 20.Is the following a positive or normative statement? The United States government should mandate that every citizen purchases health insurance. 21. Is the following a positive or normative statement? The unemployment rate in Nevada is higher thanthe unemployment rate in New York.10203040506070801234567891022. Refer to Figure 2-3. What are the coordinates of point C?23. Refer to Figure 2-3. How are price and quantity related in this graph?24. Refer to Figure 2-3.What is the slope of the line?25. Refer to Figure 2-3.Is a move from point A to point B considered a shift of the curve or amovement along the curve?。


曼昆经济学原理英文书The Economics Principles by MankiwChapter 1: Ten Principles of EconomicsChapter 2: Thinking Like an EconomistChapter 3: Interdependence and the Gains from Trade Chapter 4: The Market Forces of Supply and Demand Chapter 5: Elasticity and Its ApplicationChapter 6: Supply, Demand, and Government Policies Chapter 7: Consumers, Producers, and Efficiency of Markets Chapter 8: Application: The Costs of TaxationChapter 9: Application: International TradeChapter 10: ExternalitiesChapter 11: Public Goods and Common Resources Chapter 12: The Design of the Tax SystemChapter 13: The Costs of ProductionChapter 14: Firms in Competitive MarketsChapter 15: MonopolyChapter 16: Monopolistic CompetitionChapter 17: OligopolyChapter 18: The Markets for Factors of Production Chapter 19: Earnings and DiscriminationChapter 20: Income Inequality and PovertyChapter 21: Introduction to MacroeconomicsChapter 22: Measuring a Nation's IncomeChapter 23: Measuring the Cost of LivingChapter 24: Production and GrowthChapter 25: Saving, Investment, and the Financial System Chapter 26: The Basic Tools of FinanceChapter 27: UnemploymentChapter 28: The Monetary SystemChapter 29: Money Growth and InflationChapter 30: Open-Economy Macroeconomics: Basic Concepts Chapter 31: A Macroeconomic Theory of the Open Economy Chapter 32: Aggregate Demand and Aggregate SupplyChapter 33: The Influence of Monetary and Fiscal Policy on Aggregate DemandChapter 34: The Short-Run Trade-Off between Inflation and UnemploymentChapter 35: The Theory of Consumer ChoiceChapter 36: Frontiers of MicroeconomicsChapter 37: Monopoly and Antitrust PolicyChapter 38: Oligopoly and Game TheoryChapter 39: Externalities, Public Goods, and Environmental Policy Chapter 40: Uncertainty and InformationChapter 41: Aggregate Demand and Aggregate Supply Analysis Chapter 42: Understanding Business CyclesChapter 43: Fiscal PolicyChapter 44: Money, Banking, and Central BankingChapter 45: Monetary PolicyChapter 46: Inflation, Disinflation, and DeflationChapter 47: Exchange Rates and the International Financial SystemChapter 48: The Short - Run Trade - Off between Inflation and Unemployment RevisitedChapter 49: Macroeconomic Policy: Challenges in the Twenty - First CenturyEpilogue: 14 Big IdeasNote: The chapter titles have been abbreviated for simplicity and brevity purposes.。
E conomics Principles ofN. Gregory MankiwThinking Likean EconomistSeventh EditionCHAPTER 2 W o j c i e c h (G e r s o n ((183111901)(W o j c i e c h (G e r s o n ((183111901)(In this chapter,look for the answers to these questions • What are economists’ two roles? How do they differ? • What are models? How do economists use them? • What are the elements of the Circular-Flow Diagram? What concepts does the diagram illustrate?• How is the Production Possibilities Frontier relatedto opportunity cost? What other concepts does it illustrate?• What is the difference between microeconomics andmacroeconomics? Between positive and normative?The Economist as Scientist! Economists play two roles:1. Scientists: try to explain the world2. Policy advisors: try to improve it! In the first, economists employ thescientific method,the dispassionate development and testing of theories about how the world works.3Assumptions & Models! Assumptions simplify the complex world,make it easier to understand.! Example: To study international trade,assume two countries and two goods.Unrealistic, but simple to learn andgives useful insights about the real world.! Model: a highly simplified representation ofa more complicated reality.Economists use models to study economic issues.4Our First Model:The Circular-Flow Diagram! The Circular-Flow Diagram: a visual model of the economy, shows how dollars flow through markets among households and firms! Two types of “actors”:! households! firms! Two markets:! the market for goods and services! the market for “factors of production”9Factors of Production! Factors of production: the resources the economy uses to produce goods & services, including! labor! land! capital (buildings and machines used inproduction)10Households:! Own the factors of production,sell/rent them to firms for income! Buy and consume goods & services FirmsHouseholds Firms:! Buy/hire factors of production,use them to produce goodsand services! Sell goods & services11Markets for Factors of Production HouseholdsFirms Markets for Goods & ServicesOur Second Model:The Production Possibilities Frontier ! The Production Possibilities Frontier (PPF): a graph that shows the combinations oftwo goods the economy can possibly produce given the available resources and the available technology! Example:! Two goods: computers and wheat! One resource: labor (measured in hours)! Economy has 50,000 labor hours per monthavailable for production.13A C T I V E L E A R N I N G1Points off the PPFA.On the graph, find the point that represents(100 computers, 3000 tons of wheat), label it F.Would it be possible for the economy to produce this combination of the two goods?Why or why not?B.Next, find the point that represents(300 computers, 3500 tons of wheat), label it G.Would it be possible for the economy to producethis combination of the two goods?The PPF: What We Know So Far Points on the PPF (like A – E)! possible! efficient: all resources are fully utilizedPoints under the PPF (like F)! possible! not efficient: some resources underutilized(e.g., workers unemployed, factories idle) Points above the PPF (like G)! not possible19The PPF and Opportunity Cost! Recall: The opportunity cost of an itemis what must be given up to obtain that item.! Moving along a PPF involves shifting resources (e.g., labor) from the production of one good to the other.! Society faces a tradeoff: Getting more of one good requires sacrificing some of the other.! The slope of the PPF tells you the opportunity cost of one good in terms of the other.20Economic growth shifts the PPF outward.The Shape of the PPF! The PPF could be a straight line or bow-shaped. ! Depends on what happens to opportunity costas economy shifts resources from one industryto the other.! If opp. cost remains constant,PPF is a straight line.(In the previous example, opp. cost of acomputer was always 10 tons of wheat.)! If opp. cost of a good rises as more of the goodis produced, PPF is bow-shaped….25At A, opp. cost of mtn bikes is low.B At B , opp. cost of mtn bikes is high.Why the PPF Might Be Bow-Shaped! So, PPF is bow-shaped when different workers have different skills, different opportunity costs of producing one good in terms of the other.! The PPF would also be bow-shaped when there is some other resource, or mix of resources with varying opportunity costs(E.g., different types of land suited fordifferent uses).29The PPF: A Summary! The PPF shows all combinations of two goods that an economy can possibly produce,given its resources and technology.! The PPF illustrates the concepts oftradeoff and opportunity cost,efficiency and inefficiency,unemployment, and economic growth.! A bow-shaped PPF illustrates the concept of increasing opportunity cost.31Microeconomics and Macroeconomics! Microeconomics is the study of how households and firms make decisions and how they interact in markets.! Macroeconomics is the study of economy-wide phenomena, including inflation, unemployment, and economic growth.! These two branches of economics are closely intertwined, yet distinct—they address different questions.32Summary• As scientists, economists try to explain the world using models with appropriate assumptions. • Two simple models are the Circular-Flow Diagram and the Production Possibilities Frontier.• Microeconomics studies the behavior of consumers and firms, and their interactions in markets. Macroeconomics studies the economy as a whole.• As policy advisers, economists offer advice onhow to improve the world.Graphing: a brief review! Graphs purposes:! Visually express ideas that might be less clear ifdescribed with equations or words! Powerful way of finding and interpreting patterns ! Graphs of a single variable! Pie chart! Bar graph! Time-series graph42Types of Graphs (a)Figure A-1The pie chart in panel (a) shows how the U.S. national income in 2011 was derivedfrom various sources.Figure A-1 Types of Graphs (b)The bar graph in panel (b) compares the 2011 average income in four countries.Types of Graphs (c)Figure A-1The time-series graph in panel (c) shows the productivity of labor in U.S.businesses from 1950 to 2010.Graphing: a brief review! Graphs of two variables: the coordinate system ! Display two variables on a single graph! Scatterplot! Ordered pairs of points! x-coordinate– Horizontal location! y-coordinate– Vertical location46Using the Coordinate SystemGrade point average is measured on the vertical axis and study time on thehorizontal axis. Albert E., Alfred E., and their classmates are represented by variouspoints. We can see from the graph that students who study more tend to get higher grades.Graphing: a brief review! Curves in the coordinate system! Data! Number of novels purchased! Price of novels! Income! Demand curve! Effect of a good s price! On the quantity of the good consumers want tobuy! For a given income48Table A-1Novels Purchased by EmmaThis table shows the number of novels Emma buys at various incomes and prices. For any given level of income, the data on price and quantity demanded can be graphed to produce Emmas demand curve for novels, as shown in Figures A-3 and A-4.Graphing: a brief review! Negatively related variables! The two variables move in opposite direction! Downward sloping curve! Positively related variables! The two variables move in the same direction! Upward sloping curve! Movement along a curve! Shifts in a curve50! Slope! Fairly flat upward-sloping line! Slope is a small positive number! Steep upward-sloping line! Slope is a large positive number! Downward sloping line! Slope is a negative number! Horizontal line! Slope is zero! Vertical line: infinite slope54。
2像经济学家一样思考作为科学家的经济学家试图解释世界科学方法:观察、理论和进一步观察假设与模型假设可以简化复杂的世界,使之更容易理解模型:一个复杂现象的高度简化研究步骤假设、建模、推导、结论经济学中最重要的假设理性人假设模型一:循环流向图一个说明货币如何通过市场在家庭和企业之间流动的直观经济模型生产要素经济体用来生产物品和劳务的各种资源家庭购买并消费物品和劳务拥有并出售生产要素企业生产并出售物品和劳务雇佣并使用生产要素模型二:生产可能性边界表示在可得到的生产要素与生产技术既定时,一个经济所能生产的两种产品数量的各种组合的图形生产可能性边界上的点能够达到有效率生产可能性边界内的点能够达到没有效率生产可能性边界外的点不可能达到可提高技术或加大资源投入生产可能性边界与机会成本机会成本是为了的得到某种东西所必须放弃的东西沿着生产可能性边界移动意味着将资源从一种物品的生产转移到另一种物品的生产中社会面临权衡取舍:得到更多的一种物品需要以更少的另一种物品为代价生产可能性边界的斜率表示我们以一种物品来衡量另一种物品的机会成本生产可能性边界可以是直线或曲线取决于经济将资源从一个行业转向另一个行业时机会成本的变化情况微观经济学研究家庭和企业如何做出决策,以及它们如何在市场上相互交易的学科宏观经济学研究整体经济现象,包括通货膨胀、失业和经济增长的学科作为政策顾问的经济学家尝试改善世界实证表述和规范表述作为科学家,经济学家试图做出关于世界是什么样子的实证表述作为政策顾问,经济学家试图做出关于世界应该是怎么样子的规范表述实证表述能被证实或证伪,但规范表述不能经济学家意见分歧的原因科学判断的不同价值观的不同也有大多数经济学家一致同意的主张。
Problems and Applications1. Many answers are possible.2. a. Steel is a fairly uniform commodity, though some firms produce steel ofinferior quality.b. Novels are each unique, so they are quite distinguishable.c. Wheat produced by one farmer is completely indistinguishable from wheatproduced by another.d. Fast food is more distinguishable than steel or wheat, but certainly not asmuch as novels.3. See Figure 2-5; the four transactions are shown.Figure 2-54. a. Figure 2-6 shows a production possibilities frontier between guns and butter.It is bowed out because when most of the economy‟s resources are being usedto produce butter, the frontier is steep and when most of the economy‟sresources are being used to produce guns, the frontier is very flat. When theeconomy is producing a lot of guns, workers and machines best suited tomaking butter are being used to make guns, so each unit of guns given upyields a large increase in the production of butter; thus the productionpossibilities frontier is flat. When the economy is producing a lot of butter,workers and machines best suited to making guns are being used to makebutter, so each unit of guns given up yields a small increase in the productionof butter; thus the production possibilities frontier is steep.b. Point A is impossible for the economy to achieve; it is outside the productionpossibilities frontier. Point B is feasible but inefficient because it‟s inside theproduction possibilities frontier.Figure 2-6c. The Hawks might choose a point like H, with many guns and not much butter.The Doves might choose a point like D, with a lot of butter and few guns.d. If both Hawks and Doves reduced their desired quantity of guns by the sameamount, the Hawks would get a bigger peace dividend because the productionpossibilities frontier is much steeper at point H than at point D. As a result,the reduction of a given number of guns, starting at point H, leads to a muchlarger increase in the quantity of butter produced than when starting at pointD.5. See Figure 2-7. The shape and position of the frontier depend on how costly it is tomaintain a clean environment the productivity of the environmental industry. Gains in environmental productivity, such as the development of a no-emission auto engine, lead to shifts of the production-possibilities frontier, like the shift from PPF1 to PPF2shown in the figure.Figure 2-76. a. A family‟s decision about how much income to save is microeconomics.b. The effect of government regulations on auto emissions is microeconomics.c. The impact of higher saving on economic growth is macroeconomics.d. A firm‟s decision about how many workers to hire is microeconomics.e. The relationship between the inflation rate and changes in the quantity ofmoney is macroeconomics.7. a. The statement that society faces a short-run tradeoff between inflation andunemployment is a positive statement. It deals with how the economy is, nothow it should be. Since economists have examined data and found thatthere‟s a short-run negative relationship between inflation and unemployment,the statement is a fact, thus it‟s a positive statement.b. The statement that a reduction in the rate of growth of money will reduce therate of inflation is a positive statement. Economists have found that moneygrowth and inflation are very closely related. The statement thus tells howthe world is, and so it is a positive statement.c. The statement that the Federal Reserve should reduce the rate of growth ofmoney is a normative statement. It states an opinion about something thatshould be done, not how the world is.d. The statement that society ought to require welfare recipients to look for jobsis a normative statement. It doesn‟t state a fact about how the world is.Instead, it is a statement of how the world should be and is thus a normativestatement.e. The statement that lower tax rates encourage more work and more saving is apositive statement. Economists have studied the relationship between taxrates and work, as well as the relationship between tax rates and saving.They‟ve found a negative relationship in both cases. So the statementreflects how the world is, and is thus a positive statement.8. Two of the statements in Table 2-2 are clearly normative. They are: “5. If thefederal budget is to be balanced, it should be done over the business cycle rather than yearly” and “9. The government should restructure the welfare system along the lines of a …negative income tax.‟” Bot h are suggestions of changes that should be made,rather than statements of fact, so they are clearly normative statements.The other statements in the table are positive. All the statements concern how theworld is, not how the world should be. Note tha t in all cases, even though they‟restatements of fact, fewer than 100 percent of economists agree with them. You could say that positive statements are statements of fact about how the world is, but noteveryone agrees about what the facts are.9. As th e president, you‟d be interested in both the positive and normative views ofeconomists, but you‟d probably be most interested in their positive views. Economists are on your staff to provide their expertise about how the economy works. Theyknow many fa cts about the economy and the interaction of different sectors. So you‟d be most likely to call on them about questions of fact positive analysis. Since you‟re the president, you‟re the one who has the make the normative statements as to what should be done, with an eye to the political consequences. The normative statements made by economists represent their views, not necessarily either your‟s or theelectorate‟s.10. There are many possible answers.11. As of this writing, the chairman of the Federal Reserve is Alan Greenspan, the chair ofthe Council of Economic Advisers is Martin N. Baily, and the secretary of the treasury is Larry Summers.12. There are many possible answers.13. As time goes on, you might expect economists to disagree less about public policybecause they‟ll have opportunities to observe different policies that are put into place. As new policies are tried, their results will become known, and they can be evaluated better. It‟s likely that the disagreement about them will be reduced after they‟ve been tried in practice. For example, many economists thought that wage and price controls would be a good idea for keeping inflation under control, while others thought it was a bad idea. But when the controls were tried in the early 1970s, the results were disastrous. The controls interfered with the invisible hand of the marketplace and shortages developed in many products. As a result, most economists are now convinced that wage and price controls are a bad idea for controlling inflation.But it‟s unlikely that the differences between economists will ever be completely eliminated. Economists differ on too many aspects of how the world works. Plus, even as some policies get tried out and are either accepted or rejected, creative economists keep coming up with new ideas.。
2 像经济学家一样思考每个研究领域都有自己的语言和思考方式:数学家谈论公理、积分和向量空间;心理学家谈论自我、本我和认知的不一致性;律师谈论案发现场、侵权行为和约定的禁止翻供。
经济学家也没有什么不同。
供给、需求、弹性、比较优势、消费者剩余和无谓损失等此类术语都是经济学家语言的一部分。
在以后各章节中,你将遇到许多新术语,还会碰上经济家以特定方式使用的一些熟悉的词汇。
乍一年,这种新语言似乎有一种不必要的神秘。
但是,正如你将了解到的,它的价值在于能够为你提供一种关于你所生活的世界的新的、有用的思维方式。
本书惟一一个最重要的目的就是帮助你学会经济学家的思维方式。
当然,正如你不可能在一夜之间成为一个数学家、心理学家或律师一样,学会像经济学家一样思考也需要一些时间。
但本书通过把理论、案例研究和新闻中的经济学事例结合起来,将给你提供充分发展和实践这种技能的机会。
在深入了解经济学的本质和细节之前,综述一下经济学家如何研究这个世界是有帮助的。
因此,本章将讨论这个领域的方法论。
经济学家处理所遇到的问题有何独特之处?像经济学家一样思考是什么意思?2.1作为科学家的经济学家经济学家努力以科学的客观性来探讨他们的主题。
他们研究经济的方法与物理学家研究物质和生物学家研究生命的方法一样:先提出理论、收集数据、分析数据,以努力证明或否定他们的理论。
对初学者来说,声称经济学是门科学似乎有点不可思议。
经济学家毕竟不用试管或望远镜进行研究工作。
但是,科学的本质是科学方法——冷静地建立并检验有关世界如何运行的各种理论。
这种研究方法适用于研究一国经济,就像适用于研究地心引力或生物进化一样。
正如阿尔伯特●爱因斯坦(Albert Einstein)曾经提出的:“所有科学不过是日常思考的提炼而已”。
虽然爱因斯坦的评论对诸如经济学的社会科学和诸如物理学的自然科学同样适用,但许多人并不习惯用科学家的眼光去观察社会。
接下来我们将讨论经济学家运用科学的逻辑来考察经济如何运行的一些方法。
Chapter 2 Thinking Like an EconomistMULTIPLE CHOICEFigure 2-1AB 211. Refer to Figure 2-1.Which shape refers to the markets for goods and services? aa. oval Ab. oval Bc. rectangle 1d. rectangle 22. Refer to Figure 2-1.What is flowing from rectangle 1 to oval A? ba. revenueb. goods and services soldc. factors of productiond. labor, land, and capital3. Refer to Figure 2-1.Which of the following is an activity undertaken by the actors in rectangle 2? ca. produce and sell goods and servicesb. hire and use factors of productionc. own and sell factors of productiond. exchange goods and services between firms and householdsFigure 2-212345678910Consider the production possibilities curve for a country that can produce cars, corn (in bushels), or a combination of the two. 4. Refer to Figure 2-2. If this economy devotes all of its available resources to producing corn, then itwill produce da. 0 bushels of corn and 10 cars.b. 135 bushels of corn and 3 carsc. 160 bushels of corn and 10 cars.d. 160 bushels of corn and 0 cars.5. Refer to Figure 2-2. Which combination of points show production possibilities only achievablewith improvements in technology or increases in resources? da. A, D, and Eb. B and Gc. C and Fd. None of the above is correct.6. Refer to Figure 2-2. If this society moves from point D to point E, da. it gives up 25 bushels of corn to get 3 cars.b. it gives up 135 bushels of corn to get 3 cars.c. it gives up 3 cars to get 135 bushels of corn.d. it gives up 3 cars to get 25 bushels of corn.7. Refer to Figure 2-2. If this society is producing at point C, da. there is unemployment.b. production is efficient.c. growth can only be achieved through an advancement in technology.d. the opportunity cost of producing one more car is approximately 10 bushels of corn.8. Which of the following is a positive, as opposed to a normative, statement? ba. The US Department of Justice should allow a merger between AT&T and T-Mobilebecause it would have little effect on consumers.b. Antitrust laws should be used to prevent further concentration in the wireless telephoneservice market.c. The US Department of Justice sued AT&T to block its merger with T-Mobile.d. The wireless telephone service market is too highly concentrated.9. Which of the following famous people did not major in economics in college? ba. Donald Trumpb. Natalie Portmanc. John Elwayd. Mick Jagger10. Which of the following statements is correct about environmental economists? da. They view economics as a framework for natural resource allocation.b. They work at government agencies as well as universities and advocacy groups.c. They use economic arguments and systems to persuade companies to clean up pollutionand conserve natural resources.d. All of the above are correct.11. In the ordered pair (20, 100), 20 is the aa. x-coordinate.b. y-coordinate.c. scatterplot.d. slope.12. Between the two ordered pairs (20, 100) and (30, 80), the slope is ba. 1/2.b. -1/2.c. 2.d. -2.Figure 2-4snowblowers solds n o w s t o r ms 1020304050607080901234567891013. Refer to Figure 2-4. According to the graph, snowstorms aa. and snowblowers sold are positively correlated.b. and snowblowers sold are negatively correlatedc. and snowblowers sold are uncorrelated.d. are caused by more snowblowers being sold.14. Refer to Figure 2-4.Your friend John created the graph above to illustrate that snowstorms arecaused by more snowblowers being sold. You inform him that his interpretation is incorrect due to aa. omitted variable bias.b. reverse causality.c. slope mismatch.d. shifting versus moving along a curve.15. Refer to Figure 2-4.Which of the following could be an omitted variable in the graph? da. the price of snowblowersb. a change in consumers’ incomesc. a change in the seasonsd. All of the above are correct.PROBLEMFigure 2-1AB 211. Refer to Figure 2-1. What is the name of the model depicted in the figure?The Circular Flow2. Refer to Figure 2-1. What do the ovals represent in the figure?A: Markets for goods and service B: Markets for factors of production 3. Refer to Figure 2-1. What do the rectangles represent in the figure?1:Firms 2:Households4. Refer to Figure 2-1. What do the outer arrows represent in the figure?A to 1:revenue 1 toB :wages,rent, and profit B to 2 income 2 to A :spending 5.Refer to Figure 2-1. What do the inner arrows represent in the figure? A to 2:goods and services bought 2 to B:Labor,land,and capital B to1:Factors of production 1 to A: goods and services sold6. Refer to Figure 2-1. What does the arrow going from oval A to rectangle 2 represent in the figure? A to 2:goods and services bough7. Refer to Figure 2-1. What does the arrow going from oval B to rectangle 2 represent in the figure? B to 2 income 8.Refer to Figure 2-1. What are two elements not included in this figure that could be included in a more complex model? 9. The three main factors of production, or categories of inputs, used by firms to produce goods andservices areFigure 2-212345678910Consider the production possibilities curve for a country that can produce cars, corn (in bushels), or a combination of the two. 10.Refer to Figure 2-2. The bowed outward shape of the production possibilities curve indicates that opportunity cost of corn in terms of cars is 11.Refer to Figure 2-2. Which point(s) on the graph is(are) efficient production possibilities? 12.Refer to Figure 2-2. Which point(s) on the graph show unemployment of resources? 13. Refer to Figure 2-2. Which point(s) on the graph is(are) unattainable given current resources andtechnology?14.Who would be more likely to study the effects of government spending on the unemployment rate, a macroeconomist or a microeconomist? 15.Who would be more likely to study the effects of foreign competition on the accounting industry, a macroeconomist or a microeconomist? 16.Who would be more likely to study the effects of rent control on housing in New York City, a macroeconomist or a microeconomist? 17.Who would be more likely to study the inflation rate in the United States, a macroeconomist or a microeconomist? 18.Is the following a positive or normative statement? The federal minimum wage is lower than many state minimum wages. 19.Is the following a positive or normative statement? The Federal Reserve should set an inflation target and employ policies to meet the target. 20.Is the following a positive or normative statement? The United States government should mandate that every citizen purchases health insurance. 21. Is the following a positive or normative statement? The unemployment rate in Nevada is higher thanthe unemployment rate in New York.10203040506070801234567891022. Refer to Figure 2-3. What are the coordinates of point C?23. Refer to Figure 2-3. How are price and quantity related in this graph?24. Refer to Figure 2-3.What is the slope of the line?25. Refer to Figure 2-3.Is a move from point A to point B considered a shift of the curve or amovement along the curve?。