全站仪建筑测量外文翻译文献
- 格式:doc
- 大小:51.00 KB
- 文档页数:13
Unit 18 Construction Layout (施工放样)Engineering surveys are conducted to obtain data essential for planning, estimating, locating, and layout for the various phases of construction activities or projects.(工程测量是在施工活动或工程的不同阶段中为计划编制、估计、定位、和放样获取必需的【essential必需的】数据的行为【conduct这里是动词:处理,翻译时用名词行为代替】)After the necessary topographic maps are prepared and positions of the structures are established as well as the final plans for the project are available, the engineers, architects or building contractors need to know information about overall site grade and elevations to determine placement of site structures, or estimate the volume of dirt to be moved, and then to set the required horizontal and vertical positions for the structures.(在必要的地形图准备好、建筑物位臵已确定之后,同样项目的最终方案也是可用的,工程师、建筑师【architect】或承建者【building contractor承建者、承包者;contract合同】需要知道全部场地的坡度和高程来确定建筑场地的布臵或者土方估算【volume体积;estimate 估计】,然后放臵建筑物的设计【required要求的,这里指设计位臵】水平和竖直位臵)Construction surveying is the translation of construction plans into physical points on the ground that can be used as a basis for the actual construction.(施工测量【Construction surveying施工测量,不要翻译成建筑测量】是施工图【construction plan施工图】到地面上实地点位的转换【translation】,可以被用来作为实际施工的基础【或译为原理】。
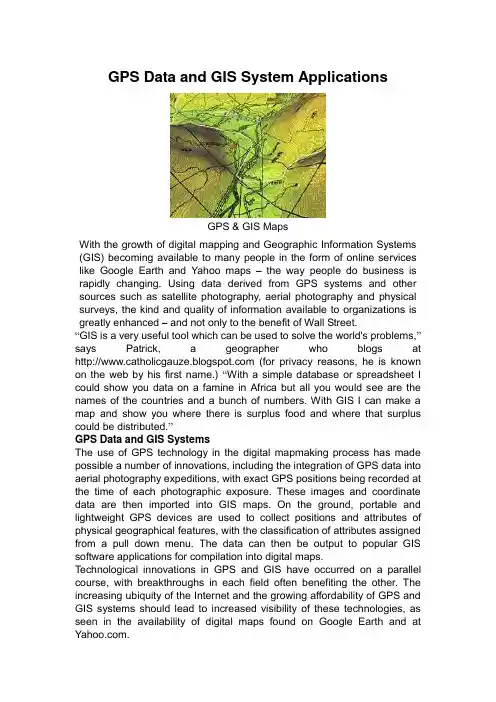
GPS Data and GIS System ApplicationsGPS & GIS MapsWith the growth of digital mapping and Geographic Information Systems (GIS) becoming available to many people in the form of online services like Google Earth and Yahoo maps –the way people do business is rapidly changing. Using data derived from GPS systems and other sources such as satellite photography, aerial photography and physical surveys, the kind and quality of information available to organizations is greatly enhanced – and not only to the benefit of Wall Street.“GIS is a very useful tool which can be used to solve the world's problems,”says Patrick, a geographer who blogs at (for privacy reasons, he is known on the web by his first name.) “With a simple database or spreadsheet I could show you data on a famine in Africa but all you would see are the names of the countries and a bunch of numbers. With GIS I can make a map and show you where there is surplus food and where that surplus could be distributed.”GPS Data and GIS SystemsThe use of GPS technology in the digital mapmaking process has made possible a number of innovations, including the integration of GPS data into aerial photography expeditions, with exact GPS positions being recorded at the time of each photographic exposure. These images and coordinate data are then imported into GIS maps. On the ground, portable and lightweight GPS devices are used to collect positions and attributes of physical geographical features, with the classification of attributes assigned from a pull down menu. The data can then be output to popular GIS software applications for compilation into digital maps.Technological innovations in GPS and GIS have occurred on a parallel course, with breakthroughs in each field often benefiting the other. The increasing ubiquity of the Internet and the growing affordability of GPS and GIS systems should lead to increased visibility of these technologies, as seen in the availability of digital maps found on Google Earth and at .A Catalyst For ChangeIndeed, if a recent media project at Google is any indication, GPS and GIS-enabled mapmaking may not only change the way we view the world, it may contribute to improving the lives of those in it. In collaboration with the U.S. Holocaust Memorial Museum, the folks at Google unveiled in April an unprecedented online mapping initiative to bring awareness of the Darfur crisis to the public, in the hopes of creating positive social change."At Google, we believe technology can be a catalyst for education and action,”said Eliot Schrage, Google Vice President of Global Communications and Public Affairs, in a recent press release. “…Crisis in Darfur‟will enable Google Earth users to visualize and learn about the destruction in Darfur as never before and join the Museum‟s efforts in responding to this continuing international catastrophe”(cited from /intl/en/press/pressrel/darfur_mapping.html.)As online users use virtual technology to fly over Africa, they‟ll see actual photographic images of the devastation that bears witness to the ongoing destruction of 1,600 villages by the Janjaweed militia and Sudanese forces – including 100,000 homes, as well as mosques, schools, and other critical structures, according to the release.The project uses data compiled from sources as diverse as the U.S. State Department and the United Nations, as well independent photographers and Holocaust Museum. The virtual experience can be viewed by downloading the free Google Earth software at . Additional information about the museum‟s Genocide Prevention Mapping Initiative can be accessed at the website of the Holocaust Museum at /googleearth .‘Neither Good Nor Evil’Geographer Patrick, who developed a master‟s thesis using freeware GIS software, and is currently a graduate teaching assistant in environmental geography, says he feels that due to the widespread availability of network-based programs, “GIS is about to go through such a radical evolution that it will surprise many….These new tools are also incredibly easy. I predict it will soon be possible to earn a degree in GIS from your average tech school.”Patrick runs a Windows®XP-based laptop with a variety of GIS applications, favoring open-source software and freeware for most of his work, and uses the popular ArcGIS application from ESRI for the most complex data and image crunching. He suggests that, like any tool, the benefit to society of using geographical information systems depends on the intentions of the user: “GIS is a great tool but that's all it is,” Patrick told me, “it is neither good nor evil. What matters is who is using it and the goals they wish to accomplish. As a culture we must continue to teach morals and ethics. This is the best and only reasonable way GIS can have a positive effect on the world.”As tools like Google Earth and similar GIS platforms bring the world closer together, every single one of us gains billions of neighbors every time we log onto the Internet. Hopefully this fact will make it harder to turn our back on the plight of developing communities in crisis, like Darfur.。
施工测量英文文献Construction Surveying is a critical component of civil engineering projects, ensuring the accuracy and precision of the construction process. It involves the application of various surveying techniques to determine the exact positions of points, lines, and contours on the Earth's surface. This process is essential for the proper planning, design, and execution of construction projects.The primary objective of construction surveying is to establish a reliable and accurate control network that serves as a reference for all subsequent construction activities. This includes the layout of roads, bridges, buildings, and other structures. Surveyors use a variety of instruments such as total stations, GPS receivers, and digital levels to collect the necessary data.One of the initial steps in construction surveying is the establishment of a horizontal and vertical control network. This involves setting up a series of benchmark points that are used to orient and align the construction elements. The control network serves as a reference for all subsequent measurements, ensuring that the construction is carried out according to the design specifications.Once the control network is established, the surveyors proceed to stake out the exact positions of the structures to be built. This involves the use of precise measurements tolocate the corners of buildings, the centerlines of roads, and the positions of other critical construction elements. The stakes are typically marked with flags, paint, or other visible indicators to guide the construction crews.As construction progresses, surveyors continue to monitor the work to ensure that it is being carried out correctly. This may involve checking the alignment of walls, the elevation of floors, and the position of other structural elements. Any discrepancies are identified and corrected to ensure that the final structure meets the design specifications.Modern construction surveying also incorporates the use of advanced technologies such as Building Information Modeling (BIM) and Geographic Information Systems (GIS). These tools allow surveyors to integrate their data with other aspects of the construction process, providing a more comprehensive and integrated approach to project management.In conclusion, construction surveying is a vital aspect of the construction industry, providing the necessary data and control for the accurate and efficient execution of construction projects. With the ongoing advancements in technology, the role of surveyors is becoming increasingly important in ensuring the success of these projects.。
施工测量外文文献施工测量在建筑工程中起着至关重要的作用。
以下为一些关于施工测量的外文文献,供参考。
1. 'Construction surveying and layout' by Wesley G. Crawford本书是关于施工测量和布局的综合指南。
它涵盖了地形测量、控制测量、水平和垂直布局、建筑物定位、水平曲线和垂直曲线等方面。
这本书是一个实用的指南,适用于建筑工程师、土木工程师、测量师和建筑师。
2. 'Building construction handbook' by Roy Chudley本书是一个广泛涵盖了建筑施工的指南,包括了施工测量方面的内容。
此书重点介绍了测量与布局、基础、结构、墙体、屋顶、门窗、地面、装修等方面的内容。
3. 'Surveying for construction' by William Irvine and Finlay Maclennan本书是一本介绍测量技术在建筑工程中的应用的指南。
它包括了控制测量、挖掘和地基测量、建筑物定位和布局、水平和垂直曲线、高程测量和建筑物检查等方面的内容。
本书着重讲解了测量技术的应用,尤其针对建筑工程的特点进行了详细分析。
4. 'Construction surveying and layout' by James Anderson and Edward Mikhail本书是建筑测量的指南,内容包括地形测量、控制测量、水平和垂直布局、建筑物定位、水平曲线和垂直曲线等方面。
此书着重介绍了测量技术在建筑工程中的应用,以及如何调整和纠正测量误差。
5. 'Surveying with construction applications' by Barry Kavanagh and Diane K. Slattery本书是一本介绍测量技术在建筑工程中的应用的指南。
可以加入工程测量实训报告的参考文献参考文献是工程测量实训报告的重要组成部分,它能够为实训报告提供可靠的理论依据和研究支撑。
下面是一些可以加入工程测量实训报告的参考文献:1. Smith, J. D., & Brown, A. B. (2010). Introduction to engineering surveying. CRC Press.2. Liu, W., & Zhang, X. (2016). Research on the application of total station in engineering surveying. Measurement & Control Technology, 35(3), 1-4.3. Wang, L., & Li, X. (2018). Research on the application of GPS in engineering surveying. Journal of Geomatics Science and Technology, 36(2), 10-14.4. Zhang, Y., & Wu, H. (2014). Research on the application of laser scanning technology in engineering surveying. Geospatial Information, 32(4), 20-24.5. Chen, H., & Zhou, L. (2019). Research on the application of unmanned aerial vehicle (UAV) in engineering surveying. Journal of Remote Sensing, 41(5), 12-17.6. Li, Y., & Zhao, Q. (2017). Research on the application of geographic information system (GIS) in engineering surveying. Geospatial Information, 35(6), 8-12.7. Wu, J., & Zhang, H. (2015). Research on the applicationof 3D laser scanning technology in engineering surveying. Journal of Geomatics Science and Technology, 34(1), 15-20. 8. Huang, X., & Chen, G. (2013). Research on the application of ground penetrating radar (GPR) in engineering surveying. Measurement & Control Technology, 32(2), 5-9.9. Yang, S., & Wang, C. (2012). Research on the application of photogrammetry in engineering surveying. Journal of Remote Sensing, 34(3), 25-29.10. Zhang, L., & Li, J. (2011). Research on the application of digital elevation model (DEM) in engineering surveying. Geospatial Information, 30(4), 16-20.这些参考文献涵盖了工程测量实训中常用的各种技术和方法,可以为实训报告提供全面的理论支撑和实证研究。
对测绘技术的理解英语作文Understanding of Surveying and Mapping Technology。
Surveying and mapping technology is a crucial tool in the field of geography and land management. It involves the measurement and mapping of the Earth's surface, as well as the collection of data to create accurate and detailed representations of the physical environment. This technology is used in a wide range of applications, including urban planning, construction, natural resource management, and environmental monitoring.One of the key aspects of surveying and mapping technology is the use of specialized equipment and techniques to accurately measure and record the physical features of the Earth's surface. This includes the use of GPS, total stations, and other advanced instruments to gather precise location data. In addition, surveying and mapping technology also involves the use of remote sensing technologies, such as aerial photography and satelliteimagery, to gather information about the Earth's surface from a distance.Another important aspect of surveying and mapping technology is the use of geographic information systems (GIS) to organize and analyze spatial data. GIS allows for the integration of different types of geographic data, such as maps, satellite imagery, and survey measurements, to create comprehensive and detailed representations of the Earth's surface. This technology is used to support decision-making in a wide range of fields, including urban planning, natural resource management, and environmental monitoring.In addition to its practical applications, surveying and mapping technology also plays a crucial role in scientific research and exploration. For example, this technology is used to map the Earth's surface in detail, to study the effects of natural disasters, and to monitor changes in the environment over time. This information is critical for understanding the Earth's physical processes and for making informed decisions about land use andresource management.Overall, surveying and mapping technology is a powerful tool for understanding and managing the Earth's physical environment. It provides accurate and detailed information about the Earth's surface, which is essential for a wide range of applications, including urban planning, construction, natural resource management, and environmental monitoring. This technology is also crucial for scientific research and exploration, providing valuable information about the Earth's physical processes and changes in the environment. As technology continues to advance, surveying and mapping technology will become even more important for understanding and managing the Earth's physical environment.。
全站仪测绘实习报告英文回答:During my internship as a surveyor, I had the opportunity to work with a total station. A total station is a highly advanced surveying instrument that combines the functions of an electronic theodolite, an electronic distance meter (EDM), and a data collector. It is commonly used in construction and engineering projects to measure angles, distances, and heights with high precision.One of the tasks I was assigned was to conduct a topographic survey of a construction site. Using the total station, I set up the instrument at several control points around the site. I then aimed the telescope at various targets and recorded the angles and distances. This data was then used to create a detailed map of the site, which included contour lines, spot elevations, and other important features.The total station also proved to be invaluable when it came to stakeout work. I was able to input the design coordinates into the instrument and then use it to guide the construction crew in placing various elements, such as buildings, roads, and utilities, in the correct locations. This ensured that the construction was carried out accurately and according to the design plans.In addition to its measurement capabilities, the total station also had a built-in data collector that allowed me to store and manage the survey data. This made it much easier to organize and process the large amount of data collected during the survey. I was able to export the data to a computer and use software to generate reports and drawings.中文回答:在我的实习期间,我有机会使用全站仪进行测绘工作。
全站仪极坐标法英文The polar coordinate method is a measurement technique commonly used in surveying, which involves the use of a total station to obtain angular and distance measurements in a 3D coordinate system. The total station, which consists of a theodolite and a distance meter, can measure horizontal and vertical angles to a high degree of accuracy, as well as calculate distances using either a reflector or a laser. To use the polar coordinate method, the user sets up the total station at a known point and aims it towards a target point. The instrument then calculates the angles and distances to the target point, and uses these measurements to determine the precise location of the target in the 3D coordinate system. This method is particularly useful for determining the location and elevation of objects such as buildings, roads, and bridges, as well as for mapping large-scale terrain features such as mountains and valleys. The polar coordinate method is widely used in many different fields, including civil engineering, architecture, and land surveying, and is known for its high accuracy and precision. In addition, because the total station is automated and requires minimal user input, it is a highly efficient method of surveying that can save time and resources on large-scale projects.Overall, the polar coordinate method is an essential tool for many professionals who require accurate and precise spatial data, and it continues to be an important part of modern surveying practice.全站仪极坐标法是一种常用的测量技术,它涉及到利用全站仪在三维坐标系中获取角度和距离测量。
GPS水准测量外文翻译文献(文档含中英文对照即英文原文和中文翻译)Analyzing the Deformations of a BridgeUsing GPS and Leveling DataAbstract. The aim of this study is analyzing 1D (in vertical) and 3D movements of a highway viaduct, which crosses over a lake, using GPS and leveling measurement data separately and their combination as well. The data are acquired from the measurement campaigns which include GPS sessions and precise leveling measurements, performed with six–month intervals for two years.In 1D analysis of the (vertical) deformations, the height differences derived from GPS and leveling data were evaluated. While combining theheight–difference sets (GPS derived and leveling derived) in the third stage of 1D analysis, Variance Component Estimation (VCE) techniques according to Helmert’s approach and Rao’s Minimum Norm Quadratic Unbiased Estimation (MINQUE) approach have been used.In 3D analysis of the deformations with only GPS data classical S–transformation method was employed.The theoretical aspects of each method that was used in the data analyses of this study are summarized. The analysis results of the deformation inspections of the highway viaduct are discussed and from the results, an optimal way of combining GPS data and leveling data to provide reliable inputs to deformation investigations is investigated in this study.Keywords . GPS, Leveling, Deformation Analysis, Variance Component Estimation, S–Transformation1 IntroductionIt has a considerable importance to have the movements of an engineering structure within certain limits for the safety of the community depending on it. To determine whether an engineering structure is safe to use or not, their movements are monitored and possible deformations are detected from the analysis of observations. An appropriate observation technique, which can be geodetic or non–geodetic (geotechnical–structural) according to classification in Chrzanowski and Chrzanowski (1995), is chosen with considering the physical conditions of the observed structure (its shape, size location and so on), environmental conditions (the geologic properties of the based ground, tectonic activities of the region, common atmospheric phenomena around the structure and so on), the type of monitoring (continuous or static) and the requiredmeasuring accuracy for being able to recognize the significant movements. Until the beginning of the 1980’s, conventional measurement techniques have been used for detecting the deformations in large engineering structures. After that the advances in space technologies and their geodetic applications provided impetus for their use in deformation measurements (Erol and Ayan (2003)). GPS positioning technique has the biggest benefit of high accuracy 3D positioning; however, the vertical position is the least accurately determined component due to inherent geometric weakness of the system and atmospheric errors (Featherstone et al. (1998)).Therefore, using GPS measurement technique in deformation measurements at millimeter level accuracy requires some special precautions, such as using forced centering equipment, applying special measuring techniques like the rapid static method for short baselines or designing special equipment for precise antenna height readings (see Erol and Ayan (2003) for their uses in practice). In some cases, even these special precautions remain insufficient and hence, the GPS measurements need to be combined with another measurement technique to improve its accuracy in height component.In geodetic evaluation of deformations, static observations obtained by terrestrial and/or GPS technique are subject to a two–epoch analysis. The two–epoch analysis basically consists of independent Least Squares Estimation (LSE) of the single epochs and geometrical detection of deformations between epochs. Detailed explanations of the methods based on this fundamental idea are found in Niemeier et al. (1982), Chen (1983), Gründig et al. (1985), Fraser and Gründig (1985), Chrzanowski and Chen (1986), Caspary (1987), Cooper (1987), Biacs (1989), Teskey and Biacs (1990), Chrzanowski et al. (1991).Here, the aim is analyzing 1D and 3D deformations of an engineering structure using GPS and leveling measurements data. During the 1D deformation analysis, three different approaches were performed separately. In the first and second approaches, height differences from precise leveling measurements and GPS measurements respectively were input in the analyzing algorithm. In the third approach the combination of height differences from both techniques were evaluated for vertical deformation. While combining the two measurement sets, Helmert Variance Component Estimation (HVCE) and Minimum Norm Quadratic Unbiased Estimation (MINQUE) techniques were used. 3D deformation analysis only with GPS measurements was accomplished using S-transformation technique. The theories behind the used deformation analysis and variance component estimation methods are summarized in the following. Thereafter the optimal solution for combining the GPS and precise leveling data to improve the GPS derived heights and hence to provide reliable inputs via the optimal solution for the deformation investigations are discussed.The highway viaduct of which deformations were inspected in this study is 2160 meter long and crosses over a lake on 110 piers. It is located in active tectonic region very close to the North Anatolian Fault (NAF). With the aim of monitoring its deformations, four measurement campaigns including GPS sessions and precise leveling measurements were carried out with six–month intervals. The session plans were prepared appropriately for each campaign on a pre–positioned deformation network.2 Deformation Analysis Using Height DifferencesIn general, the classical (geometrical) deformation analysis is evaluated in three steps in a geodetic network. In the first step, the observations, which wererecorded at epoch t1 and epoch t2, are adjustedseparately according to free network adjustment approach. During the computations, all point heights are assumed to be subject to change and the same point heights, which are approximate values, are used in adjustment computation of each epoch. Computations are repeated until all outliers are eliminated.In the second step, global test procedure is applied to ensure the stability assumptions of network points during the interval . In the global test, the combined free adjustment is applied to both epoch measurements ( and ). In this adjustment computation, the partial–trace minimum solution is applied on the stable points (see Erol and Ayan (2003)).; (1); (2); (3) where signify the degree of freedom after first, second and third adjustment computations respectively. Equation (1) and equation (2) represent free adjustment computations of the first and second epochs and equation (3) describes combined free adjustment. From the results found in equation (1), (2) and (3), the test value is determined as in the following.;; (4) This test value is independent from the datum and it is in F–distribution. test value is compared with the critical value which is selected from the Fisher–distribution table according to r (rank) and (degrees of freedom) for S=1-(0.95) confidence level. If , the null hypothesis which implies is true for the points of which heights were assumed not to be changed.On the other hand, if ,in the group of points which had been assumed as stable in the global test procedure, there is/are instable point(s). Then the necessity of localization of the deformations is understood and the combined free adjustment and global test are repeated until only the stable points are left out in the setIn the last step of the analysis, the following testing procedure is applied to the height changes. Similar to previous steps, test values are calculated for all network points except the stable ones and compared with the critical value of F from the Fisher–distribution table.;; (5) If , it is concluded that the change in height is significant. Otherwise, it is concluded that the height change d is not significant and it is caused by the random measurement errors.2.1 Variance Component EstimationIn the method of Least Squares (LS), weights of the observations are the essential prerequisite in order to correctly estimate the unknown parameters. The purpose of variance component estimation (VCE) is basically to find realistic and reliable variances of the measurements for constructing the appropriate a–priori covariance matrix of the observations. Improper stochastic modeling can lead to systematic deviations in the results and these results may appear to include significant deformations. Methods for estimating variance and covariance components, within the context of the LS adjustment, have been intensively investigated in the statistical and geodetic literature. The methods developed so far can be categorized as follows (see Crocetto et al (2000)):Functional modelsStochastic modelsEstimation approachesWhen the variance component estimation is concerned, a first solution to the problem was provided by Helmert in 1924, who proposed a method for unbiased variance estimates (Helmert (1924)). In 1970, an independent solution was derived by Rao, who was unaware of Helmert's method, and was called the minimum norm quadratic unbiased estimation (MINQUE) method (Rao (1970)). Under the assumption of normally distributed observations, both Helmert and Rao's MINQUE approaches are equivalent.2.1.1 Helmert Approach in VCEA full derivation of the Helmert technique and computational model of variance component estimation is given in Grafarend (1984). A summary of the mathematical model is given below (Kızılsu (1998)). The Helmert equation,(6) The matrix expression of equation (6) is given in (7)(7)where, u is the number of measurement groups.(8)(9)(10) where, tr(·) is the trace operator, N is the global normal equation matrix including all measurements, ni, Pi, Ni, vi are the number of measurements, assigned weight matrix, normal equation matrix and residuals of the group measurements respectively; and is estimated variance factor.It can be seen that ci is a function of Pi. On the other hand Pi is also a function of . Because of this hierarchy, Helmert solution is an iterative computation.The step by step computation algorithm of Helmert Variance Component Estimation is given as below:1. Before the adjustment, a unique weight is selected for each of the measurement groups. At the start of iterative procedure, the weights for each measurement groups can be chosen equal to one (P1 = P2=……= Pu= 1)2. By using the a–priori weights, separate normal equations (N1,N2 ,……,Nu ) for each measurement group and the general normal equation (N) are composed. Here, the general normal equation isthe summation of normal equations such as: N = N1 +N2 + ……+Nu .3. The adjustment process is started, in which the unknowns and residuals are calculated., (11) (12)4. Helmert equation is generated (equation (6)).5. Variance components in Helmert equation () and new weights are calculated.(13)6. If the variance component for all groups (i=1,2,……u)is equal to one, then the iteration is stopped. If not, the procedure is repeated from the second step using the new weights. The iterations are continued until the variancesreach one.2.1.2 MINQUE Approach in VCEThe general theory and algorithms of the minimum norm quadratic unbiased estimation procedure are described in Rao (1971); Rao and Kleffe (1988). This statistical estimation method has been implemented and proven useful in various applications not only for evaluating the variance– covariance matrix of the observations, but also for modelling the error structure of the observations (Fotopoulos (2003)).The theory of Minimum Norm Quadratic Estimation is widely regarded as one of the best estimators. Its application to a levelling network has been explained in Chen and Chrzanowski (1985), and it was used for GPS baseline data processing in Wang et al. (1998).MINQUE is classified as a quadratic–based approach where a quadratic estimator is sought that satisfies the minimum norm optimality criterion. Given the Gauss-Markov functional model v=Ax–b, where b and v are vectors of the observations and residuals, respectively, the selected stochastic model for the data, and the variance covariance matrix are expressed as follows.(14)(15) where, only variance components are to be estimated. Such a model is usedextensively for many applications, including (1984), Caspary (1987) and Fotopoulos and Sideris (2003).The MINQUE problem is reduced to the solution of the following system(16) S is a kxk symmetric matrix and each element in the matrix S is computedfrom the expression; i,j = 1,2,….k (17)where, tr(·) is the trace operator, Q(·) is a positive definite cofactor matrix for each group of observations. R is a symmetric matrix defined by(18)where, I is an identity matrix, A is an appropriate design matrix of full column –rank and Cb is the covariance matrix of the observations. The vector q contains the quadratic forms; (19)where, vi are the estimated observational residuals for each group of observations bi. As a result we can generate equation (16) as below.(20)The computed values resulting from a first run through the MINQUE algorithm is can be chosen equal to one as a –priori values for each variance factor. The resulting estimates can be used as ‘new’ a–priori values and the MINQUE procedure is repeated. Performing this process iteratively is referred to as iterative MINQUE (IMINQUE). The iteration is repeated until all variance factor estimates approach unity. The final estimated variance component values can be calculated by∏==na a i 022i)(σρ (21)3 Deformation Analysis Using GPS Results3.1 S–TransformationThe datum consistency between different epochs can be obtained by employing the S–Transformation and also the moving points are determined by applying this transformation (see Baarda (1973); Strang van Hees (1982)). S–transformation is an operation that is used for transition from one datum to another datum without using a new adjustment computation. In other words, S–transformation is a transformation computation of the unknown parameters, which were determined in one datum, from the current datum to the new datum with their cofactor matrix. S–transformation is similar to the free adjustment computations. The equations that give the transition from the datum i to datum k are given below (Demirel (1987), Welsch (1993)).(22)(23)(24) where, I is the identity matrix, Ek is the datum determining matrix whose diagonal elements are 1 for the datum determining points and 0 for the other points.(25)(26) where, xi0 , yi0 , zi0 are the shifted approximate coordinates of points to the mass center of control network and i=1,2,3 … p is the number of points.In the conventional 3D geodetic networks, the number of datum defects due to outer parameters is 7. However, in GPS networks the number of datum defects is 3 as the number of shifts on the three axis directions (Welsch (1993)). On the other hand, the number of datum defects is exactly known in the conventional networks as related to measurements that are performed on the network, where as this number can not be known exactly in the GPS networks because of error sources such as atmospheric effects, using different antenna types, using different satellite ephemerides in very long baseline measurements and directing the antennas to the local north (see Blewitt (1990)).3.2 Global Test Using S-TransformationA control network is composed of the datum points and deformation points. With the help of the datum points, the control network, which is measured in ti and tj epochs, is transformed to the same datum.While inspecting the significant movements of the points, continuous datum transformation is necessary. Because of this, first of all, the networks, which are going to be compared to each other, are adjusted in any datum such as using free adjustment technique.After applying this technique, the coordinates of the control network points, which were measured in ti epoch, are divided into two groups as f (datum) points and n (deformation) points.(27)(28)where, xi is the vector of parameters and is cofactor matrix in the datum i. The transformation is accomplished from datum i to datum k by the help of Ek , datum determining matrix. This transformation is as given in equations (29) and(30),(29)(30)The operations, which are given in equations (27)–(30), are repeated for the transformation from datum j to datum k. In this way, datum i and datum j can be transformed into the same datum k with the help of the datum points. As the result, the vectors of coordinate unknowns and and also their cofactor matrix and are found for the datum points in the same k datum. With the global (congruency) test, it is determined if there are any significant movements in the datum points or not. For the global test of the datum points, the H0 null hypothesis and T test value are (Pelzer (1971), Caspary (1987), Fraser and Gr undig (1985))(H0 null hypothesis) (31)(displacement vector) (32)(cofactor matrix of df) (33)(quadratic form) (34)(pooled variance factor) (35)(test value) (36) where, the degree of freedom of Rf is ,uf is the number of unknowns for the datum points, d is datum defect ,is pseudo inverse of ,such that,If (),it is decided that there is a significant deformation in the part of datum points of the control network.After the result of global test, if it is decided that there is deformation in one part of the datum points, the determination of the significant point movements using S–transformation (localization of the deformations) step isstarted (Chrzanowski and Chen (1986), Fraser and Gründig (1985)). In this step, it is assumed that each of the datum points might have undergone change in position. For each point, the group of these points is divided into two parts: the first part includes the datum points, which are assumed as stable and the second part includes one point, which is assumed as instable. All the computation steps that are explained above are repeated one by one for each datum points. In this way, all of the points are tested according to whether they are stable or not. In the end, the exact datum points are derived (Caspary (1987), Demirel (1987)).3.3 Determining the Deformation ValuesAfter determining the significant point movements as in section 3.2., the block of datum points, which do not have any deformations, is to be determined. With the help of these datum points, both epochs are shifted to the same datum and deformation values are computed as explained below (Cooper (1987)).The deformation vector for point P is:(37) the magnitude of the vector is:(38) To determine the significance of these deformation vectors, which are computed according to above equations, the H0 null hypothesis is carried out as given below.(39) and the test value:(40) This test value is compared with the critical value,. If , it is concluded that there is a significant 3D deformation in the point P.4 Numerical ExampleIn this study, the deformations of a highway viaduct–called as Karasu, were investigated using GPS and precise leveling data. It is 2160 m long and located in the west of Istanbul, Turkey in one part of the European Transit Motorway. The first 1000 meter of this viaduct crosses over the Buyukmece Lake, the piers of the structure were constructed in to this lake (see Figure 1).The viaduct consists of two separate tracks (northern and southern) and was constructed on 110 piers (each track has 55 piers). The distance between two piers is 40 meters and there is one deformation point in every 5 piers.The deformation measurements of the viaduct involved four measurement campaigns, which include GPS measurements and precise leveling measurements, performed with six–month intervals. Before performing the measurement campaigns, a well designed local geodetic network had been established in order to investigate the deformations of the structure (see Figure 1). It has 6 reference points around and 24 deformation points on the viaduct. The deformation points are established exactly at the top of piers, where are expected as the most stable locations on the body of viaduct. The network was measured using GPS in each of the sessions, which were planned carefully for each campaign, and precise leveling was applied in between network points.During GPS sessions, static measurement method was applied and dual frequency receivers were used with forced centering equipments. Leveling measurements were carried out using Koni 007 precise level with two invar rods. The relative accuracies of point positions are in millimeter level. The heights derived from precise leveling measurements have the accuracy between 0.2–0.8 millimeters.The results of evaluations for the three height difference sets using conventional deformation analysis are seen in the Figures 3, 4 and 5.In the third evaluation, height differences from both GPS and leveling techniques are used and deformation analysis is applied. Having different accuracies for both height sets derived from both techniques is a very important consideration at this point. Therefore, the stochastic information between these measurement groups (relative to each other) has to be derived. For computing the weights of measurement groups, MINQUE and Helmert Variance Component Estimation (HVCE) techniques have been employed. Figures 2a and 2b show the results of employing the VCE techniques.In order to both of VCE techniques, although that the similar results were reached after the same number of iteration, the MINQUE results were chosen and applied in combining the data sets, because MINQUE technique provided smoother trend in comparison to Helmert technique.It should be noted that the deformations in both tracks represented the same character in analyses results, therefore the only height differences belonging to northern–track points are given in the graphs here.The results of evaluations for three height difference sets usingconventional deformation analysis are confirmed each other. According to figures 3, 4 and 5, all reference and deformation points have similar characteristic of movements between consecutive epochs. Maximum movements were realized in point 2 and point 4 and these movements were interpreted as deformation.In figure 6, geoid undulation changes at some of the viaduct points are seen. However, when the figures 3 and 4 were investigated, it is understood that these changes were caused by errors stem from GPS observations and does not give any idea related to deformations of the points. Because, leveling derived height differences between consecutive epochs don’t show any height change for these points but GPS derived height differences do.As the result, it was seen that leveling measurements provide check for GPS derived heights and possible antenna height problems occurred during GPS sessions, and thus benefit to GPS measurements. This is considerable contribution of leveling measurements to GPS measurements in deformation monitoring and analyzing.After the 1D deformation analysis, 3D deformation analysis wasaccomplished as mentioned in previous sections. The horizontal displacements, which were found in the 3D analysis results, can be seen in figure 7.5 Results and ConclusionIt is well known from numerous scientific researches that the weakest component in GPS derived position is the height component, mainly because of the geometric structure of GPS. Therefore, in determining vertical deformations, GPS derived heights need to be supported by precise leveling measurements in order to improve their accuracies.Herein, the 1D and 3D deformations of a large engineering structure has been investigated and analyzed using GPS and leveling data separately and also, their combinations. On the other hand an optimal algorithm for combining GPS derived and leveling derived heights in order to improve GPS quality in deformation investigations were analyzed using the case study results.When the figures 3, 4 and 5 were investigated, surprisingly the maximum height changes were seen in point 2 and point 4 even though they are pillars andthey had been assumed to be stable at the beginning of the study. According to analysis results of the GPS observations, height changes for some deformation points on the viaduct were recognized. However, while the evaluations with the leveling and combined data were considered, it is understood that these changes, seemed to be deformations on the deformation points, are not significant and caused by the error sources in GPS measurements.In the second stage of the study, 1D analysis results have supplied input into the 3D analysis of the deformations, while determining whether the network points are stable or not. Horizontal displacements were detected in points 2 and 4 in the result of 3D analysis, (see figure 7) whereas points 1, 3 and 5 were stable. At a first glance, these displacements in 2 and 4 were unexpected. However after geological and geophysical investigations, the origin of these results was understood. The area is a marsh area and this characteristic might widen also underneath of these two reference points. The uppermost soil layer in the region does not seem to be stable and the foundations of the constructions of the reference points 2 and 4 are not founded as deep as the piers of the viaduct. So, they are affected by the environmental conditions easily. Also Points 1, 3 and 5 are not goes as deep as the piers, but their foundations are not similar with point 2 and 4 and are steel marks on the 3x3x3 meters concrete block. The variety of soil layer in the region, known according to geological investigations, also might have role in this result.On the other hand, it is possible to mention about the correlation between vertical movements in two reference points, 2 and 4, and wet/ dry seasons, because the uplift and sinking movements of these reference points seems to be very synchronous when compared to seasonal changes in the amount of water.The results of this study, experienced with measurements of the viaduct, are thought to be important remarks for deformation analysis studies using GPS measurements. As the first remark, GPS measurement technique can be used for determining deformations with some special precautions like using forced centering mechanisms to avoid centering errors, using special equipments for precision antenna height readings, using special antenna types to avoid multipath effects etc. However, even though these precautions are taken to provide better results in 1D and 3D deformation analysis, GPS measurements have to be supported with Precise Leveling measurements.译文:利用GPS和水准测量数据分析桥梁的变形土耳其伊斯坦布尔伊斯坦布尔技术大学土木工程学院大地测量与摄影测量系 S. Erol, B. Erol, T. Ayan摘要本次研究的主要目的是利用GPS测量数据和水准测量数据以及它们的组合形式分析跨越湖泊的高架桥在一维(垂直方向)和三维空间内的变形。
测绘工程矿山测量中英文资料对照外文翻译文献综述The measurement of the surveying and mapping in mineSince the seventy s, as the electronic technology and laser technology development, the type of surveying and mapping instruments with electronics (such as range finder, electronic tachometer, gyroscopes) to the traditional surveying and mapping instruments methods produced profound effect. In satellite remote sensing, global positioning system, as a representative of the space on earth observation technology in surveying and mapping application in the science of mature, computer technology, system scientifically based geographic information system and application for the emergence of surveying and mapping information source of access, analyze, management, processing and application fully provide strong technical support, automation and intelligence of surveying and mapping system is already in investigation, therefore we can say, the modern mapping technology is undergoing a profound revolution. Mining of measuring technology of an important application field, in the vast coal, metal mines, nonferrous mine production process played an important role. Mine survey of modern task is: in mine exploration, design, development and production of the different stages of the operation of the ground and underground mining area, the space, resources, (in mineral and land resources and environment are mainly) information acquisition, storage, processing, display and use for reasonable and effective development resources, protecting the resources, protecting the environment, management, industrial and environmental services for the continuous development of the station. In order to realize its modern task, mine measurement must be making full use of modern surveying and mapping instruments and techniques, put the advanced modern technology with mine surveying the actual work,specific characteristics, and the combination of broaden the living space mine survey and business scope, promote the reform and development of mine survey, adapt to the market economy system and mining system reform needs. Electronic tachometer, space information technology, the inertial measurement system and other modern surveying and mapping instruments have been in mine survey technology is used to further development and are constantly.This paper to modern surveying and mapping instruments of the development of the technology and its application in mine.1、Electronic tachometer and its application in mine survey:Electronic tachometer as the most widely used surveying and mapping instruments, is electronic technology and optical technology development of the combination of the photoelectric measuring instrument, is also set range finder, electronic advantages in a wide range of instruments, application prospects, the intelligent electronic tachometer is currently the biggest selling surveying and mapping instruments, is also the main future development direction. Intelligent electronic tachometer is with light, electricity and magnetism, machine of the latest scientific achievements, set the location, measuring Angle for the integration of advanced instrument. The international advanced electronic tachometer are on a memory card, internal memory or electronic hand book way, way of double record data transmission communication function, can receive external computer instruction by the computer input data, also can to outside the computer output data. The international advanced electronic tachometer have Japanese SOKKIA POWERSET series production of electronic tachometer and SET5F, SET6F, SET5W electronic tachometer, Swiss produces the TCA100 and TCA1800 electronic tachometer, Japan NIKON DTM-A series of electronic tachometer, etc. Our country has just south of the surveying and mapping instruments company production NTS-200 series electronic tachometer. Electronic tachometer has set up a file in the engineering survey, mine surveying, cadastral etc a wide range of applications, its development and application is in rapid developing. Electronic tachometer because and has the advantages of transit and range finder, and provide measurement results in digital form, its simple operation, stable performance, data can be through the electronic hand book and thecomputer to carry on the advantages of communication in the mine in the measurement of a wide range of applications. The ground control survey, topographic, engineering surveying all available is, contact measurement, the measurement work can also be used inunderground i To as a representative of the intelligent, digital instrument is minesurveying instrument one of the development direction in the future. Based on theelectronic tachometer and the modern computer technology can establish a mine 3 d data to be automatic collection, transmission,processing of mine surveying dataprocessing system, instead of traditional hand book records, manual entry, detailed calculation of repetitive work. In addition, electronic tachometer in mine surfacemovement monitoring, land reclamation project implementation, mine construction aspects also have been applied, each big ore measurement organizations are to instead of traditional instruments for routine measure the work, not only improves the efficiency, picked up speed, and reduced the development, and to ensure the accuracy2、Space information technology and its application in the measurement of the mine.The core of spatial information technology and the subject is the "3 S" technology (Remote Sensing:RS)、 (Global Positioning System GPS)、 (Grographic Information System:GIS) Remote sensing including satellite remote sensing and remote sensing, remote sensing data topographic map surveying as the important means in practice has a wide range of applications, satellite remote sensing for mapping is also mine of study and has made some significant results, based on remote sensing data to build digital terrain model (DTM) and then used in surveying and mapping work has won more applications. GPS as a cause of surveying and mapping in the traditional concept of major change technology, has become a main technology of land measurement method, also is the most potential mobile technology, in mine measurement, control survey, project survey, environment monitoring, disaster prevention and reduction of the navigation transport plays a significant role. Because not only have all-weather GPS, high precision and high flexibility, and the advantages of the traditional measuring technology without strict control, compared the level measurement, don't take points between depending on the point, withoutthe need to build standard, there is no error accumulation, the three dimensional positioning etc, and in the field measurement model, error sources and data processing to the traditional concept of surveying and mapping is a revolutionary change. The geographic information system as the geographical distribution of space of therelevant data collecting, processing, management, analysis of computer technology system, and its development and application of surveying and mapping the development of science is of great significance, is the modern mapping technology of important technical support. With "3 S" integration or integrated as the leading technology of space information system has gradually become the surveying and mapping learning or the earth informat ics new technology system and the work pattern, its advanced nature, timeliness obvious. With the space information technology for technical support, modern surveying and mapping instruments, technology is in rapid development in. The measurement of the remote sensing technology in the mines application has experienced a long time, and has accumulated rich experience.For remote sensing, it can be used as remote sensing data mining on the data topographic map surveying data source, like a piece of correction, through visual interpretation, field adjustable draw the work, complete the topographic map surveying and mapping. Compared with the traditional mapping method, using remote sensing data of mapping speed, low cost, high precision, it is a kind of application very extensive mapping method. Remote sensing in mine measurement of the applications of the key theory and technology also is in the investigation. Application of remote sensing data mining area, can obtain real-time, dynamic and comprehensive information source, to the mining area environment monitoring of the mining area environment protection to provide decision support. Remote sensing data mining area for prospecting, geological conditions, roof and floor of coal seam in such aspects as research has been applied, all these, explains the application of remote sensing technique in mining measurement is mine surveying realize its modern task important guarantee. GPS technology in the measurement of the mine is mainly applied to replace traditional ground surveying and mapping work. Using GPS technology such as mining surface movement monitoring, hydrology monitoring, miningarea control elevation hole net establishment or measure, reform, GPS receiver with performance to price has been rising, and its application in the measurement of minework the ground has become a part of the modern mine survey is an important support technology. Used in mining area the geographic information system is for mine geographical information system, or called mine material source environment alinformation system (MRIES). MREIS has become the important developing directionmine survey. With mining area environment resources information system as a platformto all kinds of measurement techniques for data acquisition approach, can build a collection of data acquisition, processing, management, analysis and output in oneof the automation, intelligent technology system, as the sustainable developmentof mining decision support system. Mine survey MREIS work is to establish the fistwork, and to create a MREIS mine surveying is an inevitable trend. Therefore, theGPS in the mining area is first applied used in a mine measurement information system established measurement, and then based on this establish the mining area environment information system resources. Space information technology is mine surveying realize its modern task of important technical support and guarantee, "3S" technology and other measuring instrument technology on the basis of the organic combination of the mining area environment information system is the spatial data information technology in mine survey of the applications of the comprehensiveresults.3 .the inertial measurement system and its application in the measurement ofthe mineThe inertial measurement system (Inertial ISS) is a kind of navigation and positioning technology, have all-w, autonomous, fast can flexible and advantages,the earth measurement, engineering surveying and mining measure the work of automation and versatility provided another kind of new technology. It is to usethe principle of inertial navigation, and earn geodetic data (longitude and latitude, elevation, azimuth, gravity anomaly and vertical deflection, etc.) of a kind of technology system.ISS can be divided into two categories: platform utility system and typesystem in the field of surveying and mapping, ISS main application target includes:(1) control measure, such as the existing control point review, encryption, and aerial control, etc.; (2) pipeline monitoring, orientation, crustal deformation, the surface subsidence observation; (3) underground positioning, all kinds of engineering and construction measure; (4) earthquake, gravity survey, geophysical research; (5) shaft and cans of vertical way beam of monitoring, etc. GPS/ISS combination system is to meet high precision navigation and positioning of the development direction of the request. This combination system can make the GPS and the performance of theISS, can get a lot of complementary to the whole land measurement model dataprocessing, and make sure that 3 d coordinate and the positioning and the precision of the navigation unstable, and increased significantly. The inertial measurement system in mine to the measurement of the Lord is applied in application in themeasurement of the application, the activities of the underground measurement, and of course the ground also has been applied in many fields, such as stated above. ISS in mines in China, the application in the measurement of work is to carry out in-depth,continue to develop. With GPS + ISS combination system used in mines measurement is a promising a technologyFour other new technology in the new instrument of surveying and mapping application to the measurement of the mineOther modern surveying and mapping instruments, such as laser point to meter, the gyro th, digital levels and related technology are all mine surveying and mapping measurement is used, and with the instrument technology as the foundation, formed many mining measurement instrument, as mine survey for the application of modern instruments and techniques.Mine survey as a cross subject, the development and the progress and the mining technology and the development of the mining project, measuring instruments and equipment of science and technology and the development of other subjects like mathematical science, computer science, etc, the development are closely related. Modern mapping technology is based on the electronic technology, space technology, optical technology, computer technology based on comprehensive technology, and has the intelligence, automation and so on a series of advantages. Modern science and technology, the rapid development of surveying and mapping can surely promote the further development of mine survey. With modern technology, mining engineeringsurveying and mapping technology and related science and technology as the foundation, the mine survey will form and collect data acquisition, processing, management, transmission, analysis, expression, application, output for the integration of intelligence, automation technology system for mine resources, environmental information system establishment provide fundamental material, promoting mine sustainable development.测绘在矿山测量中的发展七十年代以来,随着电子技术和激光技术的发展,光电结合型的测绘仪器(如测距仪、全站仪、陀螺仪)对传统的测绘仪器方法产生了深刻的影响。
Definitions of GIS“GIS” is an acronym meaning of Geographic Information System. In order to provide a good understanding of GIS, the following two definitions given by R hind (1989) and the UnitedStates Geological Survey (USGS, 1997) respectively are presented first.1 “a system of hard w are, software, a n d procedures designed to support the capture, management, manipulation , analysis, modeling, and display of spatially referenced data for solving complex planning an d management problems .”2 “a co mputer system capable of assembling , storing, manipulating, and displaying geographically referenced information , i.e., data identified according to their location .”GIS books generally adopt the ideas expressed by these two definitions. These two characteristics distinguish GIS from other types of information systems: The word “Geographic” in GIS explains “spatially” where things are such as the location of nations, states, counties, cities, schools, roads, rivers, lakes, and the list can go on and on. Spatially means where on the earth’s surface an object or feature is located. T his can be as simple as the latitude and longitude of a feature. T he geographic feature or object can be anything of interest.“ Information” in GIS is the “data” or “attribute” information about specific features that we are interested in. The name of the feature, what the feature is, the location of the feature, and any other information that is important. An example could be the name of a city , w here it is located , ho w big it is in square feet ( area) , its population , its population in the past, and any other information that is important . “System” in GIS is the computer software that is written to help people analyze the data, look at the data and combineit in various ways to show relationships or to create geographic models .A GIS can be made up of a variety of software and hardware tools, as long as they are integrated to provide a functional geographic data processing tool.As mentioned above, GIS is a computer system that links geographic information (where things are) with descriptive information (what things are) . Unlike a flat paper map, w here“What you see is w hat you get”, a GIS can present m any layers of different information. To use a paper map, all you do is unfold it. Spreadout before you is a representation of cities and roads, mountains and rivers, railroads, and political boundaries. T he cities are represented by little dots or circles, the roads by black lines, the mountain peaks by tiny triangles, and the lakes by s m all blue areas similar to the real lakes . A digital map is not muchmore difficult to use than a paper map. As on the paper map, there are dots or points that represent features on the map such as cities, lines that represent features such as roads, and small areas that represent features such as lakes . All this information—where the point is located , how long the road is, and even how many square miles a lake occupies—is stored as layers in digital for m at as a pattern of ones and zeros in a computer . Think of this geographic data as layers of information underneath the computer screen. Each layer represents a particular the m e or feature of the map. O ne the m e could be made up of all the roads in an area. Another me could represent all the lakes in the same area. Yet another could represent all the cities. These themes can be laid on top of one another, creating a stack of information about the same geographic area. E ach layer can be turned off and on, as if you were peeling a layer off the stack or placing it back on. You control the amount of information about an area that you want to see, at anytime, on any specific map. The technology components of a GIS can be explained interims of hard ware, software and human resources. GIS hard ware includes: computers, computer configuration/ net works, input devices, printers, and storage systems. Computers for GIS usage can be P Cs or supercomputers. These computers can be stand-alone units or can be hooked into a network environment. Input devices include digitizers and scanners. Printers and plotters are used to produce a hardcopy map. GIS storage systems include: optical disks, magnetic disks (such as a hard drive), floppy disks or magnetic tapes.GIS software includes both GIS program and special application packages, such as digital Terrain modeling and network analysis. The main difference between GIS software programs and desktop mapping programs is the ability of GIS programs to perform spatial analysis. ARC/ INFO by Environ mental Systems Research Institute (ESRI) Inc. is one of typical examples of GIS software packages. Desktop mapping programs offer m any of the same features, as a GIS, but their ability to support spatial analyses are limited. They are developed to satisfy individual user needs for mapping presentations. MapInfo developed by MapInfo Corp is an example of popular desktop mapping programs. Human resources used to operate a GIS typically include: operational staff, technicalprofessional staff, and management personnel Operational staffers people such as (1) cartographers, who monitor the design of map displays, thestandards for map symbols and standard map series, (2) data capturers, who converts map into digital form and (3) potential usersof a GIS . Technical professional staff include (1) information analysts w ho solve particular user problems and satisfy their information needs, (2) system administrators, who are responsible for keeping the system (hardware/ software) operational , (3) programmers, who translate the application specifications prepared by the analyst into programs and (4) the database administrator, w ho assists the analysts, programmers and users to organize geographic features into layers, identify sources of data , develop coding structures for no graphics data, and document information about the contents of the databases . Management personnel include (1 ) the manager, who monitors the daily performance of the GIS project Implementation team and manages the output production as required by the organization and (2) the Quality Assurance Coordinator w ho manages the output of the final product to ensure that it meets the conversion specification and data acceptance plan. H o w a GIS Works:A GIS works by providing a way to capture or input data , store , retrieve and manage the data , manipulate and analyze the data , and finally a w ay of displaying that data as a map or as a document or both . Let’s take a closer look as each of these aspects of GIS.Data Input: All GIS data ha s to be in a digital form at so whether it’s a report, a photo, a map, or information gathered in the field , it has to be made digital . Obtaining geographic data to insert into a GIS is a large subject in which includes a number of different approaches. One of the most common ways to collect spatial geographic data is to perform a physical survey. This includes surveying the land, underwater areas, and underground features of the earth (which are referred to as field survey, hydrographic survey and mining survey respectively) .Basic forms of data input include: (1) Typing: Reports, survey documents,population statistics, etc., all have to be entered into the computer preferably in a data base for m at or as tabular data . (2) Scanning: Paper maps such as topographic maps, aerial photographs, remotely sensed images if not already in a digital for m at need to be scanned and then georeferenced or georectified. When a picture or a map or an aerial photo is georeferenced it will open in a GIS program in the right place on a map in relation to other map objects being viewed. They will be in the proper place spatially. (3) Digitizing: currently digitizing is the most common method for converting existing maps and images into digital form. Digitizingis basically tracing points, lines, or areas fro m a paper map , or aerial photo so that instead of a photograph or a raster image , there is no w a digital line graphic or vector file .(4) GPS data capture: Data can also be placed in a GIS as points, lines, and polygons from a GPS unit if it has the capability of recording such information. (5) Aerial photography/remote sensing: T his is an increasingly popular way to gather spatial data. Aerial photographs are taken fro m an aircraft, after which they are measured and interpreted. Similarly, satellite re mote sensing can be interpreted for physical features and attributes. (6)Censuses: Censuses conducted by the U.S. Census Bureau gather a variety of demographic data such as population , age structure , sex ratio, race co m position , employment rates . (7) Statistics: Statistics are a set of mathematical methods used to collect and analyze data .These methods include the collection and study of data at different time intervals and at a fixed location, providing information for yearbooks, weather station reports, etc. This information often has a spatial component and can thus be incorporated into a GIS. (8) Tracking: Tracking is a process of collecting attribute data on changes that occur at a location over a period of time. Examples of tracking include: monitoring the change of an ecosystem, and real-time monitoring of a moving objects such as vehicles.Data Storage, Retrieval, and Management: Different types of information required for a GIS require storage which allows the information to be updated and queried for analysis by the user. There are two types of information to be stored; spatial data and attribute data, which is the topic of next text. Data Manipulation and Analysis: A good system and/ or software package allows the user to define and execute spatial and attribute procedures. T his is commonly thought of as the heart of the GIS. Overlaying, buffering, modeling, and analysis are so m e of the methods used in building a coverage or project. It also takes the users knowledge to recognize what is seen in the resulting map and data. The power of GIS is in the analysis of data.Data Output: Usually this is a map or graphic, which the user has generated after analyzing the data. School districts can use GIS to help the m in decisions like school boundaries and then create a map to distribute to the community. Tabular data and reports can be generated as w ell to help explain the details seen in the map or graphic and ho w the conclusions w ere derived.地理信息系统基础GIS定义GIS是一个只取首字母的地理信息系统意义的缩写词。
介绍测绘工程的英语作文Surveying Engineering: The Art of Mapping Our WorldSurveying engineering is a specialized field that involves the measurement and mapping of the Earth's surface. It plays a crucial role in a wide range of applications, from construction and urban planning to environmental science and legal disputes over land boundaries. This essay will delve into the fundamentals of surveying engineering, its importance, and its impact on modern society.Firstly, surveying engineering requires a deep understanding of geometry and trigonometry, as well as the ability to use sophisticated instruments such as theodolites, total stations, and GPS devices. Surveyors must be highly skilled in data collection and analysis, ensuring that the measurements taken are accurate to the highest degree possible. This precision is essential for creating reliable maps and plans that serve as the foundation forinfrastructure projects.The importance of surveying engineering cannot be overstated. It is the backbone of many construction projects, ensuring that buildings, roads, and bridges are built in the correct location and with the correct dimensions. Surveyors also play a key role in land management, helping to establish property boundaries and resolve disputes over land ownership.In addition to its practical applications, surveying engineering contributes to scientific research and environmental conservation. By mapping the Earth's surface, surveyors can monitor changes in the landscape over time, providing valuable data for scientists studying everything from climate change to geological phenomena.The advent of technology has revolutionized the field of surveying engineering. Modern surveyors now have access to advanced software that can process and analyze data more efficiently than ever before. Drones and satellite imageryare also being used to collect survey data, offering new perspectives and increasing the accuracy of measurements.In conclusion, surveying engineering is a vitalprofession that underpins many aspects of our society. It requires a unique blend of technical expertise, attention to detail, and an understanding of the broader implications of one's work. As our world continues to evolve, the role of surveyors will remain indispensable, shaping the way we build, manage, and understand our environment.。
Robotic Total Station (智能型全站仪)For many years, the optical transit was the surveyor’s tool of choice to measure angles.By the 1970s, however, the electronic theodolite began to replace the transit since it could measure angles more accurately on both the horizontal and vertical axes. In the early 1980s, “total stations,”which measure distances very accurately by using electronic distance meters (EDMs), became the instrument of choice. Then in late 1990, Geodimeter, Dandryd Sweden introduced the first “robotic total station” adding automatic tracking and radio communication to a radio and data collector at the “target” or pole. Thus, for the first time, no person was required at the instrument——only at the target, reducing the size of a survey crew.Total Station (全站仪)A total station is the most commonly used instruments now in geomatics engineering, which is fully integrated instrument that capture all the spatial data necessary for a 3-dimensional positional information.A total station integrates the functions of an electronic theodolite for measuring angles, an EDM for measuring distances, digital data and a data recorder.All total stations have similar constructional features regardless of their age or level of technology, and all perform basically the same functions.After the instrument has been set up on a control station, centered, leveled and properly oriented, and the prism target has been set up over another point whose position is to be measured, the surveyor may focus the target and depress a button. Then output from the horizontal and vertical circular encoders and from the EDM can be displayed at the instrument and stored in a data collector and enters into a built-in microprocessor. The microprocessor can convert the measured slope distance to the horizontal distance using the measured vertical or zenith angle.The microprocessor also computes the difference in elevation between the instrument center and the prism target. If the elevation of the instrument center (the HI) and the height of the reflector target (the HT) above the ground are entered, the microprocessor computes the elevation of the target station taking into account the effect of curvature and refraction.Furthermore the microprocessor can also compute the resolution of the horizontal distance together with the current horizontal direction, expressed as an azimuth, into a coordinate of the target station.In construction layout measurement, the data necessary to establish the direction and distance from a control point to locate a construction point can be entered into the instrument via the keyboard or directly from an office computer.Then the surveyor guides the person holding the prism along the line of computed direction until the distance to the point to be located agrees with the computed distance.All displayed outputs can also be recorded or stored in electronic field book for further calculations in a computer.Total stations allow the measurement of many points on a surface being observedwithin a very short time range.Robotic Total Station (智能型全站仪)A late 1980s adaption of the total station is the addition of servo motors to drive both the horizontal and the vertical motions of these instruments.For all the complex electronics inside a robotic total station, the motion is still provided by simple servo motors with a reduction gear system. The end result must be lightweight, durable and fast and have sub-second positioning accuracy.When those total stations have been designed with automatic target recognition (ATR) function, they allow the user to automatically track, measure and record targets. Current technology provides robotic (motorized) total stations that are able to measure angles with an accuracy of ±0.5″and distances with an accuracy of ±1mm+1ppm to a range of 3500m.Latest models are capable of searching automatically for targets and then locking onto them precisely, turning angles automatically to designated points using the uploaded coordinates of those points, repeating angles by automatically double-centering, and even equipped with automatic data transfer systems.These instruments, when combined with a remote controller held by the prism surveyor, enable the survey to proceed with a reduced need for personnel. All these characteristics make the robotic total stations very useful for geomatics engineering tasks. Using a robotic total station with A TR, first, the telescope must be pointed roughly at the target prism—either manually or under software control—and then the instrument does the rest.The A TR module is a digital camera that notes the offset of the reflected laser beam, permitting the instrument then to move automatically until the cross hairs have electronically set on the point precisely.After the point has been precisely “sighted”, the instrument can then read and record the angle and distance. Reports indicate that the time required this process is only one-third to one-half of the time required to obtain the same results by conventional total station techniques.With the proper ATR-based instrument Leica TCA2003, the surveyor will be able to handle new applications and address existing jobs with a different spin. Because of the co-axial target detection system and the use of conventional EDM prisms, daily operation will remain unchanged. What will change is the speed with which data is collected.Topographical surveys are automated by putting the TCA in Auto-record mode—the instrument follows the rod person and automatically records a point at specified distances, time intervals, or whenever the rod is held steady for more than a certain time. Take advantage of the measuring speed and have multiple rod people on larger jobs. The TCA2003 can even turn sets of angles while the user prepares for the next traverse point. Take automation a step further and do some “no-man”surveying. Robotic total stations are already being used in hazardous areas to provide continuous monitoring of structures or processes.Certain sites link measurement systems with civil defense agencies and lawenforcement groups.An offspring of “no-man”surveying is machine guidance. TCAs guide road headers, tunneling moles and paving machinery.A surveyor is in charge of installing the robotic survey station at predetermined locations and lets the robotic unit inform machine operators where they are relative to design information. The machine operator reads the machine position from a small display receiving position updates from a base station.The base station can be robotic, GPS or a combination of a number of sensors.智能型全站仪多年以来,光学经纬仪一直是测量人员测角的工具选择。
Table of ContentsUuit 1 What is Geomatics? (什么是测绘学) 2Unit 2 Geodetic Surveying and Plane Surveying(大地测量与平面测量) 6Unit 3 Distance Measurement(距离测量) 10Unit 4 Angle and Direction Measurement(角度和方向测量) 14Unit 5 Traversing (导线测量) 18Unit 6 Methods of Elevation Determination(高程测量方法) 22Unit 7 Robotic Total Station (智能型全站仪) 26Unit 8 Errors in Measurement(测量工作中的误差) 30Unit 9 Basic Statistical Analysis of Random Errors 34Unit 10 Accuracy and Precision (准确度和精度) 37Unit 11 Least-Squares Adjustment 40Unit 12 Geodesy Concepts 42Unit 13 Geoid and Reference Ellipsoid 44Unit 14 Datums, Coordinates and Conversions 46Unit 15 Map Projection 48Unit 16 Gravity Measurment 51Unit 17 Optimal Design of Geomatics Network 53Unit 18 Construction Layout (施工放样) 56Unit 19 Deformation Monitoring of Engineering Struvture 59Unit 20 Understan ding the GPS(认识 GPS) 62Uuit 21 Understanding the GPS (II) 认识 GPS(II) 65Unit 22 Competition in Space Orbit(太空轨道上的竞争) 68Unit 23 GIS Basics(GIS 的基础) 73Unit 24 Data Types and Models in GIS GIS中的数据类型和模型 79 Unit 25 Digital Terrain Modeling(数字地面模型) 83Unit 26 Applications of GIS 88Unit 27 Developments of photogrammetry 92Unit 28 Fundamentals of Remote Sensing (遥感的基础) 95Unit 29 Digital Image Processing and Its Applications in RS 99Unit 30 Airborne Laser Mapping Technology(机载激光测图技术) 104Unit 31 Interferometric SAR(InSAR) 108Unit 32 Brief Introduction toApplied Geophysics 110Unit 33 Origon of Induced Polarization 112Unit 34 International Geoscience Organization 115Unit 35 Prestigious Journals in Geomatics 118Unit 36 Relevant Surveying Instrument Companies 123Unit 37 Expression of Simple Equations and ScientificFormulsa 124Unit 38 Professional English Paper Writing 128Unit 39 Translation Techniques for EST 136Uuit 1 What is Geomatics? (什么是测绘学)Geomatics Defined(测绘学定义)Where does the word Geomatics come from?(Geomatics-测绘或地球空间信息学,这个名词是怎么来的呢?) GEODESY+GEOINFORMATICS=GEOMATICS or GEO- for earth and – MATICS for mathematical or GEO- for Geoscience and -MATICS for informatics. (大地测量学+地理信息学=GEOMATICS 测绘学或者geo 代表地球,matics 代表数学,或者 geo 代表地球科学,matics 代表信息学) It has been said that geomatics is many things to many people.(据说测绘学这个词对不同的人有不同的理解) The term geomatics emerged first in Canada and as an academic discipline; it has been introduced worldwide in a number of institutes of higher education during the past few years, mostly by renaming what was previously called “geodesy” or“surveying”, and by adding a number of computer scienceand/or GIS-oriented courses.(这个术语【term 术语】作为一个学科【academicdiscipline 学科】第一次形成【emerge】于加拿大;在过去的几年里被全世界的许多高等教育研究机构所熟知,通常是以前的“大地测量学” 或“测量学”在引入了许多计算机科学和 GIS 方向【或“基于GIS”】的课程后重新命名的。
工程测量师英文作文English:As a civil engineer, the role of a construction surveyor is essential in ensuring that construction projects are carried out accurately and according to design specifications. A construction surveyor is responsible for collecting data, analyzing it, and using it to guide the construction process. They are skilled in using various surveying equipment, such as total stations and GPS devices, to measure distances, angles, and elevations on construction sites. These measurements are crucial in determining the exact location of structures, ensuring that they are built in the right place and to the correct dimensions. Construction surveyors also play a key role in setting out reference points and benchmarks for construction workers to follow, helping to ensure that buildings and infrastructure are constructed with precision.Translated content:作为土木工程师,建筑测量师在确保建筑项目准确按设计规范进行方面起着至关重要的作用。
全站仪水平角观测的流程(中英文实用版)英文文档:The Process of Level Angle Observation with Total StationLevel angle observation is a crucial aspect of surveying and construction work.It involves the use of a total station, which is an electronic device used for measuring angles and distances.The process of level angle observation with a total station typically involves the following steps:1.Set up the total station: Begin by setting up the total station at a fixed point, ensuring that it is stable and level.This can be done using a tripod or other suitable support.2.瞄准目标点:Once the total station is set up, aim it at the target point.This can be done by using the internal GPS or by manually entering the coordinates of the target point into the total station.3.水平角观测:With the total station aimed at the target point, measure the horizontal angle.This is done by rotating the telescope until the desired point is in the crosshairs and then recording the angle reading on the total station display.4.记录数据:Record the measured horizontal angle, as well as any other relevant data such as the distance to the target point.This information will be used for further calculations and analysis.5.重复观测:To ensure accuracy, repeat the level angle observation process at multiple points around the target.This will help to create a accurate picture of the topography and layout of the area.6.数据处理:Once all the necessary observations have been made, the data can be processed using surveying software.This will help to create a accurate map or plan of the area, taking into account the level angles and distances measured.In conclusion, the process of level angle observation with a total station involves setting up the device, aiming it at the target point, measuring the horizontal angle, recording data, and repeating the process at multiple points.The data collected can then be used to create a accurate map or plan of the area.中文文档:全站仪水平角观测流程水平角观测是测量和建筑工作中的关键环节。
全站仪的测量方法实习报告英文回答:Surveying with a total station is a widely used methodin the field of land surveying. It combines the functionsof a theodolite and an electronic distance meter, allowing for accurate and efficient measurements. The total stationis equipped with a telescope, which can be rotated horizontally and vertically, and a distance meter, which measures the distance between the instrument and the target. These measurements are then processed by the internal software to calculate the coordinates and distances of the surveyed points.To begin a survey, the total station needs to be set up on a stable tripod. The instrument should be leveled using the built-in leveling bubble or electronic level. Once the total station is properly set up, the surveyor can start measuring points by aiming the telescope at the target and pressing a button to record the measurements. Theinstrument will automatically calculate the horizontal and vertical angles, as well as the slope distance, to the target point.One important aspect of using a total station is the establishment of control points. Control points are reference points with known coordinates that are used totie the survey to a specific coordinate system. These points are usually established using more accurate surveying techniques, such as GPS or differential leveling. By measuring the coordinates of control points with the total station, the surveyor can ensure the accuracy of the survey and easily integrate it with other surveys or mapping data.Another important consideration when using a total station is the selection of surveying methods. There are several methods that can be used depending on the specific survey requirements. For example, if the survey area is relatively small and the terrain is flat, a simple traverse method can be used, where the surveyor measures a series of points along a closed loop. On the other hand, if thesurvey area is large or has complex terrain, a network method may be more appropriate, where multiple control points are established and measurements are taken between them to create a network of surveyed points.In addition to these basic methods, the total station can also be used for more advanced surveying techniques, such as stakeout, resection, and remote elevation. Stakeout involves using the total station to guide the placement of objects or structures on the ground, based on their coordinates. Resection is a technique used to determine the position of the total station by measuring angles and distances to known points. Remote elevation allows the surveyor to measure the elevation of a point without physically reaching it, by measuring the vertical angle and slope distance to the point.总结:全站仪是一种广泛应用于土地测量领域的测量方法。
全站仪建筑测量外文翻译文献(文档含中英文对照即英文原文和中文翻译)译文:全站仪在房屋建筑测量中的应用分析摘要介绍全站仪在房屋建筑测量中的应用,提出全站仪使用中应注意的事项。
关键词:全站仪,房屋建筑,施工测量,应用随着科学技术的进步与发展,人类劳动不仅在深度和广度上快速拓展,且更加简洁高效。
光电测距仪的出现使测量范围和测量速度大大提高,电子经纬仪的出现则不仅使测角精度有所提高,其可视化更是给测量工作带来了极大的便利,电子全站仪就是集测距、测角、测高程及数据自动化处理于一体的智能化仪器,在高层、大型房屋建筑工程的施工测量工作中得到广泛的应用。
一、全站仪简介全站仪,即全站型电子速测仪。
是一种集光、机、电为一体的高技术测量仪器,是集水平角、垂直角、距离(斜距、平距)、高差测量功能于一体的测绘仪器系统。
全站仪具有测量精度高,仪器的集成化、自动化和智能化程度高等优点,已大量应用于各类工程的施工测量中。
全站仪是由电子测角、电子测距、电子计算和数据存储单元等组成的三维坐标测量系统,测量结果能自动显示,并能与外转设备交换住处的多功能测量仪器。
由于全站仪电子速测仪较完善地实现了测量和处理过程的电子化和一体化,所以人们也通常称之为全站仪电子速测仪或简称全站仪。
二、全站仪的特点1、全站仪自身带有数据处理系统,只要一次照准反射棱镜;即可快速地测出水平角、垂直角和斜距,自动计算出放样点的坐标和高程,并可记录测量与计算数据。
2、通过全站仪主机的标准通讯接口,可实现全站仪与计算机或其他外围设备的数据通讯,从而使测量数据的获取、管理、计算和绘图形成一个完善的自动化测量系统。
3、利用全站仪的微机处理器来控制全站仪的测量与计算,可实现气象改正,导线测量,前、后方交会,碎部测量和施工放样等计算任务。
且由于计算是由全站仪自动完成;即放线过程中完全不会受到人为因素的影响。
4、全站仪能自动读出距离数值,只要架设棱镜对准全站仪的镜头,全站仪就可读出实测的距离,且能自动计算出理论上的数据,具有测距自动和快速的特点。
5、在采用坐标放样时,其角差和放样边长都会显示在仪器屏幕上,操作很方便,尤其实在高程测量时,全站仪的一站可完成传统水准仪10站乃至50站的工作,比“传统测量仪器”可节省2/3时间,人力可节省1/2.三、全站仪在房屋建筑施工测量中的应用1、复合起始数据测量工作的第一步,是对拟建建筑物四周的城市导线点的坐标及高程等起始数据进行复核。
在此阶段,可用全站仪对城市导线点进行两测回的测角、测距,联测数据的精度满足测量规范的要求后,即可将其作为该工程布设建筑平面控制网的基准点和起算数据。
具体方法如下:(1)选取两城市控制网点N1、N2。
将N1点作为测站点并在此架设全站仪,将N2点作为目标点,在上面架设棱镜。
(2)对全站仪进行对中、整平,并设置好仪器参数。
(3)将仪器照准方向的方向值设置为零度。
全站仪可按要求的次数进行多次测距和水平角的复测并显示其平均值。
一般来说,占地面积宽广、体量庞大的建筑物提供起始控制数据的城市导线之间的距离较远,当两导线之间的距离达200-300米时,用一般光学仪器来观测容易引起误差,若使用全站仪来观测不但方便,而且精准度高。
2、通过坐标放样建立平面控制平面控制网是建筑物定位的基本依据,其原则是整体控制局部,高精度控制低精度。
使用全站仪的坐标放样功能可准确、方便的测设出整个建筑的平面控制网,并进而加密成建筑方格网。
其具体方法如下:(1)根据施工图纸,计算出各控制点及其它待放样点的坐标。
(2)选取两城市控制网点N1、N2,其坐标已知。
把N2点作为测站点,N1作为后视点。
把全站仪架在N2点上,把一台棱镜架在后视点N1点上,另一台带有测杆的棱镜由另一名测量人员来放置,放置的具体位置应听从仪器操作人员的指挥。
(3)对全站仪进行对中和整平,设置好仪器参数。
(4)进入坐标放样模式,输入测站点的坐标、仪器高、目标高。
(5)进入方位角的设置状态,输入后视点的坐标。
精确找准后视点棱镜中心,仪器根据测站点和后视点坐标,将自动完成后视点方位角的设备。
(6)再次进入坐标放样模式,输入放样点的坐标。
(7)旋转仪器的照准部,使所显示的水平角读书为零。
此时,照准部所照准的方向即为待测点的方向。
照准带测杆的棱镜(待放样点附近),通过对照准点的测量,仪器显示出预先输入的待放样值与实测值之差,即“显示值=实测值-放样值”。
(8)根据显示值,指挥持棱镜的测量人员沿照准方向移动带测杆的棱镜,直到观测屏幕上的显示值在误差范围之内。
(9)在测杆指示的位置埋上刻有“+”字丝的螺栓,用水泥砂浆将螺栓固定。
传统的放样工作使用经纬仪、钢尺、线坠等仪器,通过经纬仪拨角度、定方向以及钢尺量具来进行。
利用全站仪的坐标放样功能可有效地客服传统放样工作中的弊端,在测量过程中大大减少设站次数,可直接进行放样并省去现场的记录工作。
3、通过三角高程测距进行高程控制高程测量在整个测量工作中所占的工作量很大,也是测量工作的重要组成部分,利用全站仪的距离测量模式可精确地进行高程控制。
具体方法如下:(1)将全站仪架在水准点BM1附近。
(2)将两根装有棱镜的测杆,一根立在BM1点上,另一根立在需测标高的点上。
(3)将全站仪对中、整平,进入距离测量模式,分别测出仪器至BM1点的平距、斜距和高差h1以及仪器至所求点的平距、斜距和高差h2。
(4)若测杆1和测杆2的高度一致,则所求点A的计算式为:HA=BM1(高程)+h2-h1.若仪器至测杆1测得为负高差,则h1前变符号为“+”。
两侧杆高度不一致时,若测杆2大于测杆1一个差值,则两杆的高差减去这一差值,否则相加。
(5)通过架设的水准仪,可把A点的标高引测到露面上的其他位置。
传统的高程控制方法的缺点是工作量大,容易引起误差。
通过全站仪三角高程测距法进行高程控制,对施工作业干扰少、工作量小,引测速度快。
4、进行边坡及附近建筑物的偏移和沉降观测大型工程的边坡支护难度大,安全系数要求高。
因此,对其进行定期检测也是测量工作的一项重要内容。
其方法是:首先沿基坑四周的边线没变均匀设置3个监测点;再选取两个可以同时的基准点,其坐标和高程已定出(既已知三维坐标),把全站仪架设于其中一点上,另一点作为后视点,可定期测出监测点的三维坐标,并进行分析比较。
5、结束语全站仪在房屋建筑测量中推广应用,大大便利了对建筑物的垂直观测和平面、高程的测量控制;使得施工放样的精确度和准确度得到了很大提升,它的很多优点是其它测量仪器所不能替代的。
所以,我们应强化全站仪的推广应用;用现代科技武装建筑测量工作,来更好地保障房屋建筑工程质量。
原文:Application of total station instrument in measuring inhousing constructionAbstract: Application of total station instrument in measuring in housing construction, puts forward some matters needing attention in the use of total station instrument.Keywords:Total station, housing construction, construction surveying, applicationWith the development of science and technology, human labor is not only fast in the breadth and depth of development, and more concise and efficient. The emergence of optical rangefinder to greatly improve the measurement range and measurement speed, electronic theodolite appear not only makes the measuring accuracy is improved, the visualization is brought great convenience for measurement, electronic total station is set distance, angle, measuring height and automatic data processing of intelligent instruments in one, widely used in construction survey of high-level, large-scale housing construction.A. Total station.The total station instrument, namely the total station electronic tacheometer. Is a set of light, machine, electricity as one of the high-tech measuring instruments, is the set of horizontal angle, vertical angle, distance (distance,horizontal distance), height measurement functions in one instrument of Surveying and mapping system. The total station instrument has the advantages of high measuring precision, instrument integration, automation and intelligent degree and other advantages, has been widely used in various engineering in construction survey. Total station 3D coordinate measuring system is composed of electronic measurement, electronic distance measuring, computing and data storage unit, the measurement results can be displayed automatically, and multifunctional measuring instrument and equipment trade places. Because the total station electronic tacheometer is perfect to achieve electronic and integration of measurement and process, so people also often referred to as the total station electronic tacheometer or total station.B. Characteristics of two, the total station instrument1, Total station with its own data processing system, as long as a sighting reflecting prism; can quickly detect horizontal angle, vertical angle and slant range, automatically calculate the coordinates and elevation measurement, and can record the measurement and calculation of data.2, Through standard communication interface of total station instrument host, can realize data communication electronic total station and computer or other peripheral devices, which makes the measurement data acquisition, management, calculation and drawing form a perfect automatic measurement system.The measurement and calculation to control total station3, With total station instrument microprocessor, can realize the meteorological correction, traverse, ago, resection, detail survey and construction lofting calculation task. And because the calculation is done automatically by the total station; i.e. line process is not at all affected by man-made factors.4, The total station instrument can automatically read distance value, as long as the erecting prism alignment of total station total station instrument lens, we can read the measured distance, and can automatically calculate the theoretical data, with distance automatic and fast characteristics.5, In the use of coordinate, the angle difference and setting-out length will be shown on the instrument screen, operation is very convenient, especially in leveling, total station a station can complete the traditional level 10 station and 50 station work, than "traditional measuring instruments" can save 2\/3 time, manpower can be saved 1\/2.C. Application of three, the total station instrument in housing construction in the construction survey1. The composite initial dataThe first step is to review the measurement work, city of the proposed building wire around the coordinates and elevation of initial data. At this stage, two test back angle, distance to city traverse points can be a total stationinstrument, measurement data accuracy can meet the measurement requirements, can be used as reference plane control network layout of the project construction and initial data. Specific methods are as follows:(1) Two N1, N2 selects the city control network. N1 as the test site and on the erection of total station instrument, the N2 as the goal point, erecting prism in the above.(2) Of the total station of, leveling, and set the parameters of the instrument.(3) The instrument sighting direction value is set to zero. Total station for many times ranging and horizontal angle measurement and display its average value according to the requirements of the times.In general, covers an area of broad, huge amount of city buildings between initial conductor control data of the distance between the two wires, when the distance of 200-300 meters, using common optical instrument to observe the easy to cause the error, if the observation is not only convenient to use total station, and the precision is high.2. Through the establishment of plane coordinate controlPlane control network is the basis of building location, its principle is the overall local control, high control precision and low accuracy. Coordinate lofting function using the total station instrument can be accurate, convenient location out of plane control network of the whole building, and then encrypted intoarchitectural grid square. The specific methods are as follows:(1)Aaccording to the construction drawings, calculate the coordinates of the control points and other points to be lofting.(2) Two city control network N1, N2 selection, the known coordinates. The N2 as a test site, N1 as a viewpoint. The total station instrument rack at point N2, a prism holder in the view N1 point, prism another with rod to the placement ofa measuring staff, their locations should follow the operator command.(3) Of the total station to neutralize the leveling, set the instrument parameters.(4) Coordinate lofting mode, input the measured coordinates of the site, equipment, high.(5) Into the set state azimuth coordinate point of view, after the input. After the accurate view prism center, instrument according to the measurement site and point coordinate, will be automatically completed view azimuth equipment.(6) Once again into the coordinate lofting mode, input coordinates lofting points.(7) Rotating instrument alidade, the display so that horizontal angle reading is zero. At this point, take the alidade direction is the direction of the point to be measured. Sighting with measuring prism (near the setting-out point), by measuring the control time, instrument display input in advance to be settingvalue and measured value of difference, namely "display = measured values - setting value".(8) According to the displayed value, measuring personnel command to prism along the sighting direction prism with measuring, display on the screen until the observation value is within the error range.(9) In the bolt rod to indicate the location of buried inscribed with "+" silk, bolt will be fixed by cement mortar.Setting-out work using traditional theodolite, ruler, line sinkers, instrument, performed by theodolite dial angle, direction and the ruler measuring. By using the coordinate lofting total station instrument can effectively support the traditional shortcomings of lofting work, greatly reduce the station number in the measuring process, can be directly lofting and recording work save site.3, Through the triangle elevation ranging in height controlHeight measurement in the whole survey work in the heavy workload, but also an important part of surveying work, accurate elevation control using distance measurement model of total station instrument. Specific methods are as follows:(1) Of the total station in the vicinity of the standard BM1 frame.(2) The two with a prism rod, a vertical at point BM1, another upright in measuring elevation point.(3) Of the total station to enter, leveling, distance measurement model, respectively measure instrument to BM1 point of the horizontal distance, distance and height of H1 and instrument to calculate the horizontal distance, distance and height h2.(4) If the rod 1 and rod height 2, calculating the point A is: HA=BM1 (elevation) +h2-h1. if the instrument to probe 1 measured height is negative, H1 variable symbol "+". Both sides of the height of the pole is not consistent, if greater than 1 bar 2 bar a difference, two pole height minus the difference, or additive.(5) Through the level set, the elevation of A of test to another location surface.The traditional control method has the disadvantages of heavy workload, easy to cause the error. Elevation control by trigonometric leveling of total station location method of construction operation, less interference, small workload, surveying speed.4, Deviation of the slope and nearby buildings and settlement observationLarge engineering slope supporting difficulty is big, high safety coefficient. Therefore, an important part of a regular inspection and measurement of the. The method is: first of all around the foundation pit sideline did not even set up3 monitoring points; then select two can also reference point, the coordinates and elevation has identified (both known 3D coordinates), the point of total station instrument is arranged on, another point as the point of view, can be regularly measured 3D coordinate monitoring points, comparison and analysis.5, The conclusionApplication of total station instrument in the measurement of housing construction, greatly facilitate the measurement of vertical observation and control plane, elevation of buildings; the construction lofting precision and accuracy has been greatly improved, many advantages it is not replaced by other measuring instruments. Therefore, we should strengthen the popularization and application of total station instrument; armed with modern science and technology building surveying work, to better ensure the quality of housing construction.。