AREVA2010年1季度季报
- 格式:pdf
- 大小:1.21 MB
- 文档页数:58

政府主导投资是2009 年经济增长的主要驱动力,但最近房地产投资的拉动作用十分突出。
据估算,2009 年政府主导投资增长了42%(固定资产投资名义增长),而基于市场的投资仅增长了18%然而,2009 年底至2010 年初,政府主导投资的增长(年同比)已经大幅下滑(图3)。
房地产投资在2009 年初非常疲弱。
但部分由于充裕的流动性,房屋销售很快回升,在许多城市推高了房价,居民家庭消费增长保持平稳。
劳动力市场在经历了2009 年初的疲软之后已经得到改善。
直至2010 年初,就业和工资都保持了较好增长。
2009 年全年大部分时间居民消费价格都处于下降态势。
这由于进口强劲降低了贸易盈余,在2009 年外部贸易大大拉低了经济增速。
加工贸易进口的变化虽然人民币兑美元汇率没有变化,但人民币的有效汇率继续波动。
人民币在2008 年底开始重新钉住美元。
4 然而,中国对外贸易的很大一部分是与美国以外的国家发生的。
因此,随着美元对其他货币汇率的波动,按贸易加权的人民币币值变化与人民币对美元的汇率变化差别很大。
中国的名义有效汇率(NEER)在经历了2000 年到2005 年间的贬值之后,从2005 年7 月至2010 年3 月初这段时间升值了12.3%。
现在的NEER 大致处于2000 年的水平(图9)。
按消费者价格指数计算的实际有效汇率(REER)也是如此。
此外,由于自2008 年底人民币重新钉住美元,美元汇率的大幅波动也意味着中国对其大多数贸易伙伴的货币的汇率在上下变动。
房地产价格的激增触发了扩大供给、抑制投机的政策措施。
措施明确并二套房的首付比例不得低于40%;取消住房按揭贷款的优惠利率;将土地出让金首付比例从20-30%提高至50%;恢复征收房地产交易的营业税。
另一方面,有调查显示,房地产价格的迅速提高也增强了人们的通胀预期。
Surging property prices triggered policy measures to expand supply and curb speculation. These included clarifying and enforcing the policy on the minimum down payment ratio for second houses (to 40 percent); removing the “discount” on the mortgage interest rate; raising the minimum down然而,高收入国家2010-11 年的复苏可能将非常缓慢,全球进口需求仍将低迷。

SHENZHEN SEG CO., LTD.The First Quarterly Report 2010 (Full Text)§1. Important Notes1.1 The Board of Directors and Supervisory Committee of Shenzhen SEG Co., Ltd. (hereinafter referred to as the Company) and its directors, supervisors and senior executives confirm hereby that there are no any fictitious statements, misleading statements, or important omissions carried in this report, and shall take all the responsibilities, individual and/or joint, for the reality, accuracy and completeness of the whole contents.1.2 The First Quarterly Financial Report of 2010 has not been audited by CPAs.1.3 Zhang Weimin, Principal of the Company, Li Lifu, Person in Charge of Accounting Affairs and Ying Huadong, Person in Charge of Accounting Organ (Accounting Supervisor) hereby confirm that the Financial Report of the First Quarterly Report is true and complete.§2. Company Profile2.1 Main accounting data and financial indexes:Unit: RMBAt the end of reportperiod At the period-end oflast yearChanges ofincrease/decrease (%)Total assets (RMB) 1,381,542,466.011,359,490,387.43 1.62% Owners’ equity attributable toshareholders of listed company (RMB)1,044,336,545.891,015,659,488.47 2.82% Share capital (Share) 784,799,010.00784,799,010.00 0.00% Net asset per share attributable toshareholders of listed company(RMB/Share)1.331 1.2942.86%In the report period The same period of lastyearChanges ofincrease/decrease (%)Total operating income (RMB) 91,307,818.0567,892,989.04 34.49% Net profit attributable to shareholders oflisted company (RMB)15,759,677.99-88,214,473.65 -117.87% Net cash flow arising from operatingactivities (RMB)17,840,734.0613,913,598.52 28.23% Net cash flow arising from operatingactivities per share (RMB/Share)0.02270.0177 28.25% Basic earnings per share (RMB/Share) 0.0201-0.1124 -117.87% Diluted earnings per share (RMB/Share) 0.0201-0.1124 -117.87% Weighted average return on equity (%) 1.53%-6.79% 8.32% Weighted average return on equity afterdeducting non-recurring gains and losses(%)1.53%-7.08% 8.61%Items of non-recurring gains and lossesAmount from year-beginning to the end of report periodOther non-operating income and expenditure except for the aforementioned items 97,850.12 Influenced amount of income tax -21,527.03Influenced amount of minority shareholders’ equity -31,864.37Total 44,458.72 Explanations of items of significant non-recurring gains and losses1. Other non-operating income and expenditure except for the aforementioned items:mainly the damages for breach of contract received by the Company;2. Influenced amount of income tax: the influenced amount of deductible income tax increased due to the profit increase because of the aforementioned item;;3. Influenced amount of minority shareholders’ equity: this item increased due to the increase of the aforementioned No.1 item of controlling subsidiary of the Company.2.2 Total number of shareholders at the end of the report period and shares held by the top ten shareholders without restricted conditionsUnit: Share Total number of shareholdersat the end of report period59,152Particulars about the shares held by the top ten tradable shareholders without restricted conditionsFull name of shareholder Amount of tradable shares withoutrestricted conditions held at the endof report periodType of sharesSHENZHEN SEG GROUP CO., LTD. 237,359,666 RMB ordinary shares GUANGZHOU FODAK ENTERPRISEGROUP CO., LTD.18,880,334 RMB ordinary shares Yang Zhihui 12,582,734 RMB ordinary shares Taifook Securities CompanyLimited-Account Client5,758,103 Domestically listed foreign shares Gong Qianhua 5,560,967 Domestically listed foreign shares Zeng Ying 4,280,048 Domestically listed foreign shares Zhu Wei 4,066,739 RMB ordinary shares Tang Lizhu 3,796,200 RMB ordinary shares SHANGHAI QILE ECONOMIC ANDTRADE CO., LTD.2,754,330 RMB ordinary shares Cao Xianhua 2,702,000RMB ordinary shares§3. Significant Events3.1 Particulars about material changes in items of main accounting statement and financial index, and explanations of reasons√Applicable □InapplicableI. Balance sheet itemItem Mar. 31, 2010 Dec. 31, 2009 Balance Proportion ofchanges % Inventory 1,919,437.27 5,886,392.39 -3,966,955.12 -67.39% Construction in progress 9,776,526.68 26,192,075.55 -16,415,548.87 -62.67% Staff salaries payable 1,172,559.95 4,261,476.99 -3,088,917.04 -72.48% 1. Inventory: decreased by RMB 3.97 million with a fall of 67.39% over the end of last year, which was mainly because the inventories of the Company decreased in the report period.2. Construction in progress: decreased by RMB 16.42 million with a fall of 62.67% over the end of last year. Its reason was that the construction in progress of the subsidiary Changsha SEG Development Co., Ltd. (hereinafter referred to as Changsha SEG) was completed and thentransferred into fixed assets in the report period.3. Staff salaries payable: decreased by RMB 3.09 million with a fall of 72.48% over the end of last year. Its reason was that the Company paid the staff for salaries in the report period.II. Income statement itemItem Amount in thisperiodAmount in thesame period oflast yearBalanceProportion ofchanges %Operating income 91,307,818.0567,892,989.0423,414,829.01 34.49% Operating cost 56,496,489.2231,746,485.6924,750,003.53 77.96% Operating tax and extras 3,724,614.303,012,887.52711,726.78 23.62% Sales expense 1,370,260.25906,378.64463,881.61 51.18% Losses from devaluation ofassets--1,500,000.001,500,000.00 -100.00% Investment gains -3,029,152.47-115,823,698.14112,794,545.67 -97.38% Operating profit 23,529,850.53-85,166,016.78108,695,867.31 -127.63% Non-operating income 139,079.301,620,912.10-1,481,832.80 -91.42% Non-operating expenditure 41,229.18100,985.93-59,756.75 -59.17% Total profits 23,627,700.65-83,646,090.61107,273,791.26 -128.25% Income tax expense 5,951,587.042,313,487.223,638,099.82 157.26% Net profit 17,676,113.61-85,959,577.83103,635,691.44 -120.56% Net profit attributable toowners of parent company15,759,677.99-88,214,473.65103,974,151.64 -117.87% Basic earnings per share 0.0201-0.11240.1325 -117.87% Diluted earnings per share 0.0201-0.11240.1325 -117.87% Other consolidated income 12,964,835.24-574,782.6813,539,617.92 -2355.61% Total consolidated income 30,640,948.85-86,534,360.52117,175,309.37 -135.41% Total consolidated incomeattributable to owners ofparent company28,677,057.42-88,896,727.63117,573,785.05 -132.26% 1. Operating income: increased by RMB 23.41 million with an increase of 34.49% over the same period of last year. The main reasons were i. In the report period, Changsha SEG and Changsha Hotel of Shenzhen Mellow Orange Business Hotel Management Co., Ltd. (hereinafter referred to as Mellow Orange Hotel) started operation which increased the operating income of the Company; ii. Income from Buy-it Store increased compared with the same period of last year.2. Operating cost: increased by RMB 24.75 million with an increase of 77.96% over the same period of last year. The main reason was the increase of operating income caused the increase of operating cost accordingly.3. Operating tax and extras: increased by RMB 710,000 with an increase of 23.62% over the same period of last year. The main reason was the increase of operating income caused the increase ofoperating tax and extras accordingly.4. Sales expense: increased by RMB 460,000 with an increase of 51.18% over the same period of last year. The main reason was the increase of operating income caused the increase of sales expense accordingly.5. Losses from devaluation of assets: no losses from devaluation of assets occurred in the report period, whereas that was RMB -1.5 million in the same period of last year. The main reasons was part of account receivable which had been withdrawn losses of bad debts in the same period of last year was taken back through lawsuit.6. Investment gains: increased by RMB 112.79 million over the same period of last year. The main reason was the losses of Shenzhen SEG Samsung Co., Ltd. (hereinafter referred to as SEG Samsung) in which the Company holds 22.45% of its equity decreased in the report period over the same period of last year.7. Operating profit: increased largely over the same period of last year. The main reasons were the losses of SEG Samsung in which the Company holds 22.45% of its equity decreased in the report period over the same period of last year causing a large decrease in investment losses.8. Non-operating income: decreased by RMB 1.48 million with a decrease of 91.42% over the same period of last year. The main reasons were the Company switched back the account payable which it did not need to pay in the same period of last year, but no such switch-back occurred in the report period.9. Total profits: increased largely over the same period of last year. The main reason was the same as that of Item 7.10. Income tax expense: increased by RMB 3.64 million with an increase of 157.26% over the same period of last year. The main reason was the profit payable of this report year went up and income tax rate of this report year in Shenzhen also grew.11. Net profit: increased largely over the same period of last year. The main reason was the same as that of Item 7.12. Net profit attributable to owners of parent company: increased largely over the same period of last year. The main reason was the same as that of Item 7.13. Basic earnings per share: increased largely over the same period of last year. The main reasons were the same with Item 7.14. Diluted earnings per share: increased largely over the same period of last year. The main reason was the same as that of Item 7.15. Other consolidated income: increased by RMB 13.54 million largely over the same period of last year. The main reason was in the report period, SEG Samsung in which the Company holds 22.45% of its equity received the financial support funds amounting to RMB 56 million from its shareholder Samsung Corning Investment Co., Ltd., thus RMB 12.57 million was added into other consolidated income of the Company.16. Total consolidated income: increased largely over the same period of last year. The main reasons were the same as that of Items 7 and 15.17. Total consolidated income attributable to owners of parent company: increased largely over the same period of last year. The main reason was the same as that of Items 7 and 15.III. Cash flow statement itemItem Amount in thisperiodAmount in thesame period oflast yearBalanceProportion ofchanges %Other cash receivedrelating to operating activities64,583,939.9735,621,486.0928,962,453.88 81.31% Cash paid to/for staff andworkers11,883,672.359,605,770.002,277,902.35 23.71%Other cash paid relating to53,590,151.5031,135,749.7322,454,401.77 72.12% operating activitiesCash received from0.002,198,720.24-2,198,720.24 -100.00% recovering investmentNet cash received from15,444.00141,500.00-126,056.00 -89.09% disposal of fixed, intangible andother long-term assetsNet cash received from disposal0.0034,229,363.41-34,229,363.41 -100.00% of subsidiaries and other unitsCash paid for purchasing fixed,4,591,584.05701,547.003,890,037.05 554.49% intangible and other long-termassetsCash paid for investment 0.0053,030,000.00-53,030,000.00 -100.00% 1. Other cash received relating to operating activities: increased by RMB 28.96 million with an increase of 81.31% over the same period of last year. The main reasons were i. items of newly-opened Changsha SEG and Mellow Orange Hotel in the report period and newly-increased Buy-it Store in last May increased; ii. The general cashing business was developed in the electronic market, so the goods payment received on behalf of merchants increased.2. Cash paid to/for staff and workers: increased by RMB 2.28 million with an increase of 23.71% over the same period of last year. The main reasons were in the report period, Changsha SEG and Mellow Orange Hotel started operations, and the staff in Buy-it Store added increasing the salaries payable to the staff of the three companies.3. Other cash paid relating to operating activities: increased by RMB 22.45 million with an increase of 72.12% over the same period of last year. The main reasons were i. items of Changsha SEG and Mellow Orange Hotel newly-opened in the report period and Buy-it Store newly-increased last year increased; ii. The general cashing business was developed in the electronic market, the goods payment returning to merchants increased.4. Cash received from recovering investment: decreased by RMB 2.2million over the same period of last year. The main reason was in the same period of last year, the Company reduced the shares of Shenzhen Zero-Seven Co., Ltd. held by the Company amounting to 530,000, but no such sales occurred in the report period.5. Net cash received from disposal of fixed, intangible and other long-term assets: decreased by RMB 130,000 with a decrease of 89.09% over the same period of last year. The main reasons was the amount of fixed assets disposal in the same period of last year was bigger.6. Net cash received from disposal of subsidiaries and other units: decreased by RMB 34.23 million over the same period of last year. The main reasons was in the same period of last year, the Company received the equity account on selling former subsidiaries Shenzhen SEG Communications Co., Ltd, but no such sales of subsidiary occurred in the report period.7. Cash paid for purchasing fixed, intangible and other long-term assets: increased by RMB 3.89 million with an increase of 554.49% over the same period of last year. The main reasons were: the newly-opened Changsha SEG and Mellow Orange Hotel purchased fixed assets in the report period, thus the item increased.8. Cash paid for investment: decreased by RMB 55.03 million over the same period of last year. The main reason was in the same period of last year, the Company purchased 46 percent of the equity of Changsha SEG, but no such expenditure of equity acquisition occurred in the report period.3.2 Analysis and explanation of significant events and their influence and solutions□Applicable √Inapplicable3.3 Implementations of commitments by the Company, shareholders and actual controller√Applicable □InapplicableItem of CommitmentsPromiseeContent of commitmentsImplementationCommitments on Share Merger ReformInapplicable ----Commitments on share restricted tradeInapplicable ----Commitments made in Acquisition Report or Reports on Change in EquityInapplicable ----Commitments made in MaterialAssets ReorganizationInapplicable----Commitments made in issuanceShenzhen SEG Group Co., Ltd. Article 5 of the Equity Transfer Agreement which the Company had signed with SEG Group at the time of the Company’s listing stipulated: SEG Group permits the Company, as well as its subsidiaries of theCompany and affiliated companies to use the 8 registered trademarks that SEG Group has presently registered at the StateTrademark Office; italso permits theCompany to take the aforesaid trademarks and symbols that are similar to these marks as the symbol of the Company, as well as to use the aforesaid symbols or symbols that are similar to these symbols during the operation process; the Company doesn’t have to pay SEG Group any fee for the use of the aforesaidtrademarks or symbols.In the report period, this commitmentwas still executed according to thecommitment.Other commitments (includingadditional commitments)Shenzhen SEG Group Co., Ltd. According to the problem of “Yourcompany’s existing same industry competition in theelectronic market business with SEGIn the report period, controllingshareholder abided by the above commitment.Group” pointed outby Shenzhen Securities Regulatory Bureau in 2007 at the spot investigation of the Company, the Company received written Commitment Letter from SEG Group on Sep.14, 2007 and the content was as follows: our Group has similar business in Shenzhen electronic market with Shenzhen SEG Co., Ltd. (Shenzhen SEG), and the business was resulted by history and it has objective market developmentbackground. The Group made commitment: For the future, we do not operate on the market which is similar to Shenzhen SEG singly in the same city. The aforesaid matters have been disclosed in Securities Times ,China Securities Journal and Hong Kong Wen Wei Po and Juchao Website dated Sep. 18, 2007. In the report period, the holding company observed the above commitment.3.4 Estimation of accumulative net profit from the beginning of the year to the end of next report period to be a loss probably or the warning of its material change compared with the same period of last year and explanation of its reason √Applicable □InapplicableFore-notice of performances Carry-back of lossesYear-beginning to the end of next report period The same period oflast yearChange of increase/decrease (%)Estimated amount ofaccumulative net profit(RMB’0000)Approximately 1,600.00to2,700.00-14,608.35 -- -- Basic earnings per share(RMB/Share)Approximately 0.0204 to -0.1861 -- --0.0344Explanations onfore-notice ofperformances(1) SEG Samsung in which the Company holds its equity is predicted to suffer aloss accumulatively from RMB 30 million to RMB 50 million from year-beginning toend of next report period;(2) The performance prediction has not been pre-audited by CPAs.3.5 Other significant events which need explanations3.5.1 Particulars about securities investment □Applicable √Inapplicable3.5.2 Registration form of receiving research, communication and interview in the report periodDate Place Way ObjectsDiscussed main contents andsupplied materials Jan. 6, 2010 Office of the Company Telephone communication Investors Basic information of theCompany Feb. 12, 2010 Office of the Company Telephone communication Holder of B share Basic information of theCompany Mar. 26, 2010 Office of the Company Telephone communication Holder of B share Basic information of theCompany Apr. 7, 2010Office of the CompanyEnquire in written formSecurities DailyGot to know relevant public information of the Company3.5.3 Explanations of other significant events √Applicable □InapplicableThe net profit attributable to owners of parent company disclosed in the 1st quarterly report 2009 was RMB 2.85 million, but that of the same period of last year disclosed in the report was RMB -88.21 million, with the change amount of RMB -91.06 million. The reason for such change was the net profit attributable to owners of parent company of SEG Samsung in which the Company holds 22.45% of its equity disclosed in the 1st quarterly report 2009 was RMB-122 million, whereas that of the same period of last year disclosed in 1st quarterly report 2010 was RMB -504 million. The Company calculated the investment gains from SEG Samsung based on equity method, which caused the investment losses of the same period of last year disclosed in this report of the Company increased by RMB 91.06 million over that disclosed in the 1st quarterly report of 2009.3.6 Particulars about derivatives investment □Applicable √Inapplicable3.6.1 Particulars about derivatives investment held at the end of report period □Applicable √Inapplicable§4. Appendix4.1 Balance sheetPrepared by Shenzhen SEG Co., Ltd. March 31, 2010 Unit: RMBBalance at period-end Balance at year-beginning Items Consolidation Parent Company Consolidation Parent Company Current assets:Monetary funds 498,955,096.86372,852,381.52485,135,270.94 375,350,393.53 SettlementprovisionslentCapitalTransactionassetfinancereceivableNotesAccounts receivable 17,234,225.88400,000.0018,130,631.40 1,134,357.47 Accounts paid in advance 20,037,842.341,081,095.0018,404,268.08 8,035,295.00 receivableInsurancereceivablesReinsuranceContract reserve ofreinsurance receivableInterest receivable 2,460,821.922,460,821.922,460,821.92 2,460,821.92Dividend receivableOther receivables 12,042,162.4945,095,461.3911,971,998.74 45,306,466.00 Purchase restituted financeassetInventories 1,919,437.275,886,392.39 Non-current asset duewithin one yearassetsOthercurrentTotal current assets 552,649,586.76421,889,759.83541,989,383.47 432,287,333.92 Non-current assets:Granted loans and advancesFinance asset available for4,229,970.093,548,500.003,843,571.87 3,304,100.00 salesHeld-to-maturityinvestmentLong-term accountreceivableLong-term equity129,274,947.39310,372,446.43119,732,099.86 300,829,598.90 investmentInvestment property 438,740,452.42345,143,558.87442,502,999.44 347,797,315.91 Fixed assets 210,589,972.7523,031,843.38189,516,718.30 23,314,450.93 Construction in progress 9,776,526.6826,192,075.55materialEngineeringDisposal of fixed assetassetbiologicalProductiveOil and gas assetIntangible assets 4,681,177.38610,581.394,756,432.31 651,865.38 Expense on Research andDevelopmentGoodwill 10,328,927.8210,328,927.82Long-term expenses to be 13,684,505.73961,414.0213,041,779.82 1,165,451.06apportionedDeferred income tax asset 7,586,398.995,994,015.937,586,398.99 5,994,015.93 assetnon-currentOtherTotal non-current asset 828,892,879.25689,662,360.02817,501,003.96 683,056,798.11 Total assets 1,381,542,466.011,111,552,119.851,359,490,387.43 1,115,344,132.03 Current liabilities:Short-termloansLoan from central bankAbsorbing deposit andinter-bank depositborrowedCapitalTransaction financialliabilitiespayableNotesAccounts payable 7,716,840.382,149,017.128,225,509.02 2,178,169.12Accounts received in90,214,246.1242,701,579.41105,563,890.39 65,801,272.52 advanceSelling financial asset ofrepurchaseCommission charge andcommission payableWage payable 1,172,559.9524,450.874,261,476.99 2,065,724.98 Taxes payable 26,095,556.9526,470,386.0424,421,758.66 24,773,634.49 payableInterestDividend payable 921,420.73153,403.29921,420.73 153,403.29 Other accounts payable 95,328,850.9637,415,008.7786,454,289.91 41,932,495.62 payablesReinsuranceInsurance contract reserveagencySecurity trading ofSecurity sales of agencyNon-current liabilities duewithin 1 yearliabilitiescurrentOtherTotal current liabilities 221,449,475.09108,913,845.50229,848,345.70 136,904,700.02 Non-current liabilities:loansLong-termpayableBondspayableLong-termaccountSpecial accounts payableliabilitiesProjectedDeferred income tax liabilities 22,970,034.63547,125.7123,160,034.29 547,125.71 non-currentliabilitiesOtherTotal non-current liabilities 22,970,034.63547,125.7123,160,034.29 547,125.71 Total liabilities 244,419,509.72109,460,971.21253,008,379.99 137,451,825.73 Owner’s equity (or shareholders’equity):Paid-in capital (or sharecapital)784,799,010.00784,799,010.00784,799,010.00 784,799,010.00 Capital public reserve 409,833,425.36407,164,608.41396,922,482.95 394,348,208.41 Less: Treasury stocksReasonable reserveSurplus public reserve 102,912,835.67102,912,835.67102,912,835.67 102,912,835.67 Provision of general riskRetained profit -252,672,245.53-292,785,305.44-268,431,923.52 -304,167,747.78 Balance difference offoreign currency translation-536,479.61-542,916.63Total owner’s equity attributableto parent company1,044,336,545.891,002,091,148.641,015,659,488.47 977,892,306.30 Minority shareholders’ interests 92,786,410.4090,822,518.97Total owner’s equity 1,137,122,956.291,002,091,148.641,106,482,007.44 977,892,306.30 Total liabilities and owner’sequity1,381,542,466.011,111,552,119.851,359,490,387.43 1,115,344,132.03 4.2 Profit statementPrepared by Shenzhen SEG Co., Ltd. Jan.-Mar. 2010 Unit: RMBAmount in this period Amount in last period ItemsConsolidation Parent Company Consolidation Parent Company I. Total operating income 91,307,818.0528,545,784.8967,892,989.04 28,312,781.50 Including: Operating income 91,307,818.0528,545,784.8967,892,989.04 28,312,781.50 InterestincomeInsurancegainedCommission charge andcommission incomeII. Total operating cost 64,748,815.0510,069,765.9037,235,307.68 6,271,611.87 Including: Operating cost 56,496,489.228,821,226.1931,746,485.69 6,224,508.93 InterestexpenseCommission charge andcommission expenseCash surrender valueNet amount of expense ofcompensationNet amount of withdrawalof insurance contract reserveBonus expense of guaranteeslipReinsuranceexpenseOperating tax and extras 3,724,614.301,652,232.843,012,887.52 1,426,154.86 Sales expenses 1,370,260.25906,378.64Administration expenses 6,914,893.783,749,113.976,753,654.36 3,527,096.41 Financial expenses -3,757,442.50-4,152,807.10-3,684,098.53 -3,406,148.33Losses of devaluation of asset -1,500,000.00-1,500,000.00Add: Changing income offair value (Loss is listed with“-”)Investment income (Loss is-3,029,152.47-3,029,152.47-115,823,698.14 -115,823,699.14 listed with “-”)Including: Investmentincome on affiliated companyand joint ventureExchange income (Loss islisted with “-”)III. Operating profit (Loss is23,529,850.5315,446,866.52-85,166,016.78 -93,782,529.51 listed with “-”)Add: Non-operating income 139,079.30300.001,620,912.10 1,486,477.57Less: Non-operating41,229.18100,985.93expenseIncluding: Disposal loss ofnon-current assetIV. Total Profit (Loss is listed23,627,700.6515,447,166.52-83,646,090.61 -92,296,051.94 with “-”)Less: Income tax 5,951,587.044,064,724.182,313,487.22 450,000.00V. Net profit (Net loss is listed17,676,113.6111,382,442.34-85,959,577.83 -92,746,051.94 with “-”)Net profit attributable to15,759,677.9911,382,442.34-88,214,473.65 -92,746,051.94 owner’s equity of parentcompanyMinority shareholders’ gains1,916,435.622,254,895.82and lossesVI. Earnings per sharei. Basic earnings per share 0.02010.0145-0.1124 -0.1182 ii. Diluted earnings per share 0.02010.0145-0.1124 -0.1182 VII. Other consolidated income 12,964,835.2412,816,400.00-574,782.68 -682,253.97 VIII. Total consolidated income 30,640,948.8524,198,842.34-86,534,360.51 -93,428,305.91 Total consolidated income28,677,057.4224,198,842.34-88,896,727.62 -93,428,305.91 attributable to owners of parentcompanyTotal consolidated income1,963,891.432,362,367.11attributable to minorityshareholders4.3 Cash flow statementPrepared by Shenzhen SEG Co., Ltd. Jan.-Mar. 2010 Unit: RMBAmount in this period Amount in last period ItemsConsolidation Parent Company Consolidation Parent Company I. Cash flows arising fromoperating activities:Cash received from selling76,838,162.928,489,484.2877,509,335.13 16,793,838.47 commodities and providinglabor servicesNet increase of customerdeposit and inter-bank depositNet increase of loan fromcentral bankNet increase of capitalborrowed from other financialinstitutionCash received fromoriginal insurance contract feeNet cash received fromreinsurance businessNet increase of insuredsavings and investmentNet increase of disposal oftransaction financial assetCash received from interest,commission charge andcommissionNet increase of capitalborrowedNet increase of returnedbusiness capitalWrite-back of tax receivedOther cash receivedrelating to operating activities64,583,939.9735,796,951.0335,621,486.09 34,108,393.77 Subtotal of cash inflowarising from operating activities141,422,102.8944,286,435.31113,130,821.22 50,902,232.24 Cash paid for purchasingcommodities and receivinglabor service34,506,524.285,428,566.4833,515,780.98 4,689,090.60Net increase of customerloans and advancesNet increase of deposits incentral bank and inter-bankCash paid for originalinsurance contractcompensationCash paid for interest,commission charge andcommissionCash paid for bonus ofguarantee slipCash paid to/for staff andworkers11,883,672.355,234,585.349,605,770.00 4,602,269.51 Taxes paid 23,601,020.7018,545,462.2824,959,921.99 18,464,019.40 Other cash paid relating tooperating activities53,590,151.5017,876,799.3431,135,749.73 14,893,005.25Subtotal of cash outflowarising from operating activities123,581,368.8347,085,413.4499,217,222.70 42,648,384.76Net cash flows arisingfrom operating activities17,840,734.06-2,798,978.1313,913,598.52 8,253,847.48II. Cash flows arising frominvesting activities:Cash received from recovering investment 2,198,720.242,198,720.24Cash received frominvestment income5,270,590.49 Net cash received from 15,444.00141,500.00。

010年第一季度经济运行分析2010年第一季度经济运行分析2010-4-27一、当前经济运行形势分析1、经济向好形势进一步发展2010年一季度,我国经济向好形势进一步发展。
初步核算,一季度国内生产总值80577亿元,按可比价格计算,同比增长11.9%,增速较上年同期加快5.7个百分点。
其中,第一产业增加值5139亿元,增长3.8%;第二产业增加值39072亿元,增长14.5%;第三产业增加值36366亿元,增长10.2%。
图1:2006-2010年季度GDP同比增长变化单位:%资料来源:国研网统计数据库图2:2008-2010年三大产业增加值季度同比增长变化单位:%资料来源:国研网统计数据库2、工业生产快速回升,企业效益大幅提高Wang Department responsible for the pro-democracy movement the Han Chang Yan Tomb. He used to work, wide exposure to four rural peasants, to publicize Japanese thought, and to establish the perimeter of the party organization "Jiangnan anti-Japanese guerrilla people salvation." East water village Shen Yingjie, also participated in the Organization and served as team leader. August Zhu Xi Nan Xun Kang Wang, also has made a night attack bridge Japanese defenders, and the Eastern attack zhenze traitors was the puppet command, enemy steamer and seized a large quantity of firearms, ammunition, supplies and file photos of victory. That same month, Zhu Wang achieved in deqing, Wu Kang border forces also recovered "three mountains" (Hui shan, Shan, dry mountain) victory. In September, the second guerrilla Brigade of the Communist Party Member Wen Yongzhi as captain of Wuxing County about 150 guns, to shake off the annexation of the Wuxing County Government, and he demanded, Zhejiang Province, Lin Jie Xu knows delegate to the West to lead. Decided to Jie Xu with the reputation of the identity of the Chinese Communist Party, Xu Jin talks with Zhu Xi, Zhu Bucheng Brigade of temperature programmed. Zhu Xi, agreed. Thus, cleaning party members into the Zhu Xi forces, such as Xu, Xu by superiors and sent to party members after all. In October, party group, Xu cleaning team leader, directly under the leadership of CPC Zhejiang Provincial Committee. Party groups actively working, restored Han chang and others from the party. Help Zhu Xiestablished the Department and strengthen youth service corps, the establishment of women's team, run training courses in rotation drawn the officers and men of the Regiment, group. Strengthening the political and ideological education of officers and men, advocacy and national salvation movement aim to inspire soldiers2010年一季度,全国规模以上工业增加值同比增长19.6%,增速较上年同期加快14.5个百分点。

经济增长强劲结构调整提速——2010年一季度GDP数据点评一、内需平衡、外需改善促中国GDP连续四个季度回升4月14日国家统计局公布了2010年中国一季度宏观经济数据,其中GDP数据显示,经初步核算,2010年一季度我国GDP同比增长11.9%,增速比上年同期加快5.7个百分点,比去年四季度进一步加快1.2个百分点。
从去年二季度开始,GDP增速已经连续四个季度回升。
在三大需求中,一季度最终消费对GDP的增长贡献率为52%,拉动GDP增长6.2个百分点;资本形成对GDP增长的贡献率为57.9%,拉动GDP增长6.9个百分点;进出口对GDP 增长的贡献率为-9.9%,拉动GDP-1.2%。
内需仍是拉动GDP 快速回升的关键,外需的负作用也在减少。
在内需中,消费贡献相对较为稳定,今年一季度贡献率为52%,去年全年贡献率是53.1%,贡献的大体是相当的。
投资贡献率仍为最高,但贡献率回落,由去年全年资本形成的贡献率94.6%回落到今年一季度57.9%。
外需对经济增长的贡献率则由去年全年的-44.8%回升到今年一季度的-9.9%。
二、短期经济增长无忧,2010年中国经济重启上升周期中国经济在摆脱全球金融危机的负面影响之后,经济增长的内生动力已经逐步恢复并将不断增强,从而推动中国经济增长重回上升周期。
从推动经济增长的三驾马车来看,虽然投资增速可能会在刺激政策作用逐步消退、政府投资项目减少等因素影响下有所下降,但出口应该能在全球经济复苏的带动下恢复到正常增长状态,同时国内消费也仍将保持平稳增长态势。
因此,我们预计2010年我国GDP增速有望进一步回升,全年将达到10.8%左右。
1、刺激政策退出和结构调整使投资增速回归正常水平由于今年中央严格控制新开工项目,2010年1-3月份全社会固定资产投资同比增长25.6%,比上年同期回落3.2个百分点。
其中基建投资增速显著回落,如1-3月铁路运输业投资同比增速16.4%,较09年同期下降86个百分点。
2010年一季度中国宏观经济形势分析(中国人民银行调查统计司 2010年4月23日)2010年中国经济开局良好,对外贸易加快恢复,国内工业生产快速增长,消费增长较快,固定资产投资增幅回落,消费价格基本稳定,货币信贷调控初见成效,经济回升向好势头更加巩固。
下一阶段,应继续加强流动性管理,保持货币信贷适度增长,努力稳定价格总水平,处理好保持经济平稳较快发展、调整经济结构和管理通胀预期的关系。
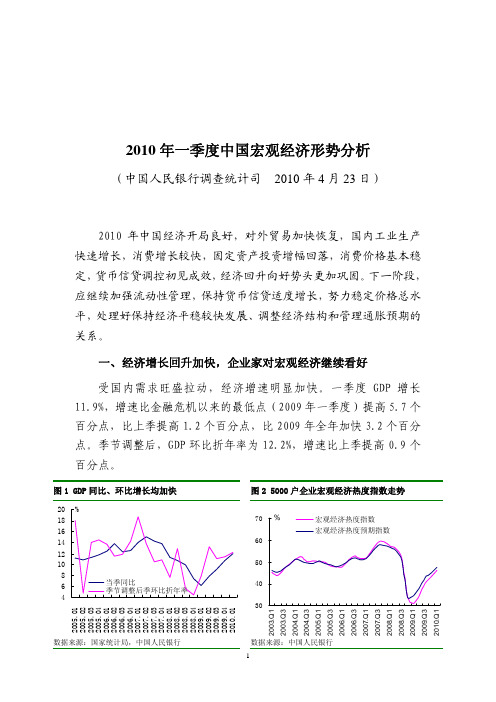
一、 经济增长回升加快,企业家对宏观经济继续看好受国内需求旺盛拉动,经济增速明显加快。
一季度GDP增长11.9%,增速比金融危机以来的最低点(2009年一季度)提高5.7个百分点,比上季提高1.2个百分点,比2009年全年加快3.2个百分点。
季节调整后,GDP环比折年率为12.2%,增速比上季提高0.9个百分点。
图1 GDP同比、环比增长均加快 图2 5000户企业宏观经济热度指数走势数据来源:国家统计局,中国人民银行数据来源:中国人民银行人民银行企业家问卷调查显示,2010年一季度,5000户企业宏观经济热度指数为45.9%,比上季上升2.7个百分点,在2009年一季度达到谷底后连续4个季度回升,但仍比危机前(2008年二季度)水平低10.2个百分点。
宏观经济热度预期指数为47.5%,比上季上升2.6个百分点,反映企业家对未来宏观经济继续看好。
二、工业生产增速快速提升,企业效益大幅度增长一季度规模以上工业增加值同比增长19.6%,比上年同期和上季分别提高14.5和1.6个百分点,其中,3月份增长18.1%。
剔除季节因素后,工业增加值季环比增速为3.9%,略低于上季4.2%的环比增速。
据人民银行调查统计司测算,同工业潜在产出相比,3月份工业增加值产出缺口①为3.06%,为1998年以来的最高水平,工业增加值产出缺口已经连续7个月扩大。
反映工业生产活跃程度的发电量和用电量增长加快。
3月份发电量同比增长17.6%,比上年同期提高18.9个百分点。
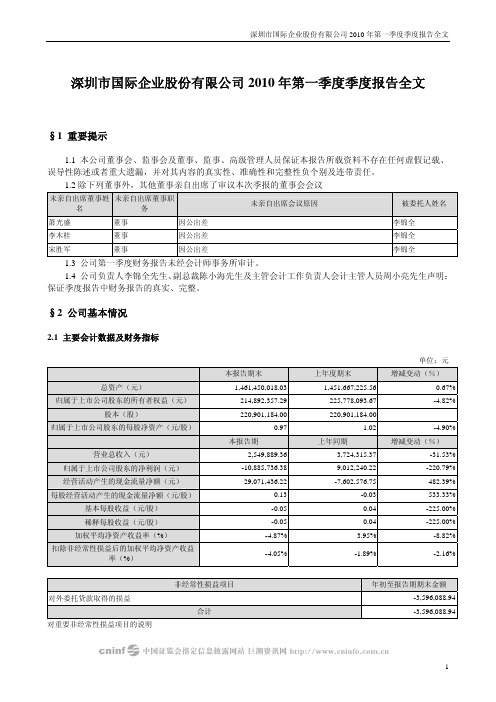
深圳市国际企业股份有限公司2010年第一季度季度报告全文§1 重要提示1.1 本公司董事会、监事会及董事、监事、高级管理人员保证本报告所载资料不存在任何虚假记载、误导性陈述或者重大遗漏,并对其内容的真实性、准确性和完整性负个别及连带责任。
1.2除下列董事外,其他董事亲自出席了审议本次季报的董事会会议未亲自出席董事姓名未亲自出席董事职务未亲自出席会议原因被委托人姓名萧光盛董事因公出差李锦全李木桂董事因公出差李锦全宋胜军董事因公出差李锦全1.3 公司第一季度财务报告未经会计师事务所审计。
1.4 公司负责人李锦全先生、副总裁陈小海先生及主管会计工作负责人会计主管人员周小亮先生声明:保证季度报告中财务报告的真实、完整。
§2 公司基本情况2.1 主要会计数据及财务指标单位:元本报告期末上年度期末增减变动(%)总资产(元)1,461,450,018.031,451,667,225.56 0.67%归属于上市公司股东的所有者权益(元)214,892,357.29225,778,093.67 -4.82%股本(股)220,901,184.00220,901,184.00归属于上市公司股东的每股净资产(元/股)0.97 1.02 -4.90%本报告期上年同期增减变动(%)营业总收入(元)2,549,889.363,724,315.37 -31.53%归属于上市公司股东的净利润(元)-10,885,736.389,012,240.22 -220.79%经营活动产生的现金流量净额(元)29,071,436.22-7,602,576.75 482.39%每股经营活动产生的现金流量净额(元/股)0.13-0.03 533.33%基本每股收益(元/股)-0.050.04 -225.00%稀释每股收益(元/股)-0.050.04 -225.00%加权平均净资产收益率(%)-4.87% 3.95% -8.82%扣除非经常性损益后的加权平均净资产收益率(%)-4.05%-1.89% -2.16%非经常性损益项目年初至报告期期末金额对外委托贷款取得的损益-3,596,088.94合计-3,596,088.94对重要非经常性损益项目的说明项目借款违约金2.2 报告期末股东总人数及前十名无限售条件股东持股情况表单位:股报告期末股东总数(户)21,415前十名无限售条件流通股股东持股情况股东名称(全称)期末持有无限售条件流通股的数量种类百利亚太投资有限公司30,264,192境内上市外资股深圳市特发集团有限公司21,566,857人民币普通股第一上海证券有限公司16,473,541境内上市外资股深圳茂业商厦有限公司13,577,548人民币普通股F.C. (ASIA) HOLDINGS SDN. BHD. 8,215,594境内上市外资股深圳市泰天实业发展有限公司5,816,012人民币普通股方瑞萍2,534,800人民币普通股陈少兰2,528,341人民币普通股陈述2,149,327人民币普通股曾海星2,148,715人民币普通股§3 重要事项3.1 公司主要会计报表项目、财务指标大幅度变动的情况及原因√适用□不适用(1)长期借款:本期较去年年末减少83%,主要系本年贷款到期金额增加,长期借款减少导致。
无锡小天鹅股份有限公司2010年第一季度季度报告全文§1 重要提示1.1 本公司董事会、监事会及董事、监事、高级管理人员保证本报告所载资料不存在任何虚假记载、误导性陈述或者重大遗漏,并对其内容的真实性、准确性和完整性负个别及连带责任。
1.2 公司第一季度财务报告未经会计师事务所审计。
1.3 公司负责人方洪波先生、主管会计工作负责人马俊霞女士及会计机构负责人(会计主管人员)曾睿先生声明:保证季度报告中财务报告的真实、完整。
§2 公司基本情况2.1 主要会计数据及财务指标单位:元本报告期末上年度期末增减变动(%)总资产(元)4,533,423,236.453,878,629,773.92 16.88%归属于上市公司股东的所有者权益(元)1,933,268,337.261,854,911,284.10 4.22%股本(股)547,655,760.00547,655,760.00 0.00%归属于上市公司股东的每股净资产(元/股) 3.53 3.39 4.13%本报告期上年同期增减变动(%)营业总收入(元)1,662,106,246.14974,105,929.15 70.63%归属于上市公司股东的净利润(元)78,261,091.5643,639,765.07 79.33%经营活动产生的现金流量净额(元)-386,451,128.5424,940,968.36 -1,649.46%每股经营活动产生的现金流量净额(元/股)-0.710.05 -1,520.00%基本每股收益(元/股)0.140.08 75.00%稀释每股收益(元/股)0.140.08 75.00%加权平均净资产收益率(%) 4.13% 2.68% 1.45%扣除非经常性损益后的加权平均净资产收益4.16% 1.87% 2.29%率(%)非经常性损益项目年初至报告期期末金额非流动资产处置损益-845,279.21计入当期损益的政府补助,但与公司正常经营业务密切相关,符合国家政策规定、按照一定标准938,559.42定额或定量持续享受的政府补助除外除同公司正常经营业务相关的有效套期保值业务外,持有交易性金融资产、交易性金融负债产生95,961.60的公允价值变动损益,以及处置交易性金融资产、交易性金融负债和可供出售金融资产取得的投资收益除上述各项之外的其他营业外收入和支出-954,987.56所得税影响额123,133.52少数股东权益影响额87,062.77合计-555,549.46对重要非经常性损益项目的说明2.2 报告期末股东总人数及前十名无限售条件股东持股情况表单位:股报告期末股东总数(户)27,373前十名无限售条件流通股股东持股情况股东名称(全称)期末持有无限售条件流通股的数量种类广东美的电器股份有限公司131,510,011人民币普通股GAOLING FUND,L.P. 41,602,180境内上市外资股TITONI INVESTMENTS DEVELOPMENT30,851,714境内上市外资股LTD.无锡市财政局22,057,657人民币普通股中国工商银行-鹏华优质治理股票型证券投15,217,658人民币普通股资基金(LOF)BOCI SECURITIES LIMITED 14,923,844境内上市外资股中国工商银行-南方绩优成长股票型证券投6,203,619人民币普通股资基金招商证券香港有限公司5,725,361境内上市外资股中国工商银行-东吴嘉禾优势精选混合型开5,498,622人民币普通股放式证券投资基金中国建设银行-国泰金鼎价值精选混合型证5,485,636人民币普通股券投资基金§3 重要事项3.1 公司主要会计报表项目、财务指标大幅度变动的情况及原因单位:元√适用□不适用序号 指标项目 本期数 年初数 变动率1 货币资金 456,333,704.60852,448,970.81 -46.47%2 应收票据 1,753,170,705.11604,499,731.15 190.02%3 应收账款 612,846,478.95874,635,649.01 -29.93%4 预付账款 141,887,489.3466,243,273.07 114.19%5 可供出售金融资产 425,712.00312,816.00 36.09%6 在建工程 13,750,456.0223,101,817.68 -40.48%7 长期待摊费用 23,830,162.0316,773,746.67 42.07%8 短期借款 -1,000,000.00 -100.00%9 应付票据 165,336,799.5514,000,000.00 1080.98%10 应交税费 53,286,883.29116,221,316.66 -54.15%11 递延所得税负债 48,811.8031,877.40 53.12%12 其他非流动负债 5,338,900.003,679,000.00 45.12%序号 指标项目 本期数 去年同期 变动率13 营业收入 1,662,106,246.14974,105,929.15 70.63%14 营业税金及附加 5,091,868.017,247,483.23 -29.74%15 管理费用 77,055,101.3840,946,880.74 88.18%16 财务费用 -1,171,952.69749,646.93 -256.33%17 资产减值损失 -13,083,139.6862,240.73 -21120.22%18 投资收益 1,289,048.9511,055,072.87 -88.34%19 营业利润 100,560,926.3529,854,931.59 236.83%20 营业外收入 2,753,456.8316,751,638.84 -83.56%21 利润总额 99,926,719.0043,957,477.67 127.33%22 所得税费用 15,210,768.878,088,837.93 88.05%23 少数股东损益 6,454,858.57-7,771,125.33 -183.06%24 经营活动产生的现金流量净额 -386,451,128.5424,940,968.36 -1649.46%25 投资活动产生的现金流量净额 -8,447,650.17-3,361,083.63 151.34%26 筹资活动产生的现金流量净额 -1,216,487.50-1,793,422.67 -32.17%27 现金及现金等价物的增加 -396,115,266.2119,786,462.06 -2101.95%1、受金融市场宏观政策变化影响,现汇收款减少,银行承兑汇票收款增加。
2010年一季度经济形势分析与全年展望当前,经济运行的基本矛盾集中表现为内、外需求持续增长的基础尚不稳固,以及资产价格泡沫正在集聚和输入型通胀因素加重。
为此,宏观经济政策需要在保持经济平稳较快发展和防泡沫、抑通胀之间取得平衡。
在财政支出增速大幅度下降的情况下,应继续实施适度宽松的货币政策,积极扩大内需,努力稳定出口增长。
根据经济增速回调状况和通胀压力,适时调整政策力度,增强灵活性,并加快推进关键领域改革、结构调整和发展方式转变。
今年一季度,我国经济增长继续保持了2009年二季度以来的持续回升态势,但投资增速下降、贸易顺差收缩和“招工难”蔓延等新情况、新问题值得关注。
受投资增速回调和出口波动的影响,进入二季度以后经济增长面临的下行压力明显增强。
同时,资产价格泡沫正在集聚,输入型通胀因素加重。
宏观经济政策需要在保持经济平稳较快发展和防泡沫、抑通胀之间取得平衡,根据经济增速回调状况和通胀压力适时调整,增强灵活性,并加快推进关键领域改革、结构调整和发展方式转变,为中长期经济平稳较快发展奠定良好基础。
一、经济增长下行压力加大,“招工难”影响深远投资增长大幅度回落,财政、货币政策扩张力度明显收缩,对投资的刺激作用逐步消释;贸易顺差进一步收缩,目前我国进出口贸易的快速增长存在不稳定性;“招工难”再度显现,农业劳动力转移面临新困难,对依靠低成本优势的劳动密集型、出口导向型企业将构成巨大生存压力。
由于外部环境改善,出口增长达到较高水平,国内消费需求平稳增长,再加上去年同期基数较低,今年一季度经济增长将达到近期新高。
但是,投资增长大幅度回落,贸易顺差进一步收缩,经济增长面临的下行压力明显增强。
同时,“招工难”反映了我国劳动力供求关系的趋势性变化,对经济社会发展具有深远的影响。
(一)投资增长大幅度回落今年1—2月份,城镇固定资产投资增长26.6%,比2009年全年增速(30.5%)下降3.9个百分点。
扣除生产资料出厂价格因素之后,1—2月份,城镇固定资产投资实际增速仅为19.33%,比2009年全年实际增速(40.45%)下降21.12个百分点。
英利绿色能源公布2010年第一季度业绩报告。
第一季度,公司销售收入为24.499亿人民币(约合3.589亿美元),毛利润为8.154亿人民币(约合1.195亿美元),净收入为1.909亿人民币(约合2800万美元),每股净利润为1.24元人民币(约合0.18美元)。
公司同时预计,其今年太阳能组件销售量将达到950至1000兆瓦。
Yingli Green Energy Holding Company Limited today announced its unaudited consolidated financial results for the first quarter ended March 31, 2010.First Quarter 2010 Consolidated Financial and Operating Highlights-- Total net revenues were RMB 2,449.9 million (US$358.9 million).-- Gross profit was RMB 815.4 million (US$119.5 million) and gross margin was 33.3%.-- Operating income was RMB 535.9 million (US$78.5 million) and operatingmargin was 21.9%.-- Net income (1) was RMB 190.9 million (US$28.0 million) and dilutedearnings per ordinary share and per American depositary share ("ADS") was RMB 1.24 (US$0.18).-- On an adjusted non-GAAP (2) basis, net income was RMB 246.8 million(US$36.2 million) and diluted earnings per ordinary share and per ADSwas RMB 1.60 (US$0.23).-- Actual output of existing 600 MW vertically integrated production capacity was nearly 30% higher than nameplate capacity.Mr. Liansheng Miao, Chairman and CEO of Yingli Green Energy, commented, "We are pleased to announce that our first quarter gross margin reached a record high of 33.3%, as we continued to focus on balancing profitability with market share expansion. Driving this performance, our PV module shipment volume grew significantly year-over-year and remained stable quarter-over-quarter despite seasonality. We attribute these achievements primarily to Yingli's industry-leading brand recognition and cost advantage, and our vigorous sales and marketing efforts, including our sponsorship of the 2010 FIFA World Cup South Africa (TM), which has helped us diversify our customer portfolio across different regions."We achieved close to 130% capacity utilization for our existing 600 MW capacity in the first quarter through our long-term efforts to improve operating efficiency and cell conversion efficiency, while remaining focused on our strategic capacity expansion plans to satisfy unmet demand across key markets. We now expect to bring the 300 MW PANDA mono-crystalline silicon based production capacity at our Baoding headquarters and the 100 MW multi-crystalline silicon based production capacity in Hainan Province on-line in the third quarter of this year. And we are pleased to announce that our new PANDA module will be introduced during the 2010 Intersolar Trade Show in Munich, Germany this June,one of the biggest industry exhibitions. In addition, our in-house polysilicon plant Fine Silicon is in the final stage of the segment trial process and we are confident in our goal of beginning fully integrated production in mid-2010 as originally scheduled."Looking ahead, to strengthen our leadership in the global solar market we will continue to focus on improving cell efficiency and yield rates across the integrated value chain while reducing costs, increasing the diversity of our customer base, securing new long-term and strategic partnerships, strengthening our risk control capabilities across different regions and assuring the quality of our products by cooperating with leading partners such as TUV Rheinland. With a strong quarter behind us and solid strategies in place, we look forward to driving continued healthy growth in the future."First Quarter 2010 Financial ResultsTotal Net RevenuesTotal net revenues were RMB 2,449.9 million (US$358.9 million) in the first quarter of 2010, a slight decrease of 3.2% from RMB 2,530.9 million in the fourth quarter of 2009 and an increase of 145.0% from RMB 999.9 million in the first quarter of 2009. The slight decrease in total net revenues from the fourth quarter of 2009 was primarily due to the depreciation of the euro against the Renminbi, partially offset by the slight improvement of selling prices in original currencies. PV module shipment volume was flattish compared to last quarter.Gross Profit and Gross Margin (3)Gross profit in the first quarter of 2010 was RMB 815.4 million (US$119.5 million), an increase of 8.7% from RMB 750.4 million in the fourth quarter of 2009 and 387.3% from RMB 167.4 million in the first quarter of 2009. Gross margin was 33.3% in the first quarter of 2010, up from 29.6% in the fourth quarter of 2009 and 16.7% in the first quarter of 2009. The increase in gross margin was primarily due to the continuous decline in the blended cost of polysilicon, decreasing polysilicon usage per watt and continuous reduction in non-polysilicon cost.Operating Expenses (3), (4)Operating expenses in the first quarter of 2010 were RMB 279.5 million (US$40.9 million), compared to RMB 784.8 million in the fourth quarter of 2009 and RMB 147.0 million in the first quarter of 2009. The higher operating expense in the fourth quarter of 2009 was primarily attributable to a non-cash impairment of intangible assets and a non-cash bad debt expense of RMB 461.0 million, which did not recur in the first quarter of 2010. Operating expense as a percentage of total net revenues was 11.4% in the first quarter of 2010, down from 12.8% in the fourth quarter of 2009 after excluding the two non-cash charges in the fourth quarter of 2009.During the course of the preparation of the Company's 2009 annual report, one of its customers failed to perform its obligations under contractual arrangements it had entered into with the Company regarding certain accounts receivable outstanding as of December 31, 2009. The Company is currently seeking legal advice on its options to recover the account receivables. A non-cash bad debt expense was recognized in the fourth quarter 2009 to provide a partial provision for the outstanding accounts receivable. As a prudent measure, the Company has provided an additional non-cash bad debt provision of RMB 145.5 million to cover the full amount of the outstanding accounts receivable for the fourth quarter and full year 2009, which was offset by adjusted income tax benefit and earnings attributable to the noncontrolling interests for these two periods. As a result, net loss for the fourth quarter and full year 2009 increased by RMB 61.9 million. The impact of this additional non-cash debt expense on the full year 2009 will be fully reflected in the Company's annual report for 2009. This provision will be reversed in subsequent financial statements if the Company can recover a portion of the outstanding accounts receivable from this customer.Operating Income (Loss) and Margin (4)Operating income in the first quarter of 2010 was RMB 535.9 million (US$78.5 million), a substantial increase from an operating loss of RMB 34.4 million in the fourth quarter of 2009 and an operating income of RMB 20.4 million in the first quarter of 2009.Operating margin was 21.9% in the first quarter of 2010, compared to a negative operating margin of 1.4% in the fourth quarter of 2009 and 2.0% in the first quarter of 2009. The significant increase in operating margin was mainly due to increased gross margin and decreased operating expenses as a percentage of net revenues.Interest ExpenseInterest expense was RMB 91.2 million (US$13.4 million) in the first quarter of 2010, compared to RMB 80.8 million in the fourth quarter of 2009 and RMB 79.0 million in the first quarter of 2009. The increase in interest expense was consistent with the increase in short-term borrowings from RMB 3,501.0 million as of December 31, 2009 to RMB 3,993.3 million (US$585.0 million) as of March 31, 2010.After excluding non-cash interest expenses, interest expense was RMB 63.4 million (US$9.3 million) in the first quarter of 2010, compared to RMB 58.7 million in the fourth quarter of 2009 and RMB 72.2 million in the first quarter of 2009. The weighted average interest rate for the borrowings in the first quarter of 2010 was 6.43%, an increase from 6.27% in the fourth quarter of 2009, both measured on a basis excluding non-cash interest expenses.Foreign Currency Exchange LossForeign currency exchange loss was RMB 169.1 million (US$24.8 million) in the first quarter of 2010, compared to foreign currency exchange losses of RMB 48.5 million in the fourth quarter of 2009 and RMB 93.6 million in the first quarter of 2009. The foreign currency exchange loss in the first quarter of 2010 was primarily due to the depreciation of the euro against the Renminbi.Income Tax Expense (Benefit) (4)Income tax expense was RMB 39.5 million (US$5.8 million) in the first quarter of 2010, compared to income tax benefit of RMB 63.0 million in the fourth quarter of 2009 and RMB 13.0 million in the first quarter of 2009. The income tax expense in the first quarter of 2010 was primarily due to the net operating income generated by Tianwei Yingli and Yingli Energy (China) Company Limited ("Yingli China") in this quarter. Under the PRC Enterprise Income Tax Law and the various implementation rules, Tianwei Yingli was subject to an enterprise income tax rate of 12.5% in both 2009 and 2010, and Yingli China was subject to an enterprise income tax rate of 15% in both 2009 and 2010.Net Income (Loss) (4)As a result of the factors discussed above, net income was RMB 190.9 million (US$28.0 million) in the first quarter of 2010, compared to a net loss of RMB 106.7 million in the fourth quarter of 2009 and a net loss of RMB 141.6 million in the first quarter of 2009. Diluted earnings per ordinary share and per ADS was RMB 1.24(US$0.18) in the first quarter of 2010, compared to diluted loss per ordinary share and per ADS of RMB 0.72 in the fourth quarter of 2009 and diluted loss per ordinary share and per ADS of RMB 1.11 in the first quarter of 2009.On an adjusted non-GAAP basis, net income was RMB 246.8 million (US$36.2 million) in the first quarter of 2010, compared to a net income of RMB 75.7 million in the fourth quarter of 2009 and a net loss of RMB 77.1 million in the first quarter of 2009. Adjusted non-GAAP diluted earnings per ordinary share and per ADS were RMB 1.60(US$0.23) in the first quarter of 2010, compared to a non-GAAP diluted earnings per ordinary share and per ADS of RMB 0.49 in the fourth quarter of 2009 and a non-GAAP diluted loss per ordinary share and per ADS of RMB 0.61 in the first quarter of 2009.On an adjusted non-GAAP basis and, if the Company excludes the foreign currency exchange loss, net income was RMB 415.9 million (US$60.9 million) in the first quarter of 2010, compared to a net income of RMB 124.1 million in the fourth quarter of 2009 and a net income of RMB 16.5 million in the first quarter of 2009. Adjusted non-GAAP diluted earnings per ordinary share and per ADS excluding foreign exchange loss were RMB 2.70(US$0.40) in the first quarter of 2010, compared to a non-GAAP diluted earnings per ordinary share and per ADS excluding foreign exchange loss of RMB 0.80 in the fourth quarter of 2009 and a non-GAAP diluted earnings per ordinary share and per ADS excluding foreign exchange loss of RMB 0.13 in the first quarter of 2009.Balance Sheet AnalysisAs of March 31, 2010, Yingli Green Energy had RMB 4,355.6 million (US$638.1 million) in cash and restricted cash, compared to RMB 3,631.1 million as of December 31, 2009. The increase in cash and restricted cash was primarily a result of positive operating cash flow resulting from the improved collection of accounts receivables and payment control.Working capital was RMB 675.4 million (US$99.0 million) as of March 31, 2010, compared to RMB 1,031.3 million as of December 31, 2009.As of the date of this press release, the Company had approximately RMB 10,207 million in authorized lines of credit, of which RMB 4,230 million had not been utilized.Business Outlook for Full Year 2010Based on current market and operating conditions, estimated production capacity and forecasted customer demand, the Company reaffirms its PV module shipment target to be in the estimated range of 950 MW to 1 GW for fiscal year 2010, which represents an increase of 80.8% to 90.4% compared to fiscal year 2009.In addition, after taking into consideration the Company's estimated blended cost of polysilicon in 2010, the expected average selling price of PV modules and forecasted exchange rates of the euro and U.S. dollar against the Renminbi, the Company also reaffirms its gross margin target for fiscal year 2010 to be in the estimated range of 27% to 29%.。
2010年一季度财政收支情况分析一、今年一季度收支完成总体情况今年一季度我区累计完成一般预算收入10.09亿元,比去年同期增加3.7亿元,增长58%,完成年度预算的27.08%;完成财政总收入38.24亿元(其中:国有土地出让金收益20.8亿元),同比增加5.8亿元,增长50.46%。
3月份当月完成情况:本月完成一般预算收入3.13亿元,比去年同期增加1.18亿元,增长60.6%。
完成财政总收入17.33亿元(其中:国有土地出让金收益11.43亿元),剔除不可比因素增加2.1亿元,增长56.01%。
分部门一般预算收入完成情况:一季度,国税部门完成1.99亿元,比去年同期增长84.8%;地税部门完成6.77亿元,比上年同期增长50.7%;财政部门完成1.33亿元(其中契税收入完成9237 万元,比去年同期增长39.3%),比去年同期增长62.8%。
一般预算收入增幅全市情况:1-3月份全市一般预算收入平均增幅41.1%,市区(含市本级)平均增幅39.3%,其他各区一般预算收入累计增幅情况是:港闸区62.9%,通州区40.1%,经济技术开发区39%,截止到一季度末我区一般预算收入增幅高于全市及市区平均增幅,但低于港闸区约5个百分点。
支出基本情况:一季度全区决算支出239441万元,其中一般预算支出31607万元,占年初预算30.4%,比去年同期增加5044万元,增长19%。
其中区本级支出28571万元,比上年增加4228万元,增长17.4%。
基金预算支出207834万元,主要是国有土地使用权出让金全额纳入预算管理支出207572万元。
二、全区收支主要特点及增减因素分析(一)财政收入总体保持高幅增长。
今年一季度,随着经济的复苏,我区收入实现恢复性增长,与去年同期相比增幅较高,一般预算收入增幅1月份为93.5%、2月份为56.9%、3月份为58%,收入增幅在高位运行,为近几年来第一季度增幅之最,其主要原因:一是去年受金融危机影响同期基数较低,去年1-3月份收入增幅分别为-14.2%、12.6%、-30.4%。