matlab基本语句.
- 格式:pdf
- 大小:130.91 KB
- 文档页数:10
matlab常用指令MATLAB是一款非常实用的科学计算软件,在使用过程中,一些常用的指令是非常必要的。
在本篇文章中,我们将会介绍MATLAB常用指令,以使你更加熟练掌握MATLAB的使用。
一、基本数学运算+ 加- 减* 乘/ 除^ 幂(指数)sqrt 平方根exp 取指数log 取自然对数log10 取以10为底的对数sin 正弦cos 余弦tan 正切asin 反正弦acos 反余弦atan 反正切abs 绝对值rem 模运算fix 向零取整floor 向负无穷取整ceil 向正无穷取整round 四舍五入mod 取摸余数二、变量与矩阵1、赋值:通过等号将数值赋给变量,如:a=3;b=2.1;c=2+3i;2、数列:建立一个等差数组,例如:d=1:10; %1到10的等差数列e=linspace(0,2*pi,100); %0到2*pi之间的100个等间距点 a=[1 2 3;4 5 6;7 8 9];b=zeros(2,3);c=ones(3,2);d=rand(3,3);e=eye(4);4、矩阵元素操作:通过下标访问矩阵中的元素,例如:a(1,2) %输出a矩阵第一行第二列的元素b(2,3)=7 %将b矩阵第二行第三列的元素赋为75、矩阵运算:矩阵加减乘除,如:a+b %对应元素相加a-b %对应元素相减a*b %矩阵乘法a/b %矩阵除法a' %矩阵转置6、矩阵函数:除了使用基本操作外,还能使用各种矩阵相关函数完成矩阵计算,例如:inv(a) %矩阵求逆det(a) %矩阵求行列式trace(a) %矩阵求迹eig(a) %求特征值rank(a) %矩阵的秩size(a) %返回矩阵的大小max(a) %求矩阵元素最大值min(a) %求矩阵元素最小值sum(a) %求矩阵元素的和prod(a) %求矩阵所有元素的乘积mean(a) %求矩阵元素的平均值三、绘图1、二维绘图:绘制二维函数的曲线、散点图等,例如:x=linspace(-3,3,100); %生成-3到3之间的100个等间距点y=sin(x);plot(x,y); %绘制正弦函数曲线plot(x,y,'r--'); %绘制红色的正弦函数曲线,形状为虚线xlabel('x values');ylabel('y values');title('sine function');grid on;四、数据处理1、数据导入:在MATLAB中,可以通过各种方式将数据导入,如:a=load('filename.txt'); %从文件中载入数据b=xlsread('filename.xls'); %从Excel文件中载入数据五、编程1、条件语句:通过条件语句实现程序的分支结构,例如:if(a<0)disp('a is negative');elseif(a==0)disp('a is zero');elsedisp('a is positive');endfor i=1:10disp(i);end3、函数:在MATLAB中,可以自定义函数,函数调用格式为:function [out1,out2,...]=function_name(in1,in2,...)%函数说明%计算过程end4、脚本:在MATLAB中,脚本是一些命令或函数的集合,可以将脚本保存到文件中执行,例如:%脚本说明a=1;b=2;c=a+b;disp(c);以上便是MATLAB一些常用指令的详细介绍。
matlab m 编程语言Matlab M编程语言是一种高级的数值计算和编程环境,其提供了丰富的函数和工具箱,用于科学计算、数据分析、图像处理等各个领域。
本文将介绍Matlab M编程语言的基本语法和常用功能。
一、基本语法Matlab M编程语言的基本语法类似于其他编程语言,包括变量的定义和赋值、条件语句、循环语句等。
下面以一个简单的例子来说明基本语法:```matlab% 定义变量a = 10;b = 20;% 条件语句if a > bdisp('a大于b');elseif a < bdisp('a小于b');elsedisp('a等于b');end% 循环语句for i = 1:5disp(i);end```二、常用函数和工具箱Matlab M编程语言提供了丰富的函数和工具箱,用于各种科学计算和数据处理任务。
下面列举一些常用的函数和工具箱:1. 统计工具箱:用于统计分析和数据建模,包括描述统计、假设检验、回归分析等功能。
2. 图像处理工具箱:用于图像处理和计算机视觉任务,包括图像滤波、边缘检测、图像分割等功能。
3. 信号处理工具箱:用于信号处理和数字信号处理任务,包括滤波、频谱分析、时频分析等功能。
4. 控制系统工具箱:用于控制系统分析和设计,包括传递函数表示、稳定性分析、控制器设计等功能。
5. 优化工具箱:用于优化问题的建模和求解,包括线性规划、非线性规划、整数规划等功能。
三、应用实例Matlab M编程语言在科学计算和工程应用中有广泛的应用。
下面举两个实际应用的例子:1. 图像处理:利用Matlab M编程语言中的图像处理工具箱,可以对图像进行各种处理和分析。
例如,可以对医学影像进行图像增强,提取感兴趣区域,进行图像分割等操作。
2. 机器学习:Matlab M编程语言提供了丰富的机器学习工具箱,可以用于分类、聚类、回归等任务。
例如,可以利用支持向量机对数据进行分类,利用神经网络进行回归分析等。
matlab条件语句Matlab一种数学软件,常用于数值计算、可视化和编程。
它是一个功能强大的工具,可以帮助从事数学、工程和科学领域的研究人员进行分析。
Matlab 中的条件语句是一种语句,可以为程序提供灵活性和控制,可以根据需要执行代码块。
Matlab 中有三种基本条件语句:if-else,switch-casetry-catch。
这些条件语句允许程序员构建复杂的程序,以便在不同情况下执行不同代码。
if句是 Matlab 中最常用的一种条件语句,它的语法如下:if件一组 Matlab句endif-else句允许程序员在特定条件下执行特定的Matlab句。
它的语法如下:if件一组 Matlab句else一组其他 Matlab句endswitch-case句是另一种复杂条件语句,它允许程序员指定不同的代码块,根据不同的情况来执行它们,这种情况可以是字符串、数字或别的变量类型。
它的语法如下:switch件case1一组 Matlab句case2一组 Matlab句casen一组 Matlab句end最后,Matlab持一种异常处理语句,即 try-catch。
这种语句允许程序员在程序运行过程中捕获并处理错误。
它的语法如下:try一组 Matlab句catch一组 Matlab句end使用 Matlab 中的条件语句可以提高程序的效能和灵活性,使我们能够在不同的情况下执行不同的代码段,实现更强大的功能。
条件语句可以使程序更容易维护,更易于理解和调试。
Matlab一种强大的数学软件,灵活的条件语句可以使程序更具灵活性和可扩展性。
学习使用 Matlab条件语句可以让程序员更有效地完成自己的工作。
分享我的分享当前分享返回分享首页»分享matlab命令,应该很全了!来源:李家叶的日志matlab命令一、常用对象操作:除了一般windows窗口的常用功能键外。
1、!dir 可以查看当前工作目录的文件。
!dir& 可以在dos状态下查看。
2、who 可以查看当前工作空间变量名,whos 可以查看变量名细节。
3、功能键:功能键快捷键说明方向上键Ctrl+P 返回前一行输入方向下键Ctrl+N 返回下一行输入方向左键Ctrl+B 光标向后移一个字符方向右键Ctrl+F 光标向前移一个字符Ctrl+方向右键Ctrl+R 光标向右移一个字符Ctrl+方向左键Ctrl+L 光标向左移一个字符home Ctrl+A 光标移到行首End Ctrl+E 光标移到行尾Esc Ctrl+U 清除一行Del Ctrl+D 清除光标所在的字符Backspace Ctrl+H 删除光标前一个字符Ctrl+K 删除到行尾Ctrl+C 中断正在执行的命令4、clc可以命令窗口显示的内容,但并不清除工作空间。
二、函数及运算1、运算符:+:加,-:减,*:乘,/:除,\:左除^:幂,‘:复数的共轭转置,():制定运算顺序。
2、常用函数表:sin( ) 正弦(变量为弧度)Cot( ) 余切(变量为弧度)sind( ) 正弦(变量为度数)Cotd( ) 余切(变量为度数)asin( ) 反正弦(返回弧度)acot( ) 反余切(返回弧度)Asind( ) 反正弦(返回度数)acotd( ) 反余切(返回度数)cos( ) 余弦(变量为弧度)exp( ) 指数cosd( ) 余弦(变量为度数)log( ) 对数acos( ) 余正弦(返回弧度)log10( ) 以10为底对数acosd( ) 余正弦(返回度数)sqrt( ) 开方tan( ) 正切(变量为弧度)realsqrt( ) 返回非负根tand( ) 正切(变量为度数)abs( ) 取绝对值atan( ) 反正切(返回弧度)angle( ) 返回复数的相位角atand( ) 反正切(返回度数)mod(x,y) 返回x/y的余数sum( ) 向量元素求和3、其余函数可以用help elfun和help specfun命令获得。
matlab基本语句及语法一、基本语法1. 变量定义与赋值:在MATLAB中,可以使用等号(=)将一个数值或表达式赋值给一个变量。
例如:a = 5; 表示将数值5赋值给变量a。
2. 注释:在MATLAB中,可以使用百分号(%)来添加注释,以便于代码的阅读和理解。
例如:% 这是一条注释。
3. 函数的定义与调用:在MATLAB中,可以使用关键字function 来定义函数,并使用函数名进行调用。
例如:function result = add(a, b) 表示定义了一个名为add的函数,该函数接受两个参数a 和b,并返回一个结果result。
4. 条件语句:在MATLAB中,可以使用if语句来实现条件判断。
例如:if a > b 表示如果a大于b,则执行if语句块中的代码。
5. 循环语句:在MATLAB中,可以使用for循环和while循环来实现循环操作。
例如:for i = 1:10 表示从1循环到10,每次循环中i 的值递增1。
6. 矩阵的定义与操作:在MATLAB中,可以使用方括号([])来定义矩阵,并使用各种运算符进行矩阵的操作。
例如:A = [1 2; 3 4] 表示定义了一个2x2的矩阵A。
7. 字符串的操作:在MATLAB中,可以使用单引号('')来定义字符串,并使用加号(+)来进行字符串的拼接。
例如:str = 'Hello' + 'World' 表示将字符串'Hello'和'World'进行拼接。
8. 文件的读写:在MATLAB中,可以使用fopen、fread、fwrite 等函数来进行文件的读写操作。
例如:fid = fopen('file.txt', 'w') 表示打开一个名为file.txt的文件,并以写入模式打开。
9. 图形绘制:在MATLAB中,可以使用plot、scatter、histogram等函数来进行图形的绘制。
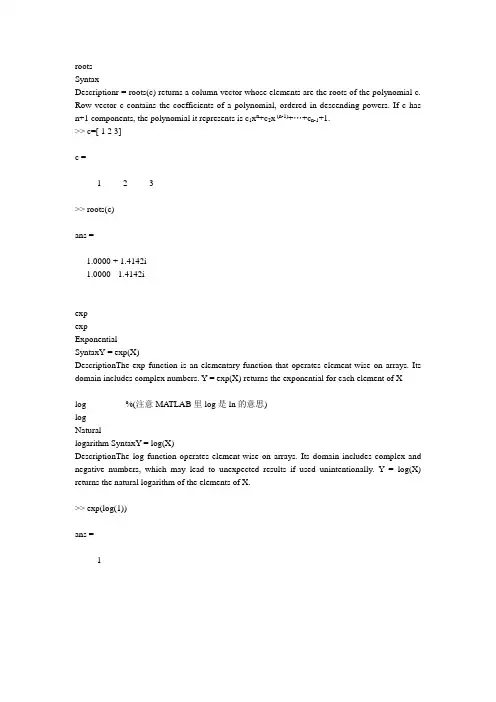
rootsSyntaxDescriptionr = roots(c) returns a column vector whose elements are the roots of the polynomial c. Row vector c contains the coefficients of a polynomial, ordered in descending powers. If c has n+1 components, the polynomial it represents is c1x n+c2x (n-1)+…+c n-1+1.>> c=[ 1 2 3]c =1 2 3>> roots(c)ans =-1.0000 + 1.4142i-1.0000 - 1.4142iexpexpExponentialSyntaxY = exp(X)DescriptionThe exp function is an elementary function that operates element-wise on arrays. Its domain includes complex numbers. Y = exp(X) returns the exponential for each element of Xlog %(注意MA TLAB里log是ln的意思)logNaturallogarithm SyntaxY = log(X)DescriptionThe log function operates element-wise on arrays. Its domain includes complex and negative numbers, which may lead to unexpected results if used unintentionally. Y = log(X) returns the natural logarithm of the elements of X.>> exp(log(1))ans =1反三角函数asinacosnorm 求向量的模或矩阵的范数Vector and matrix normsSyntaxn = norm(A)n = norm(A,p)DescriptionThe norm of a matrix is a scalar that gives some measure of the magnitude of the elements of the matrix.The norm function calculates several different types of matrix norms:n = norm(A) returns the largest singular value of A, max(svd(A)).n = norm(A,p) returns a different kind of norm, depending on the value of p.RemarksNote that norm(x) is the Euclidean length of a vector x. On the other hand, MATLAB uses "length" to denote the number of elements n in a vector. This example uses norm(x)/sqrt(n) to obtain the root-mean-square (RMS) value of an n-element vector x. x = [0 1 2 3]x =0 1 2 3sqrt(0+1+4+9) % Euclidean lengthans =3.7417norm(x)ans =3.7417n = length(x) % Number of elementsn =4rms = 3.7417/2 % rms = norm(x)/sqrt(n)rms =1.8708axis 建立坐标系axis Axis scaling and appearanceSyntaxaxis([xmin xmax ymin ymax])axis([xmin xmax ymin ymax zmin zmax cmin cmax])v = axisaxis autoaxis manualaxis tightaxis fillaxis ijaxis xyaxis equalaxis imageaxis squareaxis vis3daxis normalaxis offaxis onaxis(axes_handles,...)[mode,visibility,direction] = axis('state')Descriptionaxis manipulates commonly used axes properties. (See Algorithm section.)axis([xmin xmax ymin ymax]) sets the limits for the x- and y-axis of the current axes.axis([xmin xmax ymin ymax zmin zmax cmin cmax]) sets the x-, y-, and z-axis limits and the color scaling limits (see caxis) of the current axes.v = axis returns a row vector containing scaling factors for the x-, y-, and z-axis. v has four or six components depending on whether the current axes is 2-D or 3-D, respectively. The returned values are the current axes' XLim, Ylim, and ZLim properties.axis auto sets MATLAB to its default behavior of computing the current axes' limits automatically, based on the minimum and maximum values of x, y, and z data. You can restrict this automaticbehavior to a specific axis. For example, axis 'auto x' computes only the x-axis limits automatically; axis 'auto yz' computes the y- and z-axis limits automatically.axis manual and axis(axis) freezes the scaling at the current limits, so that if hold is on, subsequent plots use the same limits. This sets the XLimMode, YLimMode, and ZLimMode properties to manual.axis tight sets the axis limits to the range of the data.axis fill sets the axis limits and PlotBoxAspectRatio so that the axes fill the position rectangle. This option has an effect only if PlotBoxAspectRatioMode or DataAspectRatioMode are manual. axis ij places the coordinate system origin in the upper-left corner. The i-axis is vertical, with values increasing from top to bottom. The j-axis is horizontal with values increasing from left to right.axis xy draws the graph in the default Cartesian axes format with the coordinate system origin in the lower-left corner. The x-axis is horizontal with values increasing from left to right. The y-axis is vertical with values increasing from bottom to top.axis equal sets the aspect ratio so that the data units are the same in every direction. The aspect ratio of the x-, y-, and z-axis is adjusted automatically according to the range of data units in the x, y, and z directions.axis image is the same as axis equal except that the plot box fits tightly around the data.axis square makes the current axes region square (or cubed when three-dimensional). MATLAB adjusts the x-axis, y-axis, and z-axis so that they have equal lengths and adjusts the increments between data units accordingly.axis vis3d freezes aspect ratio properties to enable rotation of 3-D objects and overrides stretch-to-fill.axis normal automatically adjusts the aspect ratio of the axes and the relative scaling of the data units so that the plot fits the figures shape as best as possible.axis off turns off all axis lines, tick marks, and labels.axis on turns on all axis lines, tick marks, and labels.axis(axes_handles,...) applies the axis command to the specified axes. For example, the following statements:h1 = subplot(221);h2 = subplot(222);axis([h1 h2],'square')set both axes to square. [mode,visibility,direction] = axis('state') returns three strings indicating the current setting of axes properties:magic() 幻方函数magicMagic squareSyntaxM = magic(n)DescriptionM = magic(n) returns an n-by-n matrix constructed from the integers 1 through n^2 with equal row and column sums. The order n must be a scalar greater than or equal to 3.RemarksA magic square, scaled by its magic sum, is doubly stochastic.ExamplesThe magic square of order 3 is M = magic(3)M =8 1 63 5 74 9 2This is called a magic square because the sum of the elements in each column is the same. sum(M) =15 15 15And the sum of the elements in each row, obtained by transposing twice, is the same. sum(M')' =151515This is also a special magic square because the diagonal elements have the same sum. sum(diag(M)) =15The value of the characteristic sum for a magic square of order n is sum(1:n^2)/nwhich, when n = 3, is 15.AlgorithmThere are three different algorithms: n odd n even but not divisible by four n divisible by four To make this apparent, typefor n = 3:20A = magic(n);r(n) = rank(A);endFor n odd, the rank of the magic square is n. For n divisible by 4, the rank is 3. For n even but not divisible by 4, the rank is n/2 + 2.[(3:20)',r(3:20)']ans =3 34 35 56 57 78 39 910 711 1112 313 1314 915 1516 317 1718 1119 1920 3Plotting A for n = 18, 19, 20 shows the characteristic plot for each category.eye 制作单位阵(?)eyeIdentity matrixSyntaxY = eye(n)Y = eye(m,n)Y = eye(size(A))DescriptionY = eye(n) returns the n-by-n identity matrix.Y = eye(m,n) or eye([m n]) returns an m-by-n matrix with 1's on the diagonal and 0's elsewhere. Y = eye(size(A)) returns an identity matrix the same size as A.LimitationsThe identity matrix is not defined for higher-dimensional arrays. The assignment y = eye([2,3,4]) results in an error.>> n=3;y = eye(n)y =1 0 00 1 00 0 1>> n=4;m=9;eye(n,m)ans =1 0 0 0 0 0 0 0 00 1 0 0 0 0 0 0 00 0 1 0 0 0 0 0 00 0 0 1 0 0 0 0 0>>zeros OzerosCreate an array of all zerosSyntaxB = zeros(n)B = zeros(m,n)B = zeros([m n])B = zeros(d1,d2,d3...)B = zeros([d1 d2 d3...])B = zeros(size(A))DescriptionB = zeros(n) returns an n-by-n matrix of zeros. An error message appears if n is not a scalar.B = zeros(m,n) or B = zeros([m n]) returns an m-by-n matrix of zeros.B = zeros(d1,d2,d3...) or B = zeros([d1 d2 d3...]) returns an array of zeros with dimensionsd1-by-d2-by-d3-by-... .B = zeros(size(A)) returns an array the same size as A consisting of all zeros.RemarksThe MATLAB language does not have a dimension statement; MATLAB automatically allocates storage for matrices. Nevertheless, for large matrices, MATLAB programs may execute faster if the zeros function is used to set aside storage for a matrix whose elements are to be generated one at a time, or a row or column at a time.For examplex = zeros(1,n);for i = 1:n, x(i) = i; endtriu 取下三角行列式Upper triangular part of a matrixSyntaxU = triu(X)U = triu(X,k)>> triu(ones(4,4),-1)ans =1 1 1 11 1 1 10 1 1 10 0 1 1>> triu(ones(4,4),1)ans =0 1 1 10 0 1 10 0 0 10 0 0 0>> triu(ones(4,4),0)ans =1 1 1 10 1 1 10 0 1 10 0 0 1A.’矩阵A的转置inv 对矩阵求逆invMatrix inverseSyntaxY = inv(X)DescriptionY = inv(X) returns the inverse of the square matrix X.A warning message is printed if X is badly scaled or nearly singular. In practice, it is seldom necessary to form the explicit inverse of a matrix.A frequent misuse of inv arises when solving the system of linear equations A x=b. One way to solve this is with x = inv(A)*b. A better way, from both an execution time and numerical accuracy standpoint, is to use the matrix division operator x = A\b. This produces the solution usingGaussian elimination, without forming the inverse. See \ and / for further information.例1-9画出函数y = x2cosx 与z = sinx / x 在区间[-6π,6π]上的图像。
matlab的输出语句在编程领域,Matlab是一个颇受欢迎的工具,用于数值计算、数据分析和算法开发。
作为一种高级编程语言,Matlab拥有丰富的功能和强大的输出语句,能够帮助开发者进行结果显示和调试。
本文将介绍Matlab中常用的输出语句,并探讨它们的灵活应用。
Matlab中最基本的输出语句是disp函数。
使用disp函数,我们可以将指定的文本或变量的值显示在Matlab命令窗口中。
例如,当需要输出一段提示文字时,可以调用disp函数,如下所示:```matlabdisp('Welcome to Matlab!');```这将在命令窗口中显示"Welcome to Matlab!"。
除了文本,我们还可以输出变量的值。
例如:```matlabx = 5;disp(x);```这将在命令窗口中显示变量x的值,即数字5。
除了disp函数,Matlab还提供了其他几种输出语句,如fprintf函数和sprintf函数。
这些函数允许我们根据需要格式化输出结果。
fprintf函数用于将格式化文本输出到文件或命令窗口。
它类似于C语言中的printf函数。
例如,我们可以使用fprintf函数将结果输出到文件中:```matlabfid = fopen('output.txt', 'w');fprintf(fid, 'The value of x is %d\n', x);fclose(fid);```这将在当前目录下创建一个名为output.txt的文件,并将内容输出为"The value of x is 5"。
注意,我们使用%d作为占位符,表示要替换为整数的值。
与fprintf函数类似,sprintf函数用于将格式化文本输出到字符串中,而不是文件。
这在需要将输出结果传递给其他函数或保存到变量中时非常有用。
MATLAB常⽤语句解释gcagca 是⽤来返回当前axes (坐标图)对象的句柄e.g.plot(rand(2,1)) % 正常的图set(gca,'xgrid','on') % gca表⽰当前的图,此时x轴添加了⽹格线set(gca,'ytick',[]) %删除当前图 y 轴刻度xlim,ylimx轴上下限设定xlim([a,b]);y轴上下限设定ylim([a,b])使⽤⽅法如下,xlim([XMIN XMAX]) % sets the x limits图像句柄h=plot(x,y);%h为图像句柄indexindex在matlab中没有特别的含义,既不是关键字也不是matlab⾃带函数的函数名。
通常⽤来定义⼀个数组的下标。
举例如下:index = 5; % 对变量index赋值5(matlab中变量的引⽤前不需要定义)a(index) = 0; % 对向量a的下标为index的元素赋值为0function [maxNum, minNum] = index(a, b) % 定义⼀个index函数,求最⼤最⼩值if a > bmaxNum = a;minNum = b;elsemaxNum = b;minNum = a;endceil(x)返回不⼩于x的最⼩整数值(然后转换为double型)。
floor(x)返回不⼤于x的最⼤整数值。
round(x)返回x的四舍五⼊整数值。
-------------------------------------------------------------------------------------------------------------------------------------num2str意思是把数字转为字符串strcat函数连接字符串的函数。
楼主写的命令意思是把变量名为name的字符串与数字'i'连接。
MATLAB操作命令大全1.基本操作:- clear: 清除工作区中的所有变量。
- clc: 清除命令窗口的内容。
- close all: 关闭所有图形窗口。
- help function-name: 显示与函数相关的帮助文档。
- who: 显示当前工作区中的所有变量。
- save file-name: 保存当前工作区中的所有变量到指定的文件。
- load file-name: 从文件中加载变量到当前工作区。
2.变量操作:-=:赋值操作符,将右边的值赋给左边的变量。
-+:加法操作符。
--:减法操作符。
-*:乘法操作符。
-/:除法操作符。
-^:幂运算操作符。
- sqrt(x): 计算 x 的平方根。
- abs(x): 计算 x 的绝对值。
- max(x): 返回 x 中的最大值。
- min(x): 返回 x 中的最小值。
- sum(x): 计算 x 中所有元素的和。
3.数组操作:- zeros(m, n): 创建一个 m 行 n 列的全零数组。
- ones(m, n): 创建一个 m 行 n 列的全一数组。
- eye(n): 创建一个 n 行 n 列的单位矩阵。
- size(x): 返回 x 的维度。
- length(x): 返回 x 的长度。
- reshape(x, m, n): 将 x 重新排列为一个 m 行 n 列矩阵。
- transpose(x): 将 x 的行和列互换。
4.控制流程:- if-else: 条件语句,根据条件执行不同的代码块。
- for loop: 循环语句,执行指定次数的代码块。
- while loop: 循环语句,根据条件反复执行代码块。
- break: 在循环中使用,用来跳出当前循环。
- continue: 在循环中使用,用来跳过当前循环的剩余部分。
5.统计分析:- mean(x): 计算 x 的平均值。
- median(x): 计算 x 的中位数。
- std(x): 计算 x 的标准差。
matlab基本语句及语法1. MATLAB是一种高级的数学计算软件,它支持多种编程语言和算法。
2. MATLAB的基本语句包括变量定义、赋值、运算符和函数调用等。
3. 变量定义可以使用字母、数字和下划线,但必须以字母开头。
4. 变量赋值可以使用等号或者箭头符号,例如a=5或者a->5。
5. 运算符包括算术运算符、比较运算符和逻辑运算符等。
6. 算术运算符包括加减乘除和幂等运算,例如+、-、*、/和^。
7. 比较运算符包括等于、不等于、大于、小于等,例如==、~=、>和<。
8. 逻辑运算符包括与、或和非等,例如&、|和~。
9. 函数调用可以直接使用函数名加参数列表的形式进行调用,例如sin(x)表示求正弦值。
10. MATLAB支持多种数据类型,包括数值型、字符型和逻辑型等。
11. 数值型数据可以分为整型和浮点型两种类型,分别用int8~int64和single/double表示。
12. 字符型数据可以使用单引号或双引号表示,例如'hello'或者"world"。
13. 逻辑型数据只有true/false两个值,用1/0表示。
14. MATLAB的程序结构包括脚本文件和函数文件两种类型。
15. 脚本文件是一系列命令的集合,可以直接在命令窗口中执行。
16. 函数文件是一个独立的代码块,可以被其他程序调用。
17. MATLAB的控制流语句包括if语句、for循环语句和while循环语句等。
18. if语句用于根据条件判断是否执行某段代码,例如if a>5, disp('a 大于5')。
19. for循环语句用于重复执行某段代码,例如for i=1:10, disp(i)。
20. while循环语句用于根据条件重复执行某段代码,例如while a<10, a=a+1;end。
第2章M ATLAB程序设计MATLAB语言为解释型程序设计语言。
在程序中可以出现顺序、选择、循环三种基本控制结构,也可以出现对M-文件的调用(相当于对外部过程的调用)。
由于 MATLAB开始是用FORTRAN语言编写、后来用 C语言重写的,故其既有FORTRAN的特征,又在许多语言规则方面与C语言相同。
2.1 顺序结构语句在顺序结构语句中,包括表达式语句、赋值语句、输入输出语句、空语句等。
2.1.1 表达式语句格式:表达式,%显示表达式值表达式;%不显示表达式值表达式%显示表达式值如:x + y,sin(x);–5最后的表达式值暂保存在变量ans中。
2.1.2 赋值语句格式:v =表达式,%结果送v并显示v v =表达式;%结果送v不显示v v =表达式%结果送v并显示v 2.1.3 空语句格式:,;2.1.4 输入语句1、input语句(实际上是函数)格式1:input(提示字符串)功能:显示提示字符串,可输入数字、字符串(两端用单引号括起)、或表达式格式2:input(提示字符串,'s')功能:显示提示字符串,并把输入视为字符串2、yesinput语句格式:yesinput(提示字符串,缺省值,值范围)功能:显示提示字符串和缺省值,若只打入回车则以缺省值作为输入值,若输入的值不在指定范围内则认为输入无效,B并等待用户重新输入。
如:t=yesinput('指定线的颜色',…'red','red|blue|green')运行结果如下:指定线的颜色(red):yellow %不在值内指定线的颜色(red):blue %重输t =bluex=yesinput('输入元素个数',10,[1,20])运行结果如下:输入元素个数(10):x =103、Keyboard语句格式:Keyboard功能:暂停M-文件的执行,并等待用户从键盘输入命令以查看或改变变量的值,直到输入return命令而返回相应的M-文件继续执行。
MATLAB命令汇总1.基本运算:-`+`:加法运算-`-`:减法运算-`*`:乘法运算-`/`:除法运算-`^`或`**`:幂运算- `sqrt(`: 平方根函数- `exp(`: 指数函数- `log(`: 对数函数2.矩阵和向量:- `zeros(`: 创建全零矩阵- `ones(`: 创建全一矩阵- `eye(`: 创建单位矩阵- `rand(`: 创建随机矩阵- `diag(`: 提取矩阵的对角线元素- `transpose(`或`'`: 转置矩阵- `det(`: 求矩阵的行列式- `inv(`: 求矩阵的逆矩阵- `trace(`: 求矩阵的迹3.数据处理和统计函数:- `mean(`: 求平均值- `median(`: 求中位数- `std(`: 求标准差- `var(`: 求方差- `sort(`: 排序- `histogram(`: 绘制直方图- `corrcoef(`: 计算相关系数矩阵- `cov(`: 计算协方差矩阵- `unique(`: 去掉重复元素4.数据可视化:- `plot(`: 绘制二维折线图- `scatter(`: 绘制散点图- `bar(`: 绘制柱状图- `hist(`: 绘制直方图- `pie(`: 绘制饼图- `imagesc(`: 绘制热图- `contour(`: 绘制等高线图- `surf(`: 绘制三维曲面图5.逻辑和条件语句:- `if`: 条件判断语句- `else`: 条件判断的可选分支- `elseif`: 多个条件判断的中间分支- `while`: 循环语句- `for`: 循环语句- `break`: 跳出循环- `continue`: 跳过本次循环6.文件和数据输入输出:- `load(`: 从文件加载数据- `save(`: 将数据保存到文件- `fopen(`: 打开文件- `fclose(`: 关闭文件- `fprintf(`: 格式化输出到文件- `fscanf(`: 从文件按格式读取数据7.函数和脚本文件:- `function`: 定义函数- `script`: 脚本文件- `input(`: 从命令行输入数据- `disp(`: 显示结果或变量值- `return`: 返回函数结果- `clear(`: 清除变量或内存- `clc(`: 清除命令窗口内容以上是一些常用的MATLAB命令和函数的汇总,这只是冰山一角,MATLAB还提供了许多其他功能和扩展性更强的函数和工具箱,可以根据不同的需求进行更详细的学习和使用。
matlab基本代码解读Matlab(Matrix Laboratory)是一种高级的数学计算软件,广泛用于科学、工程、数据分析和其他领域。
下面是一些基本的Matlab代码片段,并提供了简要的解读:### 示例1:矩阵运算```matlabA = [1 2; 3 4];B = [5 6; 7 8];C = A * B;disp(C);```**解读:**- 创建了两个2x2的矩阵A和B。
- 通过矩阵乘法计算得到矩阵C。
- 使用`disp`函数显示结果。
### 示例2:绘制图形```matlabx = linspace(0, 2*pi, 100);y = sin(x);plot(x, y);```**解读:**- 通过`linspace`生成从0到2π的100个等间隔点作为x。
- 计算这些点的sin值作为y。
- 使用`plot`函数绘制x和y之间的关系图。
### 示例3:条件语句```matlabnum = 15;if num > 10disp('Number is greater than 10');elsedisp('Number is not greater than 10');end```**解读:**- 设置变量num的值为15。
- 使用`if`语句检查num是否大于10。
- 如果条件成立,显示'Number is greater than 10',否则显示'Number is not greater than 10'。
### 示例4:循环语句```matlabfor i = 1:5disp(['Iteration ', num2str(i)]);end```**解读:**- 使用`for`循环从1迭代到5。
- 在每次迭代中,使用`disp`显示当前迭代的信息。
这些是Matlab中一些基本代码片段的简单解读。
MATLAB简介MATLAB(MATrix LABoratory,即矩阵实验室)是MathWork公司推出的一套高效率的数值计算和可视化软件。
MATLAB是当今科学界最具影响力、也是最具活力的软件,它起源于矩阵运算,并已经发展成一种高度集成的计算机语言。
它提供了强大的科学运算、灵活的程序设计流程、高质量的图形可视化与界面设计、便捷的与其他程序和语言接口的功能。
MATLAB语言之所以如此受人推崇是因为它有如下这些优点:1.编程简单使用方便MATLAB的基本数据单元是既不需要指定维数、也不需要说明数据类型的矩阵,而且数学表达式和运算规则与通常的习惯相同。
因此,在MATLAB环境下,数组的操作与数的操作一样简单。
MATLAB的矩阵和向量操作功能是其他语言无法比拟的。
2.函数库可任意扩充由于MATLAB语言库函数与用户文件的形式相同,所以用户文件可以像库函数一样随意调用。
所以用户可根据自己的需要任意扩充函数库。
3.语言简单内涵丰富MATLAB语言中最重要的成分是函数,其一般形式为:Function [a,b,c…]=fun(d,e,f…)其中,fun是自定义的函数名,只要不与库函数名相重,并且符合字符串的书写规则即可。
这里的函数既可以是数学上的函数,也可以是程序块或子程序,内涵十分丰富。
每个函数建立一个同名的M文件,如上述函数的文件名为fun.m。
这种文件简单、短小、高效,并且便于调试。
4.简便的绘图功能MATLAB具有二维和三维绘图功能,使用方法十分简便。
而且用户可以根据需要在坐标图上加标题。
坐标轴标记。
文本注释及栅格等,也可一指定图线形式(如实线、虚线等)和颜色,也可以在同一张图上画不同函数的曲线,对于曲面图还可以画出等高线。
5.丰富的工具箱由于MATLAB的开放性,许多领域的专家都为MATLAB编写了各种程序工具箱。
这些工具箱提供了用户在特别应用领域所需的许多函数,这使得用户不必花大量的时间编写程序就可以直接调用这些函数,达到事半功倍的效果。