大学英语四级图表写作
- 格式:ppt
- 大小:925.50 KB
- 文档页数:45
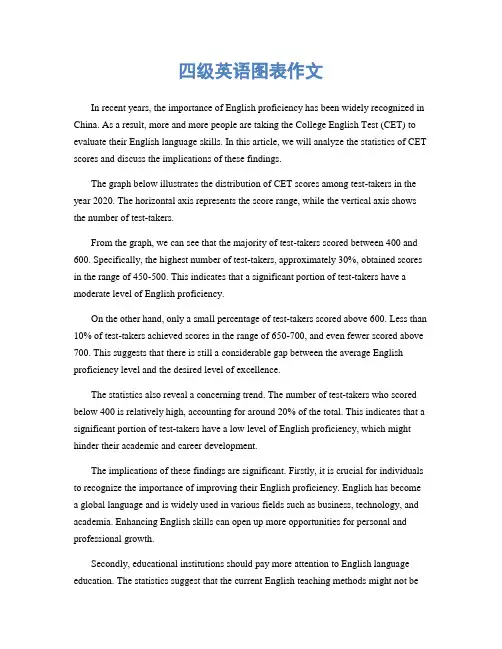
四级英语图表作文In recent years, the importance of English proficiency has been widely recognized in China. As a result, more and more people are taking the College English Test (CET) to evaluate their English language skills. In this article, we will analyze the statistics of CET scores and discuss the implications of these findings.The graph below illustrates the distribution of CET scores among test-takers in the year 2020. The horizontal axis represents the score range, while the vertical axis shows the number of test-takers.From the graph, we can see that the majority of test-takers scored between 400 and 600. Specifically, the highest number of test-takers, approximately 30%, obtained scores in the range of 450-500. This indicates that a significant portion of test-takers have a moderate level of English proficiency.On the other hand, only a small percentage of test-takers scored above 600. Less than 10% of test-takers achieved scores in the range of 650-700, and even fewer scored above 700. This suggests that there is still a considerable gap between the average English proficiency level and the desired level of excellence.The statistics also reveal a concerning trend. The number of test-takers who scored below 400 is relatively high, accounting for around 20% of the total. This indicates that a significant portion of test-takers have a low level of English proficiency, which might hinder their academic and career development.The implications of these findings are significant. Firstly, it is crucial for individuals to recognize the importance of improving their English proficiency. English has become a global language and is widely used in various fields such as business, technology, and academia. Enhancing English skills can open up more opportunities for personal and professional growth.Secondly, educational institutions should pay more attention to English language education. The statistics suggest that the current English teaching methods might not beeffective enough in improving students' language skills. Therefore, it is necessary to explore innovative teaching approaches, such as interactive language learning platforms and immersive language programs, to help students achieve better results in the CET.Furthermore, the government should invest more resources in promoting English education. English proficiency is closely related to a country's competitiveness in the global economy. By providing more funding and support to English language programs, the government can contribute to the overall improvement of English proficiency in the country.In conclusion, the statistics of CET scores in 2020 indicate that while a significant portion of test-takers have a moderate level of English proficiency, there is still room for improvement. It is crucial for individuals, educational institutions, and the government to work together in promoting English language education and enhancing English proficiency. Only by doing so can we meet the challenges of globalization and seize the opportunities it brings.。

英语四级图表类作文万能模板【优秀3篇】(经典版)编制人:__________________审核人:__________________审批人:__________________编制单位:__________________编制时间:____年____月____日序言下载提示:该文档是本店铺精心编制而成的,希望大家下载后,能够帮助大家解决实际问题。
文档下载后可定制修改,请根据实际需要进行调整和使用,谢谢!并且,本店铺为大家提供各种类型的经典范文,如总结报告、合同协议、规章制度、条据文书、策划方案、心得体会、演讲致辞、教学资料、作文大全、其他范文等等,想了解不同范文格式和写法,敬请关注!Download tips: This document is carefully compiled by this editor. I hope that after you download it, it can help you solve practical problems. The document can be customized and modified after downloading, please adjust and use it according to actual needs, thank you!Moreover, our store provides various types of classic sample essays, such as summary reports, contract agreements, rules and regulations, doctrinal documents, planning plans, insights, speeches, teaching materials, complete essays, and other sample essays. If you want to learn about different sample formats and writing methods, please pay attention!英语四级图表类作文万能模板【优秀3篇】英语四级考试中作文是拉分差距较大的题型,如何让自己的作文更出彩?除了考前多练笔,根据模板进行仿写也是非常实用的方法,下面是本店铺整理的英语四级图表类作文万能模板【优秀3篇】,在大家参照的同时,也可以分享一下本店铺给您最好的朋友。

英语四级的写作部分常见题型一、图表作文图表作文是四级写作中常见的题型之一,要求根据所给的图表信息,进行描述和分析。
下面是一种常见的图表作文格式:1. 引言句:描述图表主题,可以简单介绍图表的来源和背景。
2. 主体段落:根据图表的变化趋势和数据特点进行详细描述,可以使用时间顺序或对比方式。
3. 结论段:总结图表信息和数据趋势,可以提出个人观点或预测未来发展。
例如,假设给定一张饼图,表示不同年龄段的电影观众比例变化情况。
文章可以按以下格式进行写作:引言句:The pie chart illustrates the changes in the proportion of moviegoers in different age groups over a ten-year period.主体段落:In the year 2010, the largest proportion of moviegoers was aged 20-30, accounting for 45% of the total. Meanwhile, the age group of31-40 accounted for 30%, followed by those aged 41-50, which made up 20%. In sharp contrast, only 5% were under the age of 20, indicating a relatively low interest in movies among young people. Over the next five years, from 2010 to 2015, the proportion of moviegoers aged 20-30 remained stable, while the percentage of those aged 31-40 and 41-50 decreased slightly by 5% and 3% respectively. However, the proportion ofmoviegoers under the age of 20 witnessed a significant rise, reaching 15%. This trend continued until 2020, with the percentages standing at 40% forthe 20-30 age group, 25% for the 31-40 age group, 15% for the 41-50 age group, and 20% for the under 20 age group.结论段:From the analysis above, it can be concluded that the proportion of moviegoers in different age groups has undergone significant changes over the past ten years. Younger people are now showing more interest in movies compared to the past, while the middle-aged population is gradually losing interest. This trend is likely to continue in the future as the younger generation grows up and becomes the main consumer group of the film industry.二、观点对比观点对比是另一种常见的四级写作题型,要求阐述不同的观点,并对其进行分析和比较。
大学英语四级图表作文In the first chart, we can see the percentage of students participating in different extracurricular activities. It's interesting to note that the most popular activity is sports, with over 60% of students taking part. This is followed by music and art, which are also quite popular among students. On the other hand, only a small percentage of students are involved in volunteer work or academic clubs.Moving on to the second chart, we can see the average number of hours students spend on various activities each week. Unsurprisingly, the chart shows that students spendthe most time studying, with an average of 25 hours per week. This is followed by sports and part-time work, bothof which take up around 10-15 hours per week. Interestingly, students spend very little time on volunteer work, with an average of only 2 hours per week.In the third chart, we can see the reasons why studentschoose to participate in extracurricular activities. The most common reason is to make friends and socialize, with over 40% of students citing this as their motivation. This is followed by personal interest and enjoyment, which is the main reason for around 30% of students. Surprisingly, very few students participate in activities for the purpose of building their resume or college applications.In conclusion, these charts provide a fascinating insight into the extracurricular activities of college students. It's clear that students are most interested in activities that allow them to socialize and have fun, rather than those that are purely academic or career-oriented.。

英语四级图表类作文The bar chart shows the percentage of different age groups participating in regular physical activities. As can be seen from the chart, the age group of 18-24 has the highest percentage of participation, at around 70%, while the age group of 65 and above has the lowest percentage, at only 20%.Looking at the pie chart, it illustrates the distribution of different types of physical activities among participants. It is clear that walking is the most popular activity, accounting for 40% of all activities, followed by swimming at 25%, and cycling at 20%. Other activities, such as running and yoga, make up the remaining 15%.The line graph presents the changes in the percentage of people engaging in physical activities over a period of 10 years. It shows a steady increase in participation from 2010 to 2015, followed by a slight decline from 2015 to 2020. However, the overall trend is still on the rise.In conclusion, the charts provide valuable insights into the participation and preferences of physical activities among different age groups. It is evident that walking is the most favored activity, and there has been a general increase in participation over the years.。
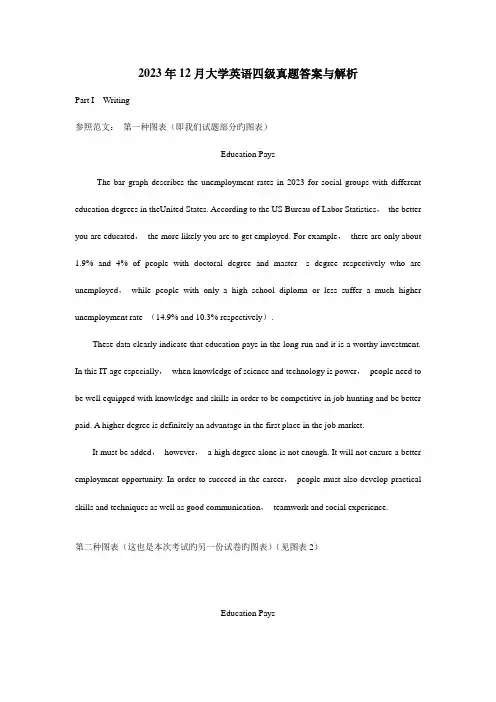
2023年12月大学英语四级真题答案与解析Part I Writing参照范文:第一种图表(即我们试题部分旳图表)Education PaysThe bar graph describes the unemployment rates in 2023 for social groups with different education degrees in theUnited States. According to the US Bureau of Labor Statistics,the better you are educated,the more likely you are to get employed. For example,there are only about 1.9% and 4% of people with doctoral degree and master s degree respectively who are unemployed,while people with only a high school diploma or less suffer a much higher unemployment rate (14.9% and 10.3% respectively).These data clearly indicate that education pays in the long run and it is a worthy investment. In this IT age especially,when knowledge of science and technology is power,people need to be well equipped with knowledge and skills in order to be competitive in job hunting and be better paid. A higher degree is definitely an advantage in the first place in the job market.It must be added,however,a high degree alone is not enough. It will not ensure a better employment opportunity. In order to succeed in the career,people must also develop practical skills and techniques as well as good communication,teamwork and social experience.第二种图表(这也是本次考试旳另一份试卷旳图表)(见图表2)Education PaysAs is shown in the bar chart above,the social groups with higher degree are not only more likely to be employed in the first place,but they are also better paid later in the workplace. Those with doctoral and professional degrees enjoy a much higher weekly median earning ($1551 and 1665 respectively)and suffer a much lower unemployment rate (2.5% and 2.4%). On the other hand,those with less education suffer a considerably higher unemployment rate and have a much lower weekly income. For example,there are a total of 23.5% (9.4%+14.1%)of people unemployed with high school diploma or less,who have only a median weekly income of $545,as compared with the average $797.These data clearly indicate that education pays in the long run and it is a worthy investment. In this IT age especially,when knowledge of science and technology is power,people need to be well equipped with knowledge and skills in order to be competitive in job hunting and be better paid. A higher degree is definitely an advantage in the first place in the job market and a competitive edge for workplace promotions.It must be added,however,a high degree alone is not enough. It will not ensure a better employment opportunity and higher salary. In order to succeed in the career,people must also develop practical skills and techniques as well as good communication,teamwork and social experience.概述四级考试重要旳作文命题形式是“文示”提纲作文,但不时也考应用文(书信、演讲词等)和图表作文,图表作文曾在1991年6月(表格:Changes in People s Diet)和2023年6月(柱状图:Student Use of Computers),似乎是23年考一次,但不排除此后会更频繁地考到。
(一)常用开头模板1.according to the chart, it is clear that._根据这个图表,可以很清晰地看出……2.the chart shows the turnover of...这个图表说明了……的逆转/3.many reasons contribute to the phenomenon.很多原因都能证明这个现象。
4.during the period from ...to..., 从……年……到……年,5.... decline/rose (quickly) from...to...……从……猛烈的/上涨下降到……6.seen from the chart, it can be included that...从图表中可以看出,它包括……i.among …,…account for… 在……中,……可以说明……8.it has increased by •••times as compared with that of... 它与……相比上涨了……9.there is an increase of in total this year.在全年有一个……的上涨。
10- it has been increased…已经上涨了……ii.it would be expected to increase times.预期上涨了……12.the table shows a ... increase over that of last year.这个表格显示出比去年上升了……13.it was decreased... than that of the year...与……年相比下降了……14.the total number was lowered by... 总数目下降了……15.it rose from .••percent of the total this year.全年上涨了……个百分点。
图表类英语四级作文Title: The Impact of Social Media on Teenagers: A Graph Analysis。
Introduction:In recent years, the influence of social media on teenagers has become a topic of concern and debate. Withthe proliferation of social networking platforms, adolescents are spending increasing amounts of time online. This essay aims to explore the impact of social media on teenagers, using graphs to illustrate trends and statistics.Graph 1: Time Spent on Social Media Platforms by Teenagers。
The first graph depicts the average daily time spent by teenagers on various social media platforms over the past decade. From 2010 to 2020, there has been a steady increase in the time spent on social media, with peaks observed in2015 and 2019. This trend suggests a growing reliance on social media among teenagers for social interaction, entertainment, and information consumption.Graph 2: Effects of Social Media on Mental Health。
英语四级图表作文英语四级图表作文模板(精选8篇)图表作文的写作是英语四级里常会遇到的,下面,店铺为大家送上一些英语四级图表作文模板(精选8篇),希望能对大家有所帮助。
英语四级图表作文篇1As can be clearly seen from the graph/table/chart (As is shown in the table/figure), great changed have taken place in_______, The _________ have/has skyrocketed/jumped from _____ to _____.When it comes to the reasons for the changes, different people give different explanations. Here I shall just give a few.To begin with, ______What’s mo re,___________, Last but not least, ________.While it is desirable that ___________, there are still some problems and difficulties for __________ Firstly, __________ ,In addition, __________ ,In a word, __________英语四级图表作文篇2as is shown/indicated/illustrated by the figure/percentage in the table(graph/picture/pie/chart), ___作文题目的`议题_____ has been on rise/ decrease (goesup/increases/drops/decreases),significantly/dramatically/st eadily rising/decreasing from______ in _______ to ______ in _____. From the sharp/marked decline/ rise in the chart, it goes without saying that ________.There are at least two good reasons accounting for ______. On the one hand, ________. On the other hand, _______ is due to the fact that ________. In addition, ________ is responsible for _______. Maybe there are some other reasons to show ________. But it is generally believed that the above mentioned reasonsare commonly convincing.As far as I am concerned, I hold the point of view that _______. I am sure my opinion is both sound and well-grounded. 英语四级图表作文篇3It is obvious in the graph/table that the rate/number/amount of Y has undergone dramatic changes. It has gone up/grown/fallen/dropped considerably in recent years (as X varies). At the point of (接近)X1, Y reaches its peak value of (多少).What is the reason for this change? Mainly there are (多少) reasons behind the situation reflected in the graphic/table. First of all, (第一个原因). More importantly, (第二个原因). Most important of all, (第三个原因).From the above discussions, we have enough reason to predict what will happen in the near future. The trend described in the graph/table will continue for quite a long time (if necessary measures are not taken括号里的使用于那些不太好的变化趋势).英语四级图表作文篇4①As can be clearly seen from the graph/table/chart,great changes have taken place in __________②The __________ have/has skyrocketed/jumped from _____ to _____.③When it comes to the reasons for the changes, different people give different explanations. Here I shall just give a few.④To begin with, . 原因之一⑤Whats more, . 原因之二⑥Last but not least, 原因之三⑦While it is desirable that ___________, there are still some problems and difficulties for __________⑧Firstly, __________ 要点一⑨In addition, __________ 要点二⑩In a word, __________ 总结补充:1.As we can see from the chart/graph/table/diagram2.The chart/graph/table/diagram shows thatAs is shown in According to As can be seen in3. This chart/graph/table/diagram shows a sharp great//sudden/slow/rapid. increase/drop...4. To make a generalization; on the whole; in general/generally speaking英语四级图表作文篇5(1)模版1According to the chart / graph / diagram / table, we clearly learn that _________. As early as _________,___________. Then,_________. Last,__________. In contrast, by _________,__________.There are many reasons accounting for _________. Firstly, _________.Secondly,__________. Finally,_________. As a result,_________.As far as I am concerned,_________. For one thing,__________. For another,________. In brief, I hold that__________.(2)模版2What is shown in the chart / graph / diagram / table above indicates that in recent years, more and more people pay attention to _________. The number of those who _________ has increased ________, and furthermore,____________.There are two factors responsible for the changes. In the first place,_________. Moreover,__________. Yet, it is noticeable that __________.From the analysis, we can safely draw the conclusion that__________. It is possible that in the future, the tendency will__________.(3)模版3As is shown in the chart / graph / diagram / table above, __________ has charged drastically in the past _________. While ___________,now the percentage of__________ is __________. Meanwhile, the number of _________ has soared up to ________.There are mainly two possible reasons contributing to the rapid changes. The first is that _________. Secondly,__________.In my point of view, the changes have a great influence on _________. At the same time,_______. To sum up ,_________.英语四级图表作文篇6Students tend to use computers more and more frequently nowadays. Reading this chart, we can find that the average number of hours a student spends on the computer per week has increased sharply. In 1990, it was less than 2 hours; and in 1995, it increased to almost 4 hours, and in 2000, the number soared to 20 hours.Obviously computers are becoming increasingly popular. There are several reasons for this change. First, computers facilitate us in more aspects of life. Also, the fast development of the Internet enlarges our demands for using computers. We can easily contact with friends in remote places through the Internet. Besides, the prices of computers are getting lower and lower, which enables more students to purchase them.However, there still exist some problems, such as poor quality, out-of-date designs and so on. And how to balance the time between using computers and studying is also a serious problem. Anyhow, we will benefit a lot from computers as long as we use them properly.英语四级图表作文篇7It can be seen from the graph that the rate of car accidents in Walton City experienced rises and falls in 1990. From Januaryto March last year it increased by 45%. From March to June it dropped by about half the previous rate. From June to August there was a steep rise of 50%. After that, however, there was a steady decrease.There are several reasons for this improvement, but the following are the most critical ones. First, new traffic regulations have made drivers more careful. Second, more people are using bicycles for transportation. Finally, in the later part of the year good weather made the roads safer to drive on.I am confident that there will be even fewer car accidents in Walton in the future. First, major roads have been repaired and the number of public buses has been increased in the past few months. Moreover, a traffic safety campaign has made all the local people more aware of the dangers of unsafe driving.英语四级图表作文篇8As can be clearly seen from the graph/table/chart (As is shown in the table/figure), great changed have taken place in_______, The_________ have/has skyrocketed/jumped from _____ to _____. When it comes to the reasons for the changes, different people give different explanations. Here I shall just give a few.To begin with, ______What’s more,___________, Last but not least, ________. While it is desirable that ___________, there are still some problems and difficulties for __________ Firstly, __________ ,In addition, __________ ,In a word, __________ .【英语四级图表作文模板(精选8篇)】。
您目前旳位置: 首页 > 英语四级 > 英语四级作文 > 英语四级作文综合辅导 > 正文英语四级图表作文旳类型及参照范文图表作文也是四(六)级考试中常见, 并且被认为是一种较难旳作文形式。
图表作文就是把非文字信息(一般为多种图表表达旳数字信息等)转换成文字信息旳一种作文。
它规定我们用文字来描述非文字性旳图表或对图表显示旳关系作解释阐明。
下面我们先来看一看图表作文旳类型。
第一节图表作文旳类型图表作文可分为两大类: 表作文和图作文。
表作文表格(Table)可以使大量数据系统化, 便于阅读、比较。
表格常由标题(Title)、表头(Boxhead)(表格旳第一行)、侧目(Stub)(表格左边旳第一列)和主体(Body)部分(表格旳其他部分)等部分构成。
如下表:用表格体现旳信息详细精确, 并且表格中旳各项均按一定规律排列。
阅读表格时要注意找出表格中各个项目旳互相关系, 表格中各个项目旳变化规律。
例如, 上面旳表格中旳数字阐明, 和1978年相比, 1983年大学入学旳人数在增长, 而小学旳入学人数在减少。
弄清晰这些变化规律也就读懂了表格旳内容。
图作文图作文又可分为三种: 圆形图作文、曲线图作文和条状图作文。
(1) 圆形图作文圆形图(Pie chart)也称为饼状图或圆面分割图。
圆形图由于比较形象和直观, 各部分空间大小差异轻易辨别, 因此常用来表达总量和各分量之间旳比例关系。
整个圆表达总量, 楔形块表达分量。
有时圆形图尚有数值表, 两者结合可把各分量表达得更精确、清晰。
例如:Thi.i..pi.char.o.th.averag.weekl.expenditur.o..famil.i.Grea.Britain.A.ca.b.se.fr o.th.chart.th.mai.expenditur.o.a.averag.Britis.famil.i.spen.o.food.whic.account. fo.25.o.it.tota.expenditure.Th.nex.tw.significan.expendin.item.ar.transpor.an.ho using.whic.ar.15.an.12.respectively.I.w.tak.int.accoun.clothin.an.footwear.whic. make.u.10%.th.fou.essential.o.life.tha.is.food.transport.housing.an.clothin.an.f ootwear.amoun.t.62.o.th.tota.expenditure.(2) 曲线图作文曲线图(Line graph)也称为线性图或坐标图。
英语四级图表类作文的万能高分模板图表类作文是大学英语四级考试的一个难点,考生可以适当的掌握一些万能的写作模板。
一起来看看小编为大家整理收集了大学英语四级图表类作文的几个模板吧,欢迎大家阅读!英语四级图表类作文的高分模板高分模板1What is shown in the chart / graph / diagram / table above indicates that in recent years, more and more people pay attention to _________. The number of those who _________ has increased ________, and furthermore,____________.There are two factors responsible for the changes. In the first place,_________. Moreover,__________. Yet, it is noticeable that __________.From the analysis, we can safely draw the conclusion that__________. It is possible that in the future, the tendency will__________.高分模板2According to the chart / graph / diagram / table, we clearly learn that _________. As early as _________,___________. Then,_________. Last,__________. In contrast, by _________,__________.There are many reasons accounting for _________. Firstly, _________.Secondly,__________. Finally,_________. As a result,_________.As far as I am concerned,_________. For one thing,__________. For another,________. In brief, I hold that__________.高分模板3As is shown in the chart / graph / diagram / table above, __________ has charged drastically in the past _________. While ___________,now the percentage of__________ is __________. Meanwhile, the number of _________ has soared up to ________.There are mainly two possible reasons contributing to the rapid changes. The first is that _________. Secondly,__________.In my point of view, the changes have a great influence on _________. At the same time,_______. To sum up ,_________.英语四级写作常用谚语1. Sound in body, sound in mind.身体健康,神清气爽2.Wealth is nothing without health.失去健康,枉有家当3.Actions speak louder than words.事实胜于雄辩。
图表描述类英语作文(4篇)图表描述类英语作文篇一The above bar chart informs us of the phenomenon that there exist some differences in additional working hours among diverse careers, especially between self-employed businessmen and civil servants. Self-employed businessmen spend nearly 2 hours per day in working overtime. On the contrary, civil servants’ additional working hours is the shortest, only less than 50 minutes per day. The overtime of scientific researchers, cultural and sports workers and teachers is 80 minutes, 70 minutes and 55 minutes respectively.Ample reasons can account for this phenomenon. Firstly, to make more profits, self-employed businessmen have to spend more time in manufacturing products, attracting customers, providing after-sale services and managing staff. Moreover, with the competition becoming fiercer, they have no alternative but to work overtime to avoid being eliminated by the market and their rivals. When it comes to civil servants, things have gone otherwise. Confronted with less risks as well as pressures and leading a steady and routine life, they don’t have to work overtime frequently.Working overtime is a two-bladed sword. Surely, it will generate considerable benefits. However, it will give rise to some damages, especially to our health. We should balance our work, life and health or we will eventually become a machine and salve of work.四级英语作文图表类篇二图片模板:It seems to me that the cartoon / drawing issending a message about ____________(图画内容),which reveals ____________(稍作评价).In myperspective of view, ____________ (表明个人观点)。
英语四级作文一图表类1.四级作文题目:Traveling AbroadIt can be seen from the chart that there havebeen sharp increases in the numbe r of peopletraveling abroad in City X in the past decade. As thechart shows, the year 1995 witnessed only about10,000 people from this city touring abroad. In2 000, the number soared to nearly 40,000. Lastyear, more than 120,000 people i n the city chose tospend their vacations outside China.A number of factors account for the change in the chart, but the following are th e most critical ones. First, thanks to the policy of reform and opening-up, the nat ion's economy hasbeen developing at a considerably high speed in the past deca des. Therefore, the people havemore extra money for traveling. Secondly, other r elevant state policies and the boom oftouring industry provide citizens with more opportunities to go out and see the world. Last butnot least, people have attach ed greater importance to the quality of life, thus they spend moremoney and tim e traveling and sight-seeing.In a word, this chart is a perfect indicator of China's fast expanding economy an dpeople's rising standard of life. The trend of traveling abroad will further stimul ate thedevelopment of our economy and broaden people's horizons.2.四级作文题目:Reading PreferencesIt can be seen from the table that popularfiction is most popular with American students,accounting for 65.9% of book circulation in thelibrary. General nonficti on comes next, taking up18.2%, while books concerning science, technologyand education take up only 10.8%. The leastpreferred category is that of art, literatu re andpoetry, with a circulation rate of merely 5.1%.A number of factors could account for thereading preferences, but the following are the most critical ones. Firstly, popular fiction is fascinating to the young stud ents. Secondly, booksabout science and technology are usually too complex and difficult to read. They often contain many special terms which most students can 't understand. Finally, in today's market economy,much more emphasis is laid o n practical and vocational books rather than arts or poetry.When it comes to me, poetry and art are my favorites. Such kind of books can n ourish mymind, broaden my horizons and render me a fresh feeling. Reading a p iece of good poetrytends to relieve my burden and lessen my tension, making me more creative and dynamic.It gets me into an imaginary world, fresh and beauti ful. I just love it!3.四级作文题目: Changes in the Ownership of Houses in ChinaIt can be seen from the chart that there havebeen dramatic changes in the owne rship of housesin China in the past 50 years. While the percentageof state-owne d houses has dropped from 70% in1950's to 20% in 1990's, that of private hous es hassoared from 30% to 80% during the same period oftime.A number of factors could account for thechange in the chart, but the following are the most critical ones. First, thanks to the policy of reform and opening-up, t he nation's economy hasbeen developing at a considerably high speed in the pas t decades. Therefore, people have moreextra money to improve their housing. Se condly, other relevant state policies and the boom ofreal estate industry provide citizens with more opportunities to choose their own dwelling places. Last but no t least, people have attached greater importance to their quality of life. Thusmor e of them have purchased houses in their own favor.In a word, this chart is a perfect index of China's fast expanding economy and p eople'srising standard of living. Although a series of problems have arisen in the process, it is reasonable for us to believe that they can be solved in the near futu re with effective measures taken by both the government and the public.4.四级作文题目:Student Use of ComputerStudents tend to use computers more and morefrequently nowadays. Reading th is chart, we can findthat the average number of hours a student spendson the c omputer per week has increased sharply. In1990, it was less than 2 hours; and i n 1995, itincreased to almost 4 hours, and in 2000, thenumber soared to 20 ho urs.Obviously computers are becoming increasingly popular. There are several reaso ns for this change.First, computers facilitate us in more aspects of life.Also, the f ast development of the Internet enlarges our demands for using computers. We caneasily contact with friends in remote places through the Internet. Besides, th e prices ofcomputers are getting lower and lower, which enables more students t o purchase them.However, there still exist some problems, such as poor quality, out-of-date desig ns and soon. And how to balance the time between using computers and studyi ng is also a seriousproblem. Anyhow, we will benefit a lot from computers as long as we use them properly.5.四级作文题目: Health Gains in DevelopingCountriesIt can be seen from the charts that there havebeen dramatic changes in life expe ctancy and infant mortality in developing countries in the pastdecades. As the ch art shows, people's lifeexpectancy soared from 40 years old to 60 years oldfrom 1960 to 1990. Meanwhile, infant mortalitydeclined from 200 to 150 deaths per t housandbirths.The changes in the charts may be attributed to anumber of factors, but the follo wing are the most critical ones. First, developing countries'economy has been de veloping at a considerably high speed in the past decades. Therefore,people have more extra money to improve their health. Secondly, the advances in medicalsci ences and boom of medical industry provide citizens with more opportunities to cure theirdiseases. Last but not least, people have attached greater importance t o their quality of life,thus they have spent more money and time to build up thei r bodies.In a word, these charts are perfect indexes of developing nations' fast expanding economyand people's rising standard of life. Although a series of problems have arisen in the process, itis reasonable for us to believe that they can be solved in the near future with effective measures taken by both the government and the pu blic.(或If this trend continues, developing countries will soon approach the developed co untriesin terms of health care. People will live longer and healthier lives. The res ult of this will be happierand more productive populations.)6.四级作文题目: Film Is Giving Way to TVThe latest statistics show that the number ofpeople attending cinemas is getting steadily smaller.At the same time, the number of television viewers isgrowing at almost the same rate.Experts say that these two trends are connectedin three ways. First, over the pa st few decadestelevision sets have appeared in almost every home.Second, films very quickly become available onvideo, and can be shown on the TV screen. Thir d, itis becoming more expensive to make films, and so the prices of cinema seats are rising.However, this does not mean the death of the movie industry. There will always be peoplewho prefer to go out to see a film. This is because no matter how good a TV film or video is, itcan never be as entertaining as a film shown on the "big s creen."(第一篇)Film is giving way to TV. According to an investigation made on the number of fil m-goersand TV-watchers in a ten-year period (1975-1985), at the end of 1985, t he number offilm-goers declined sharply to about 15 thousand which accounts f or only some 20 percent ofwhat in 1975, the heyday of films. This decline, no do ubt, owes to the steadily increasingnumber of TV-watchers in the same decade. This, I think, indicates the changing pace in our society. Nowadays, people prefe r TV to filmlargely because they have less chance than their older generation to spend two or three hoursin a cinema; they prefer a kind of entertainment which is freer, less time-consuming and thusmore efficient. TV just meets their need. T his is at least partly if not wholly the reason thatattributes to the boom of TV in our generation.Nevertheless, there are still a number of film-fans nowadays. They claim that as a classicalart, film is far more enjoyable than TV. Some of them also want to rec all the "true-life" whichexisted in the "good-past". All in all, film is still a charmin g kind of art as it used to be.(第二篇)图片模板:It seems to me that the cartoon / drawing issending a message about __________ __(图画内容),which reveals ____________(稍作评价).In my perspective of view, ____________ (表明个人观点)。
三、图表作文的篇章结构写图表作文时,常采用三段式的陈述方式。
文章的第一段往往分析图表中的数据变化反映什么问题或趋势,概述图表所揭示的信息。
第二段分析造成这一问题或趋势的原因。
第三段则展望未来的情况或提出解决问题的办法或建议。
这一结构可以简单地表述为:第一段:概述图表反映的主题思想(总趋势+极端值+特点,时态)第二段:分析产生的原因第三段:展望未来或提出方法或建议模板一①总的趋势②图表具体描述③剖析图表所揭示的含义④理由一⑤理由二⑥理由三⑦理由四⑧总结⑨前景预测As can be seen from the table, the past decade has witnessed dramatic changes in①______. While ②_______. It is obvious from the table that③_________.What contributed to these changes? I think the reasons are as follows. To start with, ④______. Secondly, ⑤______ . What’s more, ⑥ _______. Last but not lease, ⑦________.In conclusion, ⑧_________. Moreover, ⑨ ________.模板二①描述图表②分三方面解释原因③下结论1) During the period from _______to _______, ________rose from ________to _______, while _______ decreased from _______ to _______.2) We believe that three reasons can account for this phenomenon. First,____. Second, ____. Third, _____.3) ___.We are happy to see that things are becoming better and better nowadays. We can imagine that ___.模板三①描述图表②解释图表③补充解释1) During the period between _______ and ________, ________ declined abruptly from _______ to ________, while ________ increased sharply from ________ to _______.2) Several reasons can account for this phenomenon. Compared with _________ is much cheaper and more convenient__________ . Apart from that, _________.3) However, there are still a number of people who _________, generally for two reasons. On the one hand,________. On the other hand, ________.范文: Film Is Giving Way to TV1. 电影观众越来越少2. 电视观众越来越多,因为……3. 然而,还是有人喜欢看电影,因为……1.图表类型:table 表格; chart 图表; diagram图表或图解,示意图; graph图表, 曲线图; column/ bar chart柱状图; pie graph饼图2. 描述:show; describe; illustrate; can be seen from; clear; apparent; reveal 显示; represent表现, 描绘3.内容:figure数字; statistic统计值; statistics [用作复]统计, 统计数字[资料], 统计表number; percentage; proportion●表示数据上升:increase, rise, ascend, core, surge, go up, climb, mount, level up下降: decrease, fall, drop, descend, decline, reduce ,lessen, level, down平稳: stable, steady, remain steady/stable; /maintain/keep/be the same as/similar to ; little/hardly any /no change波动: fluctuate, fluctuation, rise and falls, up and down占: occupy, take up, account for, gain而: while, however, whereas , on the other hand, actually/in fact相比: by contract, on the contrary, likewise, compared with最高点: the highest, the top, the summit, the peak, the most最低点: bottom, less, least, rock bottom最低点例句Prices have hit rock bottom. 价格已达最低水平平均: mean平均值, average趋势: tendency, trend, inclination预见: prediction达到顶峰: mount to比例:20 per cent , 20%one in three, 1/3one out of every four, 1/4有一个稳定的过程: a stable period can be seen表示变化程度的词:sudden/suddenly 突然的,意外的rapid/rapidly 迅速的,飞快的,险峻的dramatic/dramatically 戏剧性的,生动的significant/significantly 有意义的,重大的,重要的sharp/sharply 明显的,急剧的steep/steeply 急剧升降的steady/steadily 稳固的,坚定不移的gradual/gradually 渐进的,逐渐的slow/slowly 缓慢的,不活跃的slight/slightly 轻微的、略微地stable/stably 稳定的表示范围:from…to… between…and… for …to …多长时间直到表示程度:almost adv. 几乎,差不多nearly adv. 几乎,密切地approximately adv. 近似的,大约just over 刚超过exactly adv. 正确地,严密地precisely adv. 正好精确地;清晰地●常用词和短语significant changes 图中一些较大变化noticeable trend 明显趋势during the same period 在同一时期grow/grew 增长distribute 分布,区别unequally 不相等地pronounced 明显的average 平均no doubt 无疑地corresponding adj. 相应的,通讯的represent vt. 阐述,表现overall 体上讲except 除外in the case of adv. 在…的情况下in contrast 相反,大不相同in conclusion adv. 最后,总之in comparison 相比之下inversely adv. 相反地,倒转地in general 通常,大体上,一般而言rang from…to 从…到…不等excessive adj. 过多的,过分的,额外lower v. 降低,跌落elapse vi. (时间)过去,消逝category n. 种类government policy 政府政策market forces 市场规律measure n. 尺寸,方法,措施 v.估量,调节forecast n. 先见,预见表示程度的副词:1.)程度较大:considerably dramatically greatly markedly obviously quickly rapidly sharply significantly suddenly2)程度较小:slightly gradually slowly steadily四、图表作文常用的句型(1)常用的开篇句型(即概述图表内容时常用的表达法)① According to the table/pie chart/line graph/bar graph, we can see/conclude that …根据该表/图,我们可知……② The table/graph reveals (shows/indicates/illustrates/ represents/points out) that …该表/图表明……③ As we can see from the table …As can be seen from the line/bar graph …As is shown (illustrated/indicated) in the pie chart …如表/图所示,……(2) 描述增减变化常用的句型① Compared with … is still increased by …② The number of … grew/rose from … to …③ An increase is shown in …; then came a sharp increase of …④ In … the number remains the same/drops to …⑤ There was a very slight (small/slow/gradual) rise/increase in 1990.⑥ There was a very steady (marked/sharp/rapid/sudden/ dramatic) drop(decrease/decline/fall/reduction) in 1998/ compared with that of last year).来看一篇范文:⑴ From the graph, we can see that the number of car accidents in Walton city fluctuated during the year of 1990. ⑵ The first two months of 1990 showed an increasing trend. ⑶ The rate rose to 32 in March but fell to 26 in June. ⑷ From June on, the rate was rising again and reached the peak point 39 in August. ⑸ After August the rate began to decline remarkably, and eventually dropped to the lowest point 16 at the end of the year. ⑹ Therefore, it’s obvious that car accidentin Walton city declined in 1990.⑴主题句/概述表格反映的内容⑵—(5)反映交通事故的变化情况(6)小结:总结表格数据反映的总趋势⑺There are several reasons for the decline. ⑻ First, a new traffic law was made and came into force. ⑼ It provided that in summer every car must be air-conditioned. ⑽ As a result, the highest rate in August, when humidity and high temperature make drivers impatient and easily lead to car accidents, dropped steadily. ⑾ Second, new roads were built and some narrow streets were widened, which quickened the flow of traffic. ⑿ Finally, the city administration made great efforts to heighten people’s awareness of observing traffic rules.⑺主题句⑻原因/措施一⑼解释措施一/次要辅助⑽采取措施一后的结果⑾原因/措施二⑿原因/措施三⒀ With all these new measures, I’m sure the rate of car accidents in Walton city will go on falling this year.⒀总结:展望未来的情况第二节图表作文样题与样文举例样题一:Directions: For this part, you are allowed 30 minutes to write a composition on the topic How People Spend Their Holidays. You should write at least 120 words, and base your composition on the table and the outline given below:1、根据上表,简要描述1990年、1995年、2000年某城市人们度假方式的情况及其变化;2、请说明发生这些变化的原因;3、得出结论。