投行股票估值的Excel工作底稿(FCFF、FCFE、DDM、APV、EVA、AE)
- 格式:xls
- 大小:483.50 KB
- 文档页数:2
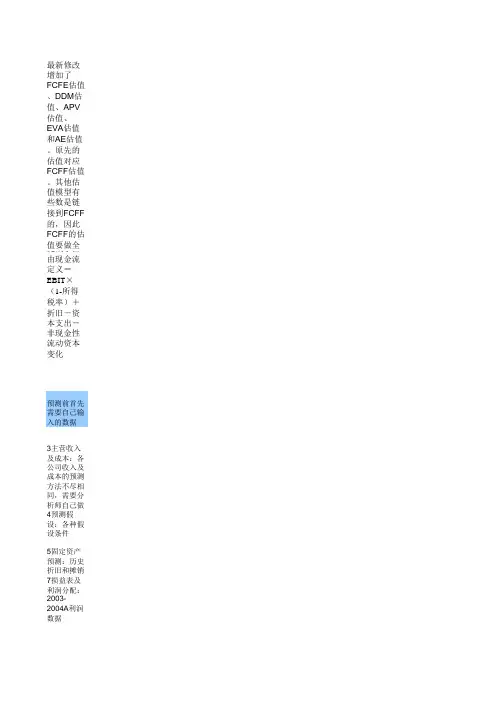
最新修改
增加了FCFE估值、DDM估值、APV估值、EVA估值和AE估值。
原先的估值对应FCFF估值。
其他估值模型有些数是链接到更改了自由现金流定义= EBIT×(1-所得税率)+折旧-资本支出-非现金性流动资本变化
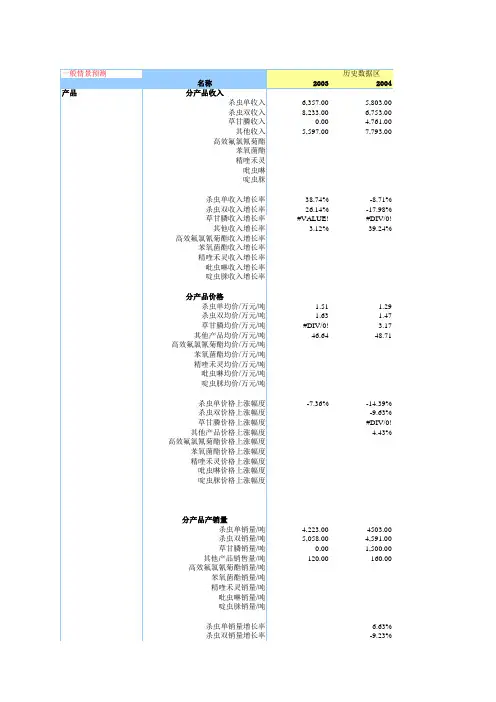
预测前首先需要自己输入的数据
3主营收入及成本:各公司收入及成本的预测方法不尽相同,需要分析师自己做
4预测假设:各种假设条件
5固定资产预测:历史折旧和摊销
7损益表及利润分配:2003-2004A利润数据
8资产负债表:2003-2004历史数据
7损益表及利润分配、8资产负债表:无公式的单元格需要手动填入,如一些特殊会计科目
DCF估值(FCFF):分析日期、股本结构,假设条件中的“第二阶段增长率、长期增长率、应付债券利率、β”。
注意:第二阶段(201其他估值模型:各假设条件(第二阶段年数也不可更改)
11输出结果:2003-2004年经营活动现金流量、投资活动现金流量、融资活动现金流量
值。
其他估值模型有些数是链接到FCFF的,因此FCFF的估值要做全券利率、β”。
注意:第二阶段(2010-2017)年数不可更改。
使用Excel进行股票投资组合分析第一章:股票投资组合分析的概念和重要性股票投资组合分析是一种对不同股票进行定量和定性的评估方法,在投资决策中起到重要的作用。
通过股票投资组合分析,投资者可以评估不同股票的风险和收益,以便做出更明智的投资决策。
在这一章节中,我们将探讨股票投资组合分析的概念和重要性,并介绍Excel在分析中的应用。
第二章:Excel的基本功能和常用公式在进行股票投资组合分析之前,我们需要熟悉Excel的基本功能和常用公式。
Excel是一款功能强大的电子表格软件,可以帮助我们进行各种计算和数据分析。
在这一章节中,我们将介绍Excel 的基本功能,如单元格操作、数据输入和格式化等,并列举一些常用的公式,如计算均值、标准差和相关系数等。
第三章:股票数据的获取和整理在进行股票投资组合分析之前,我们需要获取和整理相关的股票数据。
在这一章节中,我们将介绍如何使用Excel从网络上获取股票数据,并演示如何将数据整理成适合分析的格式。
同时,我们也会介绍一些常用的数据处理技巧,如数据筛选、排序和透视表等。
第四章:股票的风险和收益评估股票的风险和收益是股票投资组合分析的核心内容。
在这一章节中,我们将介绍如何使用Excel对股票的风险和收益进行评估。
我们将介绍常用的风险衡量指标,如标准差、贝塔系数和夏普比率,并演示如何使用Excel进行计算和分析。
第五章:股票组合构建和优化在进行股票投资组合分析时,我们通常会选择多个股票构建一个投资组合。
在这一章节中,我们将介绍如何使用Excel进行股票组合的构建和优化。
我们将介绍常用的组合优化方法,如马科维茨模型和均值-方差模型,并演示如何使用Excel进行计算和优化。
第六章:风险控制和资产配置在进行股票投资组合分析时,风险控制和资产配置是非常重要的。
在这一章节中,我们将介绍如何使用Excel进行风险控制和资产配置。
我们将介绍常用的风险控制方法,如保险策略和动态平衡策略,并演示如何使用Excel进行计算和分析。
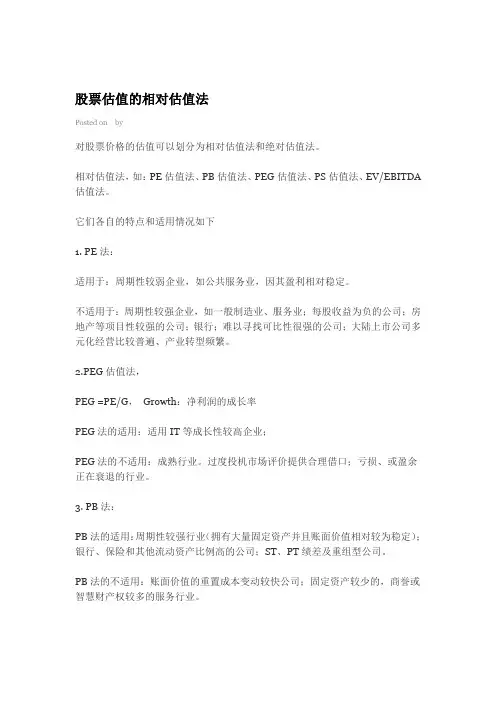
股票估值的相对估值法Posted on by对股票价格的估值可以划分为相对估值法和绝对估值法。
相对估值法,如:PE估值法、PB估值法、PEG估值法、PS估值法、EV/EBITDA 估值法。
它们各自的特点和适用情况如下1. PE法:适用于:周期性较弱企业,如公共服务业,因其盈利相对稳定。
不适用于:周期性较强企业,如一般制造业、服务业;每股收益为负的公司;房地产等项目性较强的公司;银行;难以寻找可比性很强的公司;大陆上市公司多元化经营比较普遍、产业转型频繁。
2.PEG估值法,PEG =PE/G,Growth:净利润的成长率PEG法的适用:适用IT等成长性较高企业;PEG法的不适用:成熟行业。
过度投机市场评价提供合理借口;亏损、或盈余正在衰退的行业。
3. PB法:PB法的适用:周期性较强行业(拥有大量固定资产并且账面价值相对较为稳定);银行、保险和其他流动资产比例高的公司;ST、PT绩差及重组型公司。
PB法的不适用:账面价值的重置成本变动较快公司;固定资产较少的,商誉或智慧财产权较多的服务行业。
PB法的合理修正:将少数股东权益和商誉排除;每年对土地、上市/未上市投资项目资产价值进行重估。
PB法的悖论:股价/相对资产价值相关性弱;股价/相对资产价值< 盈余(资产报酬率)/相对资产价值。
4. PS法:PS(价格营收比)=总市值/营收n=(股价*总股数)/营收PS法的适用:营收不受公司折旧、存货、非经常性收支的影响,不易操控;营收最稳定,波动性小,避免(周期性行业)PE波动较大;不会出现负值,不会出现没有意义的情况,净利润为负亦可用。
PS法的悖论:公司成本控制能力无法反映(利润下降/营收不变);PS会随着公司营收受规模扩大而下降;营收规模较大的公司PS较低。
5.EV/EBITDA法EV(Enterprise value/企业价值):企业价值(EV)=市值+(总负债-总现金)=市值+净负债2. EBITDA (Earnings before interest, tax, depreciation and amortization)/未扣除利息、所得税、折旧与摊销前的盈余)EBITDA=营业利益+折旧费用+摊销费用营业利益=毛利-营业费用-管理费用EV/EBITEV/EBITDA法的适用:资本密集、准垄断或者具有巨额商誉的收购型公司(大量折旧摊销压低了账面利润);净利润亏损,但毛利、营业利益并不亏损的公司。
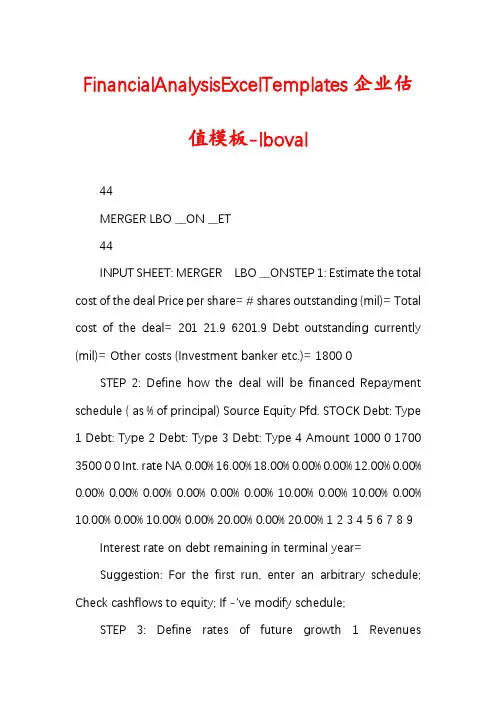
FinancialAnalysisExcelTemplates企业估值模板-lboval44MERGER LBO __ON __ET44INPUT SHEET: MERGER LBO __ONSTEP 1: Estimate the total cost of the deal Price per share= # shares outstanding (mil)= Total cost of the deal= 201 21.9 6201.9 Debt outstanding currently (mil)= Other costs (Investment banker etc.)= 1800 0STEP 2: Define how the deal will be financed Repayment schedule ( as % of principal) Source Equity Pfd. STOCK Debt: Type 1 Debt: Type 2 Debt: Type 3 Debt: Type 4 Amount 1000 0 1700 3500 0 0 Int. rate NA 0.00% 16.00% 18.00% 0.00% 0.00% 12.00% 0.00% 0.00% 0.00% 0.00% 0.00% 0.00% 0.00% 10.00% 0.00% 10.00% 0.00% 10.00% 0.00% 10.00% 0.00% 20.00% 0.00% 20.00% 1 2 3 4 5 6 7 8 9Interest rate on debt remaining in terminal year=Suggestion: For the first run, enter an arbitrary schedule; Check cashflows to equity; If -'ve modify schedule;STEP 3: Define rates of future growth 1 RevenuesDepreciation (See below) Cap. Spending (See below) Working Cap : % of Revenue 14.00% 14.00% 14.00% 16.00% 2 14.00% 14.00% 14.00% 16.00% 3 14.00% 14.00% 14.00% 16.00% 4 14.00% 14.00% 14.00% 16.00% 5 14.00% 14.00% 14.00% 16.00% 6 8.00% 8.00% 8.00% 16.00% 7 8.00% 8.00% 8.00% 16.00% 8 8.00% 8.00% 8.00% 16.00% 9 8.00% 8.00% 8.00% 16.00% 10 8.00% 8.00% 8.00% 16.00%INPUT SHEET: MERGER LBO __ONPrice per share=# shares outstanding (mil)=Total cost of the deal=Debt outstanding currently (mil)=Other costs (Investment banker etc.)=STEP 2: Define how the deal will be financedRepayment schedule ( as % of principal)SourceEquityPfd. STOCKDebt: Type 1Debt: Type 2Debt: Type 3Debt: Type 4Suggestion: For the first run, enter an arbitrary schedule; Check cashflows to equity; If -'ve modify schedule;STEP 3: Define rates of future growthRevenuesDepreciation (See below)Cap. Spending (See below)WorkingCap : % of Revenue45MERGER LBO __ON __ET45COGS: % of Revenues85.68%85.68%85.68%85.68%85.68%85.68%85.68%85.68%85.68%85.68%Default values= If you do not enter rates, the growth rates in depreciation, capital spending = growth rate in revenues. The default values for COGS and Working Capital come from Step 6 below.STEP 4: __ __TION Current T.Bill rate= Ordinary tax rate= 8.00% 40.00% Market risk premium= Current beta of firm= 8.50% 1.05STEP 5: __ ASSETS TO BE SOLD (Enter the year in which assets will be sold and market value and CF to the firm from those assets) 1 Assets sold: Mkt. Value Assets sold: Revenues Assets sold: COGS (%) Assets sold: Depreciation Assets sold: Capital Spending $0 $0 0.00% $0 $0 2 $0 $0 0.00% $0 $0 3 $0 $0 0.00% $0 $0 4 $0 $0 0.00% $0 $0 5 $0 $0 0.00% $0 $0 6 $0 $0 0.00% $0 $0 7 $0 $0 0.00% $0 $0 8 $0 $0 0.00% $0 $0 9 $0 $0 0.00% $0 $0 10 $0 $0 0.00% $0 $0 [ Enter the market value of the asset sold; Enter the EBIT, Depreciation and Capital Spending of the asset; Only in the year sold]STEP 6: ENTER __TION ON __ INCOME __NT Revenues = Current EBIT = Current Int. Exp= Current Deprec'n= $10,000 $892.00 $200.00 $540.00 COGS as % of Revenue= Current Capital Spending= Working Cap. as % of Revenues= Interest rate on Debt Currently= 85.68% $438.00 16.00% 12.00% (Default = 1 - (EBIT+Depreciation)/Revenues)COGS: % of RevenuesDefault values= If you do not enter rates, the growth rates in depreciation, capital spending = growth rate in revenues. values for COGS and Working Capital come from Step 6 below.Current T.Bill rate=Ordinary tax rate=Market risk premium=Current beta of firm=STEP 5: __ ASSETS TO BE SOLD (Enter the year in which assets will be sold and market value and CF to the firm from those assets) Assets sold: Mkt. ValueAssets sold: RevenuesAssets sold: COGS (%)Assets sold: Depreciation[ Enter the market value of the asset sold; Enter the EBIT, Depreciation and Capital Spending of the asset; Only in the year sold]Revenues =Current EBIT =Current Int. Exp=Current Deprec'n=COGS as % of Revenue=Current Capital Spending=Working Cap. as % of Revenues=Interest rate on Debt Currently=46MERGER LBO __ON __ET46__WS FROM LBO PRE- LBO __ Revenues COGS Depreciation EBIT -Int: Type 1 -Int: Type 2 -Int: Type 3 -Int: Type 4 Taxable Income - Taxes Net Income + Deprec'n CF from Oper. - Capital Sp. - WC Chg - Prin. Rep:1 - Prin. Rep:2 - Prin. Rep:3 - Prin. Rep:4 - Pref. Div + Asset Sales CF to Equity $10,000 $8,568 $540 $892 $200 $0 $0 $0 $692 $277 $415 $540 $955 $438 $196 $0 $0 $0 $0 $0 $0 $321 1 $11,400 $9,768 $616 $1,017 $272 $630 $0 $0 $115 $46 $69 $616 $685 $499 $224 $0 $0 $0 $0 $0 $0 ($39) 2 $12,996 $11,135 $702 $1,159 $272 $630 $0 $0 $257 $103 $154 $702 $856 $569 $255 $0 $0 $0 $0 $0 $0 $32 3 $14,815 $12,694 $800 $1,322 $272 $630 $0 $0 $420 $168 $252 $800 $1,052 $649 $291 $0 $0 $0 $0 $0 $0 $112 4 $16,890 $14,471 $912 $1,507 $272 $630 $0 $0 $605 $242 $363 $912 $1,275 $740 $332 $0 $350 $0 $0 $0 $0 ($147) AFTER LBO 5 $19,254 $16,497 $1,040 $1,717 $272 $567 $0 $0 $878 $351 $527 $1,040 $1,567 $843 $378 $0 $350 $0 $0 $0 $0 ($5) 6 $20,794 $17,817 $1,123 $1,855 $272 $504 $0 $0 $1,079 $432 $647 $1,123 $1,770 $911 $246 $0 $350 $0 $0 $0 $0 $263 7 $22,458 $19,242 $1,213 $2,003 $272 $441 $0 $0 $1,290 $516 $774 $1,213 $1,987 $984 $266 $0 $350 $0 $0 $0 $0 $387 8 $24,255 $20,781 $1,310 $2,164 $272 $378 $0 $0 $1,514 $605 $908 $1,310 $2,218 $1,062 $287 $0 $700 $0 $0 $0 $0 $168 9 $26,195 $22,444 $1,415 $2,337 $272 $252 $0 $0 $1,813 $725 $1,088 $1,415 $2,502 $1,147 $310 $0 $700 $0 $0 $0 $0 $344 10 $28,291 $24,239 $1,528 $2,524 $272 $126 $0 $0 $2,126 $850 $1,275 $1,528 $2,803 $1,239 $335 $0 $700 $0 $0 $0 $0 $529 RevenuesCOGSDepreciationEBIT -Int: Type 1 -Int: Type 2 -Int: Type 3 -Int: Type 4Taxable Income - TaxesNet Income + Deprec'nCF from Oper. - Capital Sp. - WC Chg - Prin. Rep:1 - Prin. Rep:2 - Prin. Rep:3 - Prin. Rep:4 - Pref. Div + Asset SalesCF to Equity47MERGER LBO __ON __ET47+ Pref. Div + Int (1-t) + Princ. Rep CF to firm$0 $120 $0 $441$0 $541 $0 $502$0 $541 $0 $573$0 $541 $0 $653$0 $541 $350 $744$0 $503 $350 $849$0 $466 $350 $1,079$0 $428 $350 $1,165$0 $390 $700 $1,258$0 $314 $700 $1,359$0 $239 $700 $1,467 $17,828 $19,528Term Value of Equity= Term Value of Firm=MERGER LBO __ON __ET + Pref. Div+ Int (1-t) + Princ. RepCF to firm474748MERGER LBO __ON __ET48__ __RE AND COSTS OF EQUITY/__ PRE-LBO __ Debt: Type 1 Debt: Type 2 Debt: Type 3 Debt: Type 4 Pfd. Div Equity D/E D/(D+E+Pfd) Pfd/(D+E+Pfd) $1,800 $0 $0 $0 $0 $4,402 40.89% 29.02% 0.00% 1 $1,700 $3,500 $0 $0 $0 $1,000 520.00% 83.87% 0.00% 2 $1,700 $3,500 $0 $0 $0 $1,069 486.47% 82.95% 0.00% 3 $1,700 $3,500 $0 $0 $0 $1,223 425.09% 80.96% 0.00% 4 $1,700 $3,500 $0 $0 $0 $1,475 352.54% 77.90% 0.00% 5 $1,700 $3,150 $0 $0 $0 $1,838 263.91% 72.52% 0.00% AFTER-LBO 6 $1,700 $2,800 $0 $0 $0 $2,365 190.29% 65.55% 0.00% 7 $1,700 $2,450 $0 $0 $0 $3,012 137.78% 57.94% 0.00% 8 $1,700 $2,100 $0 $0 $0 $3,786 100.36% 50.09% 0.00% 9 $1,700 $1,400 $0 $0 $0 $4,694 66.04% 39.77% 0.00% 10 $1,700 $700 $0 $0 $0 $5,782 41.51% 29.33% 0.00%Beta Cost of Equity Interest rate WACC1.05 16.93% 12.00% 14.10%3.47 37.53% 17.35% 14.78%3.30 36.08% 17.35% 14.79%2.99 33.45% 17.35% 14.80%2.63 30.33% 17.35% 14.81%2.18 26.51% 17.30% 14.81%1.81 23.35% 17.24% 14.83%1.54 21.09% 17.18% 14.84%1.35 19.48% 17.11% 14.86%1.18 18.01% 16.90% 14.88%1.05 16.95% 16.58% 14.90%Cum Cost of Eq. Cum WACC1.__-__ 1.__-__2.__-__3.__-__4.__-__5.__-__6.__-__7.__-__8.__-__ 10.__-__ 1.__-__ 1.__-__ 1.__-__ 1.__-__ 1.__-__ 2.__-__ 2.__-__ 3.__-__ 3.__-__ 3.__-__Cum Cost of Eq.Cum WACC1.__-__1.__-__2.__-__3.__-__4.__-__5.__-__6.__-__7.__-__8.__-__0.__-__.__-__1.__-__1.__-__1.__-__.__-__2.__-__2.__-__3.__-__3.__-__3.__-__49MERGER LBO __ON __ET49__ OF THE MERGER/LBO __SPV of CF Equity Investors All Investors $1,974 $9,148Investment $1,000 $6,200Decision ACCEPT THE DEAL ACCEPT THE DEALCashflow to Equity Investors Average FCFE = Maximum FCFE = Minimum FCFE= Std. Deviation of FCFE= $164 $529 ($147) $214Leverage D/E Ratio before LBO = D/E Ratio after LBO = D/E Ratio in year 5= D/E Ratio in year 10 = 40.89% 520.00% 190.29% 24.09%Beta Beta before LBO = Beta after LBO = Beta in year 10 = 1.05 3.47 0.96__ OF THE MERGER/LBO __S50MERGER LBO __ON __ET50100.00% 20.00%After yr 10 8.00% 8.00% 8.00% 16.00%51MERGER LBO __ON __ET5185.68%TermYear$30,554$26,179$1,650$2,725$204$0$0$0$2,521$1,009$1,51 3$1,650$3,163$1,338$362$0$0$0$0$0$0$1,462$0$122$0$1,58554MERGER LBO __ON __ET54Term Year $1,700 $0 $0 $0 $0 $7,057 24.09% 19.41% 0.00%。
excel怎么绘制股票分析图
excel绘制股票分析图的步骤:
2.得到股价图后,对坐标轴刻度进行调整,再进行一些优化处理,就得到直观的K线图啦。
3.除了在股市中会利用到K线图外,工作业务中也会用到这种图表工具。
下面介绍一个实际工作中使用K线图的例子。
现有一组零
售商销售数据,需要进行目标管理。
我们可以将实际销售额设置为
开盘和盘高,每日目标销售额设为盘低和收盘。
每日客流量设为成
交量。
4.选择数据区域,插入股价图。
对股价图进行调整,选择月份、日、星期添加水平轴标签。
该图反映了每天的实际销售额是否达到
目标值,同时显示了每周的变化。
5.对股价图的刻度进行调整。
将左边轴的坐标轴选项最大值调整到80,使成交量与K线之间有一定的距离,看起来清晰。
6.最后对图表进行美化处理。
完成。
wind公司价值估值模型表格英文回答:Valuation models are used to estimate the value of a company, such as Wind Corporation. There are several valuation models that can be used to determine the value of a company, including the discounted cash flow (DCF) model, the price-to-earnings (P/E) ratio model, and the comparable company analysis (CCA) model.The DCF model is a widely used valuation model that estimates the present value of a company's future cash flows. It takes into account the company's projected cash flows, the discount rate, and the terminal value. By discounting the projected cash flows back to their present value, the DCF model provides an estimate of the company's intrinsic value.The P/E ratio model is a simpler valuation model that compares a company's price-to-earnings ratio with its peersin the industry. The P/E ratio is calculated by dividing the company's market price per share by its earnings per share. By comparing the company's P/E ratio with the industry average, an estimate of the company's value can be derived.The CCA model is another commonly used valuation model that compares a company's financial metrics, such as revenue, earnings, and cash flow, with those of similar companies in the industry. By identifying comparable companies and analyzing their financial performance, an estimate of the company's value can be determined.In addition to these valuation models, there are other factors that can influence the value of a company. These include the company's growth prospects, market conditions, industry trends, and competitive landscape. It is important to consider these factors when performing a valuation analysis.中文回答:估值模型用于估计公司的价值,例如Wind公司。

企业价值评估模型的E x c e l实现石河子大学经贸学院学士学位论文论文题目企业价值评估模型的Excel实现学号姓名专业财务管理班级指导老师职称教授中国·新疆·石河子二0一0 年五月目录摘要 (5)Abstract (5)一、引言 (6)二、企业价值评估概述 (6)(一) 企业价值 (6)(二) 企业价值评估的重要意义 (7)(三) 企业价值评估存在的问题 (7)三、企业价值评估模型的选择 (8)(一) 自由现金流定价模型 (8)1、两阶段模型 (8)2、WACC的计算公式 (9)(二) 股权自由现金流定价模型 (9)1、稳定增长FCFE模型 (10)2、两阶段FCFE模型 (10)四、企业价值评估模型在Excel中实现 (10)(一) “公司自由现金流定价模型”工作表的设置 (11)(二) “第一辅助区”工作表的设置 (14)(三) “股权自由现金流定价模型” 工作表的设置 (16)(四) “第二辅助区” 工作表的设置 (17)(五) 模型的改进与优化 (19)五、应用实例 (19)(一) 公司自由现金流定价模型实例应用 (19)(二) 股权自由现金流定价模型实例应用 (21)六、结束语 (21)参考文献: (22)企业价值评估模型的Excel实现【摘要】企业价值问题是公司财务领域的一个核心,随着资本市场的不断成熟,逐渐发展成为金融理论的一个重要分支。
企业价值在实际中的应用也十分广泛,在进行股票定价、企业并购时,都需要参考企业价值的数据。
本文将公司自由现金流定价模型和股权自由现金流定价模型在Excel中实现,以大家熟悉的软件来实现企业价值评估模型的复杂计算过程,使企业价值评估更为高效便捷。
【关键词】企业价值评估企业价值评估模型 Excel模型Excel of the Business Valuation Model is Realized Abstract:Enterprise Value is a core area of corporate finance, with the capital market continues to mature, and gradually developed into an important branch of financial theory. Enterprise value in the practical application is very broad, making the stock price, corporate mergers and acquisitions will need to refer business value of data. This pricing model of corporate free cash flow and free cash flow of equity pricing model is implemented in Excel, in order to achieve the familiar software to model complex business valuation calculation process, the enterprise valuation of more efficient and convenient.Keywords:Business Valuation Business Valuation Model Excel Model企业价值评估模型的Excel实现一、引言对企业价值进行量化计算的理论体系的建立,最早可追溯到艾尔文·费雪的资本价值理论和莫迪利安尼和米勒的价值评估理论。
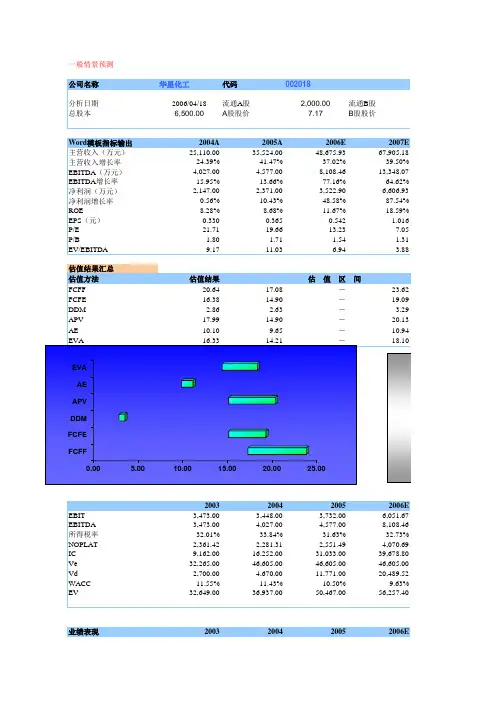
投行股票估值的Excel工作底稿FCFF、FCFE、DDM、APV、EVA、AE(一)投行股票估值是金融领域的一项重要工作。
它是通过各种财务数据和财务模型对公司进行估值,以确定其股票价格的合理价值。
在这里,我们将重点介绍投行股票估值中的Excel工作底稿,包括FCFF、FCFE、DDM、APV、EVA和AE。
一、FCFF(自由现金流法)FCFF是一种基于公司自由现金流的估值方法。
这种方法主要是通过减去公司所需的固定资产投资与净运营资本投资后的自由现金流量来进行估值。
在Excel中,我们将会使用FCFF公式:FCFF = 税后利润 +营运资本投资 - 固定资产投资 - 资本支出 + 折旧与摊销,其中税后利润、营运资本投资、固定资产投资、资本支出和折旧与摊销都是可以直接从公司财务报表中获得的。
二、FCFE(股权自由现金流法)FCFE是另一种基于公司自由现金流的估值方法。
该方法主要是通过减去公司所需的固定资产投资和净运营资本投资后的自由现金流量,再加上净债务变化和股息发放来进行估值。
在Excel中,我们将会使用FCFE公式:FCFE = 税后利润 - 固定资产投资 - 营运资本投资 + 债务净变化 - 股息发放。
三、DDM(股利贴现模型)DDM是一种基于未来股利流的估值方法。
该方法主要是通过对公司未来股利的预测,然后将其贴现到当前的股票价格上来进行估值。
在Excel 中,我们将会使用DDM公式:P0 = (D1 / r - g),其中P0是当前股票价格,D1是下一年的股息,r是资本费用率,g是股息增长率。
四、APV(调整净现值模型)APV是一种基于资本结构对股票估值的影响进行调整的估值方法。
该方法主要是通过对未来现金流的贴现来进行估值,然后再将资本结构的价值加入进来。
在Excel中,我们将会使用APV公式:APV = FCFF / (1 + WACC) ^ t + PV(TS) + PV(OCF) - PV(FinCost),其中WACC是加权平均资本成本,TS是税收抵免,OCF是非税利益和支出,FinCost 是财务成本。
excel股票指标Excel股票指标股票投资是许多投资者追求财富增长的途径之一。
在进行股票投资时,了解股票的相关指标是至关重要的。
Excel作为一款强大的电子表格软件,可以帮助投资者对股票指标进行分析和计算。
本文将介绍一些常见的股票指标,并探讨如何使用Excel进行计算和分析。
一、市盈率(PE Ratio)市盈率是衡量股票相对估值的常用指标,计算公式为市场价格除以每股收益。
市盈率高的股票可能被认为是高估的,而市盈率低的股票可能被认为是低估的。
通过使用Excel的除法函数可以轻松地计算出市盈率。
二、市净率(PB Ratio)市净率是衡量公司资产净值与市值比例的指标,计算公式为市场价格除以每股净资产。
市净率高的股票可能被认为是高估的,而市净率低的股票可能被认为是低估的。
使用Excel的除法函数可以计算出市净率。
三、股息率(Dividend Yield)股息率是衡量股票派发的股息与市价的比例,计算公式为每股股息除以市场价格。
股息率高的股票可能吸引那些追求稳定收益的投资者。
在Excel中,可以使用除法函数进行计算。
四、波动率(Volatility)波动率是衡量股票价格变动幅度的指标,它可以反映股票价格的风险程度。
一般来说,波动率越高,代表股票价格的变动越大,风险也越高。
在Excel中,可以使用标准差函数STDEV.P来计算波动率。
五、均线(Moving Average)均线是通过计算一段时间内股票价格的平均值来平滑价格曲线的指标。
常见的均线有5日均线、10日均线和20日均线等。
使用Excel 的平均值函数AVERAGE可以计算均线。
六、MACD指标(Moving Average Convergence Divergence)MACD指标是一种趋势跟踪指标,通过计算两个移动平均线的差异来判断股票价格的趋势。
使用Excel的差值函数SUBTRACT可以计算出两个移动平均线的差异。
七、RSI指标(Relative Strength Index)RSI指标是一种衡量股票超买超卖情况的指标,它可以帮助投资者判断市场是否出现过度买入或过度卖出的情况。
Excel中的投资计算及举例(一)——FV函数在Excel中某些函数在计算投资数据时经常使用,那就是投资计算函数。
投资计算函数可分为与未来值fv有关,与付款pmt有关,与现值pv有关,与复利计算有关及与期间数有关几类函数:与未来值fv有关的函数:FV、FVSCHEDULE与付款pmt有关的函数:PMT、IPMT、ISPMT、PPMT与现值pv有关的函数: PV、NPV、XNPV与复利计算有关的函数:EFFECT、NOMINAL与期间数有关的函数:NPER在以上投资计算函数中,PV、FV、NPV、PMT函数又是最常见的。
在说明这几类函数之前,我先介绍一下与这几类函数相关的参数:rate:为各期利率,可为银行年利率或年收益率等。
nper:为总投资期或贷款期,即该项投资或贷款的付款期总数。
pmt:为各期所应支付的金额,其数值在整个年金期间保持不变。
通常 pmt 包括本金和利息,但不包括其他费用及税款。
pv:为现值,即从该项投资开始计算时已经入帐的款项,或一系列未来付款的当前值的累积和,也称为本金。
如果省略 pv,则假设其值为零,并且必须包括 pmt 参数。
fv:为未来值,或在最后一次支付后希望得到的现金余额,如果省略 fv,则假设其值为零,即一笔贷款的未来值为零。
type:数字 0 或 1,用以指定各期的付款时间是在期初还是期末。
0或缺省表示期末,1表示期初。
求某项投资的未来值-Excel函数FV的使用: FV(Future Value)为返回投资的未来值。
FV函数是基于固定利率及等额分期付款方式,返回某项投资的未来值。
FV函数的语法为:FV(rate,nper,pmt,pv,type)注意:所指定的 rate 和 nper 单位要保持一致。
例如,年利率为10%贷款3年时,按年计息则rate=10%,nper=3。
若按月计息则rate=10%/12,nper=3*12。
FV函数举例:1.整存整取如下图所示范例:这是一个简单的整存整取的例子,在图中绿色高亮区域你可以看到FV函数公式,其中A4,A5,A6,A7分别对应各单元格中的内容。
最新修改
增加了FCFE估值、DDM估值、APV估值、EVA估值和AE估值。
原先的估值对应FCFF估值。
其他估值模型有些数是链接到F 更改了自由现金流定义= EBIT×(1-所得税率)+折旧-资本支出-非现金性流动资本变化
预测前首先需要自己输入的数据
3主营收入及成本:各公司收入及成本的预测方法不尽相同,需要分析师自己做
4预测假设:各种假设条件
5固定资产预测:历史折旧和摊销
7损益表及利润分配:2003-2004A利润数据
8资产负债表:2003-2004历史数据
7损益表及利润分配、8资产负债表:无公式的单元格需要手动填入,如一些特殊会计科目
DCF估值(FCFF):分析日期、股本结构,假设条件中的“第二阶段增长率、长期增长率、应付债券利率、β”。
注意:第二阶段(2010其他估值模型:各假设条件(第二阶段年数也不可更改)
11输出结果:2003-2004年经营活动现金流量、投资活动现金流量、融资活动现金流量。
其他估值模型有些数是链接到FCFF的,因此FCFF的估值要做全券利率、β”。
注意:第二阶段(2010-2017)年数不可更改。