RIGOL 频谱仪使用规范 PPT
- 格式:ppt
- 大小:2.31 MB
- 文档页数:19


应用指南/技术说明书DS70000系列数字示波器高精度频率计应用指南文档版本0.1发布日期2021年8月RIGOL TECHNOLOGIES INCCO., LTD.RIGOL 3前言版权© 2021普源精电科技股份有限公司商标信息RIGOL 是普源精电科技股份有限公司的注册商标。
声明●本公司产品受中国及其它国家和地区的专利(包括已取得的和正在申请的专利)保护。
●本公司保留改变规格及价格的权利。
●本手册提供的信息取代以往出版的所有资料。
●本手册提供的信息如有变更,恕不另行通知。
●对于本手册可能包含的错误,或因手册所提供的信息及演绎的功能,以及因使用本手册而导致的任何偶然或继发的损失,RIGOL 概不负责。
●未经RIGOL 事先书面许可,不得影印、复制或改编本手册的任何部分。
产品认证RIGOL 认证本产品符合中国国家产品标准和行业产品标准及ISO9001:2015标准和ISO14001:2015标准,并进一步认证本产品符合其它国际标准组织成员的相关标准。
联系我们如您在使用此产品或本手册的过程中有任何问题或需求,可与RIGOL 联系: 电子邮箱:*****************网址:4 本应用指南/本技术说明书●简要介绍频率计的概念●简要介绍频率计的实现原理●简要介绍DS70000系列示波器频率计的性能指标●简要介绍DS70000系列示波器频率计的使用方法和注意事项完成全文阅读,大概需要5分钟时间。
应用指南/技术说明书RIGOL5 应用指南/技术说明书 简介无论是传统的模拟示波器还是现代的数字示波器,测量信号频率的功能从产品诞生之日起就具备了。
早期的模拟示波器,测频过程需要工程师手动调节水平时基、触发等功能使得屏幕上呈现出1到2个周期的稳定波形后,通过观察该信号一个周期内占据的水平格数,再参考水平时基估算出信号周期,最终得到频率。
近些年随着数字示波器在测量技术在精度、速度以及使用便捷性等诸多方面突飞猛进的发展,示波器能够自动且快速的完成信号频率测量,并呈现到屏幕上,方便工程师进行读取。
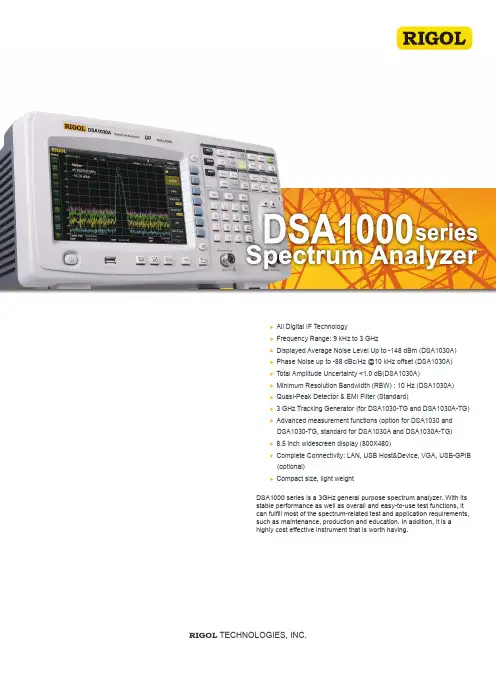
RIGOL TECHNOLOGIES, INC.DSA1000 series is a 3GHz general purpose spectrum analyzer. With its stable performance as well as overall and easy-to-use test functions, it can fulfill most of the spectrum-related test and application requirements, such as maintenance, production and education. In addition, it is ahighly cost effective instrument that is worth having.All Digital IF TechnologyFrequency Range: 9 kHz to 3 GHzDisplayed Average Noise Level Up to -148 dBm (DSA1030A) Phase Noise up to -88 dBc/Hz @10 kHz offset (DSA1030A) Total Amplitude Uncertainty <1.0 dB(DSA1030A)Minimum Resolution Bandwidth (RBW) : 10 Hz (DSA1030A) Quasi-Peak Detector & EMI Filter (Standard)3 GHz Tracking Generator (for DSA1030-TG and DSA1030A-TG) Advanced measurement functions (option for DSA1030 and DSA1030-TG, standard for DSA1030A and DSA1030A-TG) 8.5 inch widescreen display (800X480)Complete Connectivity: LAN, USB Host&Device, VGA, USB-GPIB (optional)Compact size, light weightProduct Dimensions: Width X Height X Depth = 399 mm × 223 mm × 159 mm Weight: 6.2 kg (Without Battery and Package)Benefits of Rigol's all digital IF designUnique widescreen display, friendly interface and easy-to-use operationsPower ONLastFactory Preset User PresetPresetStatus saving and loading such asSetup State TraceCorrections Measure Marker Table Peak Table Limit1RIGOLDSA1000 Series provides a series of automatic setting functions such as Auto Tune, Auto Range, Auto Scale and Auto Couple that enable the analyzer to acquire signals and match parameters automatically, instead of the manual process used by a traditional analyzer. In addition, the User and Factory settings under the Preset function enable users to quickly and easily recall previous measurement settings.With the DSA1000 Series get a high quality spectrum analyzer without the price tag. This lowers the investment whether you are in stages related to research and development or manufacturing and maintenance. Don't let instrumentation costs dictate resource allocation. With our available calibration and maintenance training as well as firmware updates never regret a purchase because of total cost of ownership.1. The ability to measure smaller signals: on the basis of this technology, the IF filter enables smaller bandwidth settings, which greatly reduce the displayed average noise level.2. The ability to distinguish between small signals by frequency: using the IF filter with the smallest bandwidth setting it is possible to make out signals with a frequency difference of only 10 Hz.3. High precision amplitude readings: this technology almost eliminates the errors generated by filter switching, reference level uncertainty, scale distortion, as well as errors produced in the process of switching between logarithmic and linear display of amplitude when using a traditional analog IF design.4. Higher reliability: compared with traditional analog designs, the digital IF greatly reduces the complexity of the hardware, the system instability caused by channel aging, and the temperature sensitivity that can contribute to parts failure.5. High measurement speed: the use of digital IF technology improves the bandwidth precision and selectivity of the filter, minimizing the scanningtime and improving the speed of the measurement.Breadth of measurement functions andautomatic settings provide ultimate flexibilityIncomparable ValueAdvanced Performance and stabilityStability and precision is the primary design goal of the DSA1000 Series. We started with an all digital IF core. With the minimum 10Hz resolution bandwidth, -88 dBc/Hz phase noise (typical) at 10 kHz offset, up to -148 dBm displayed average noise level (10 Hz RBW, standard preamplifier on) and less than 1.0 dB total amplitude error, the DSA1000 Series makes high precision measurements easier than ever whether the application calls for low noise or narrow resolution.RIGOL 2Features and BenefitsDistinguish the two nearby signals clearly with the 10Hz RBWReadout the signal's Phase Noise directly by using the standard Noise Marker functionCompare the spectrums with different color trace The advanced Occupied Bandwidth measurement function The advanced Harmonic distortion measurement functionReadout the Spectrum Peak values with the Peak table functionThe advanced Channel Power measurementfunctionQuasi-Peak Detector & EMI Filter (Standard)RIGOL Spectrum Analyzer Option and AccessoryVSWR Bridge( VB1020/VB1040)Rack Mount Kit ( RM-DSA1000 )USB to GPIB Converter( USB-GPIB )RF Demo Kit ( TX1000 )RF CATV KitRF Demo Kit ( RX1000 )Soft Carrying Bag ( BAG-DSA1000 )DSA Utility Kit RF Cable Kit( CB-NM-NM-75-L-12G )( CB-NM-SMAM-75-L-12G )RF Adaptor Kit High Power Attenuator( ATT03301H )RF Attenuator KitDSA PC Software ( Ultra Spectrum )Advanced Measurement Kit(AMK-DSA1000)3RIGOLDesk Mount Instrument Arm(ARM)SpecificationsSet “Auto SWT” to “Accy”Resolution Bandwidth (-3dB)10 Hz to 1 MHz, in 1-3-10 sequence 100 Hz to 1 MHz, in 1-3-10 sequence Bandwidth (-6dB)200Hz, 9kHz, 120kHz, 1 MHz 200Hz, 9kHz, 120kHz, 1 MHzRBW Uncertainty<5%, nominal Resolution Filter Shape Factor (60 dB : 3 dB)<5, nominalVideo Bandwidth (-3dB) 1 Hz to 3 MHz, in 1-3-10 sequencefc ≥ 50MHz, preamplifier offSpecifications are valid under the following conditions: the instrument is within the calibration period, is stored for at least two hours at 5℃ to 40℃ temperature, and is warmed up for 30 minutes. Unless otherwise noted, the specifications in this manual include the measurement uncertainty.Typical (typ.): characteristic performance, which 80 percent of the measurement results will meet at room temperature (approximately 25℃). This data is not warranted and does not include the measurement uncertainty.Nominal (nom.): the expected mean or average performance or a designed attribute (such as the 50 Ω connector). This data is not warranted and is measured at room temperature (approximately 25℃).Measured (meas.): an attribute measured during the design phase which can be compared to the expected performance, such as the amplitude drift variation with time. This data is not warranted and is measured at room temperature (approximately 25℃).NOTE: All data in this manual are the measurement results of multiple instruments at room temperature unless otherwise noted. The specifications (except the TG specifications) listed in this manual are those when the tracking generator is off.RIGOL 410 dB RF AttenuationVSWR 100 kHz to 10 MHz: <1.8, nominal 10 MHz to 2.5 GHz: <1.5, nominal 2.5 GHz to 3 GHz: <1.8, nominal5RIGOLRIGOL67RIGOLOrdering InformationWarrantyThree -year warranty, excluding accessories.HEADQUARTERRIGOL TECHNOLOGIES, INC.No.156,Cai He Village,Sha He Town,Chang Ping District, Beijing,102206 P .R.China Tel:+86-10-80706688Fax:+86-10-80705070E l e c t r o n i c M e a s u r e m e n t Instrument service and support email:*********************Chemical Analysis Instrument service and support email:service.**************EUROPERIGOL TECHNOLOGIES GmbH Lindbergh str. 482178 Puchheim GermanyTel: 0049- 89/89418950Email:*************************NORTH AMERICARIGOL TECHNOLOGIES,USA INC.10200 SW Allen Blvd, Suite C Beaverton, OR 97005, USA Toll free: 877-4-RIGOL-1Office: (440) 232-4488Fax: (216)-754-8107Email:**************JAPANRIGOL TECHNOLOGIES JAPAN G.K.Tonematsu Bldg. 5F, 2-33-8 Nihonbashi-Ningyocho, Chuo-ku,Tokyo 103-0013 JapanTel: +81-3-6264-9251Fax: +81-3-6264-9252Email:********************RIGOL ® is the registered trademark of RIGOL Technologies, Inc. Product information in this document subject to update without notice. For the latest information about RIGOL 's products, applications and services, please contact local RIGOL office or access RIGOL official website: November 2015。
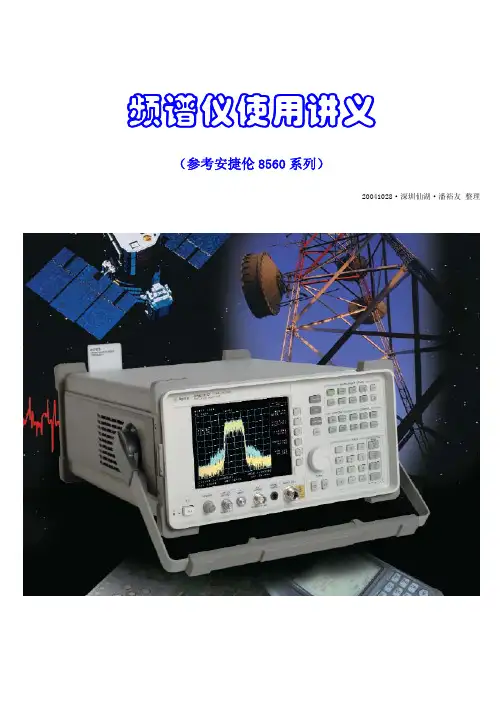
频谱仪使用讲义(参考安捷伦8560系列)20041028·深圳仙湖·潘裕友 整理目录1.前言 (1)1.1. 文档说明 (1)1.2. 什么是频谱 (1)1.3. 为什么要测量频谱 (2)2.注意事项 (5)3.面板介绍 (6)3.1. 前面板 (6)3.1.1.按键(硬键)和接口 (6)3.1.2.显示屏 (7)3.2. 后面板 (10)4.基本测量步骤 (12)5.参考电平校准 (17)6.频谱仪测量案例 (18)6.1. 妙用RBW分辨邻频信号 (18)6.1.1.什么是分辨率带宽(RBW) (18)6.1.2.用到的频谱仪功能 (18)6.1.3.测量两个幅度相同邻频信号的步骤 (18)6.1.4.测量两个幅度不同近频信号的步骤 (20)6.2. 测量谐波失真 (23)6.2.1.什么是谐波失真 (23)6.2.2.用到的频谱仪功能 (23)6.2.3.之一:快速谐波测量方法 (23)6.2.4.之二:选择性谐波测量方法 (27)6.2.5.谐波失真百分比 (28)6.3. 测量三阶互调失真 (30)6.3.1.什么是互调失真 (30)6.3.2.用到的频谱仪功能 (30)6.3.3.测量步骤 (30)6.4. 测量邻道功率ACP (35)6.4.1.什么是邻道功率 (35)6.4.2.用到的频谱仪功能 (35)6.4.3.基本的ACP测量步骤 (35)6.4.4.ACP模拟方法 (38)6.4.5.突发信号ACP测量步骤 (42)6.4.6.PHS ACP测量计算(RCR-28) (43)6.5. 频谱仪当示波器使用 (44)6.5.1.频谱仪也能进行时域测量 (44)6.5.2.延迟扫描测试步骤 (46)6.6. 频谱仪当收音机使用 (48)6.6.1.什么是AM和FM解调 (48)6.6.2.用到的频谱仪功能 (48)6.6.3.测量步骤 (48)6.7. 调制测量 (51)6.7.1.什么是调制 (51)6.7.2.用到的频谱仪功能 (51)6.7.3.调制测量步骤 (51)6.8. 用A MPCOR提高幅度准确度 (58)6.8.1.什么是Ampcor (58)6.8.2.用到的频谱仪功能 (58)6.8.3.Ampcor测量步骤 (58)7.附录: (61)7.1. AMPLITUDE (61)7.2. AUTOCOUPLE (62)7.3. AUX CTRL (1 OF 3) (63)7.4. AUX CTRL (2 OF 3) (64)7.5. AUX CTRL (3 OF 3) (65)7.6. BW (65)7.7. CAL (66)7.8. CONFIG (67)7.9. COPY (67)7.10. DISPLAY (68)COUNT (68)7.11. FREQ7.12. FREQUENCY (69)7.13. HOLD (69)7.14. MEAS/USER (70)MENU (71)7.15. ACP7.16. MKR (72)7.17. MKR-> (72)7.18. MODULE (73)SEARCH (73)7.19. PEAK7.20. PRESET (74)7.21. RECALL (74)7.22. SAVE (75)SWP (75)7.23. SGL7.24. SPAN (76)7.25. SWEEP (76)7.26. TRACE (77)7.27. TRIG (77)DIAGRAM (78)7.28. BLOCK7.29. OPERATION (79)图6 8560系列前面板示意图图12 20MHz频宽激活频标Marker。
仪器仪表的使用第一章频谱仪的使用☞快速指南☞测量实例☞按键功能目录一:MS2711B频谱分析仪 (3)第1节:概述 (3)第2节快速启动指南 (9)第3节按键功能 (19)第4节基本测量 (28)第5节测量的例子 (36)第6节预放 (49)第7节跟踪信号发生器................................................ 错误!未定义书签。
第8节软件工具............................................................ 错误!未定义书签。
二:AT5011频谱分析仪使用方法............................................... 错误!未定义书签。
1、目的 .................................................................................. 错误!未定义书签。
2、适用型号 .......................................................................... 错误!未定义书签。
3、功能 .................................................................................. 错误!未定义书签。
4、特点 .................................................................................. 错误!未定义书签。
5、应用 .................................................................................. 错误!未定义书签。
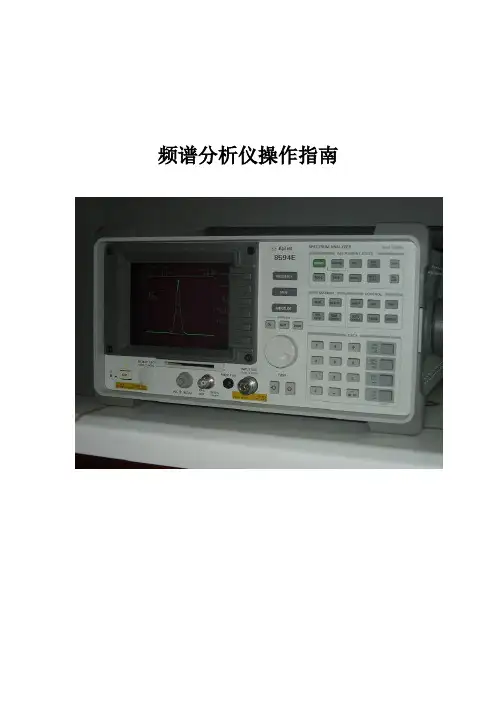
频谱分析仪操作指南目录频谱分析仪操作指南 (2)第一节仪表板描述 (2)一、前面板 (2)二、后面板(略) (7)第二节基本操作 (7)一、菜单操作和数据输入 (7)二、显示频谱和操作标记 (9)三、测试窗口和显示线 (13)四、利用横轴测试频率 (17)五、自动调整 (20)七、UNCAL信息 (23)第三节菜单功能描述 (25)频谱分析仪操作指南第一节仪表板描述一、前面板这部分包括前面控制板详细的视图、按键解释和显示在那些图片上的连接器,这可从频谱仪的前部面板看到,共分为九个部分,如下所述:1、显示部分23、软盘驱动部分4、MEASUREMENT部分124□5STOP65、DATA 部分6、MARKER 部分47、CONTROL 部分168、SYSTEM部分□REMOTE1PRESET□SHIFT349、混杂的部分10、屏幕注释312图1屏幕注释二、后面板(略)第二节基本操作一、菜单操作和数据输入用面板按键和选项去操作频谱分析仪。
使用面板键时,一个常见的菜单会显示在屏幕的右边。
但是,有一些键没有相关的软菜单,如AUTO TUNE和COPY键。
每菜单选项与功能键一一对应。
选择一个菜单,需要按相应的功能键。
在一些情形中,按功能键显示附加选项。
下面的例子指出了仪表板和软按键功能的多少。
1、选择菜单按LEVEL键显示用于安装测试的菜单。
参考线值显示在活动区域中,电平菜单显示在屏幕的右边,显示如下Ref LevelATT AUTO/MNLdB/divLinearUnitsRef Offset ON/OFF2、输入数据当一个值显示在激活区时,你可利用数字键、步进键或数据旋钮改变它。
●利用数字键输入数据可利用下面的键输入数据:数字键(0到9),小数点键,和退格(BK SP)或减号(-)键。
如果你使用数字键时出错,你可用退格(BK SP)键删除最近输入的数字。
如果你没有输入任何数据,按BK SP键输入一个减号(-)。
普源(RIGOL)《高频线路》是一门理论性、工程性、综合性和实践性十分强的课程。
普源RIGOL作为与小学联系最为紧密的厂家之一,不仅在研发创造产品技术上锐意进取、不断突破,同时也希翼为大学试验教学的丰盛与进展提供最有力的支持。
性价比极高的DSA800系列,从而将频谱分析仪融入到高频电子线路的课程中,为高频电子线路试验课程创新提供了全新手段。
1、单调谐回路谐振◆传统试验办法:逐点测量画出频响曲线,并在曲线中找到谐振点,计算放大倍数、通频带和矩形系数。
◆优化试验办法:利用跟踪源或信号源输入扫频信号,然后利用频谱分析仪挺直绘出频响曲线,并且挺直从图中测量谐振点和通频带,直观观看放大倍数和矩形系数。
◆优势总结:1.观看静态工作点和集电极负载对单调谐放大器幅频特性(包括增益、通频带、Q值)的影响;2.削减试验步骤和试验误差,节约试验时光,提高试验效率;3.试验结果清楚直观,便于理解谐振放大器的工作原理。
2、LC、晶体正弦波振荡◆传统试验办法:利用和频率计逐点测量输出信号幅度和频率,按照数据计算频率稳定度和波段笼罩系数。
◆优化试验办法:利用频谱分析仪观看当回路转变时的输出信号的幅频特性,并直观观看输出信号的频谱纯度。
◆优势总结:1.观测谐波组成,辨析正弦信号的频谱纯度,理解理论信号与实际信号之间的差别;2. 比较LC与晶体振荡电路的稳定性。
3、晶体管混频电路◆传统试验办法:用示波器或者频率计测量混频前后的信号频率和幅度。
◆优化试验办法:用频谱分析仪观测混频前后的信号,并便利的观看次生信号成分。
◆优势总结:1.直观的看到频谱搬移的过程;2.直观的看到各种组合频率,例如中频干扰和镜像干扰;3.直观理解非线性时变电路对信号质量的影响。
4、幅度调制电路◆传统试验办法:用示波器观看调幅信号包络,并计算调幅信号的调制深度Ma。
◆优化试验办法:加入应用频谱分析仪观看调制后的信号频谱图。
◆优势总结:1.对照载波和调幅波频谱,从频域理解调幅理论;2.观看调制信号的上下边带,加深对原理的理解。