数据模型与决策 第13章
- 格式:pdf
- 大小:512.54 KB
- 文档页数:75
高纲1396江苏省高等教育自学考试大纲30447 数据、模型与决策南京大学编江苏省高等教育自学考试委员会办公室I 课程性质、设置目的与要求一、《数据、模型与决策》课程的性质随着社会信息化水平的提高和科学管理意识的普遍增强,人们对如何从数据资料角度进行认识显示出越来越多的兴趣。
数据资料本身并没有什么意义,关键是采用合适的方法对其进行分析和处理,只有这样才能探索客观现象发展变化的内在规律,从而更好地服务于管理决策的需要。
《数据、模型与决策》属于数量性质的课程,侧重于讲解数据资料的搜集、描述、分析和解释,以及管理决策方法和技术方面的知识。
管理决策分为两类,一类是理性决策一类是行为决策。
数据分析与决策模型中,不论是以不确定性为特征的统计决策,还是以确定性为特征的管理科学优化决策,和以策略互动为特征的博弈决策,都可以把它们归结为理性决策范畴。
既然是理性决策,必然会要求建立某种决策准则,然后在既定的准则下通过度量来选择决策方案。
这一过程一方面要对研究的问题进行结构化处理,另一方面也需要有相应的数据资料。
前者是为了能够建立决策模型,后者则是帮助实现计算。
有鉴于此,数据与模型在决策分析中的重要意义不言而喻。
数据与模型除了共同服务于决策分析以外,两者之间也存在密切的关系。
从应用的角度,统计方法比较强调实证性做法,统计分析与决策中,没有大量的、客观准确的数据资料,统计决策分析只能停留在纯理论的状态,无法形成具体的分析结论。
管理运筹优化和博弈决策分析中,虽然不像统计分析那样,需要拥有充足的数据,但是必要的不可控因素比如模型中的有关参数,其数值资料就必须事先给以确定。
尽管现在的企业一般都积累了大量的可供开发利用的数据资料,不过由于这样那样的原因,数据资料本身总会存在不系统、不充分、不完备的情况。
因此,对于背景数据必须经过科学的编辑、处理、汇总和提炼,然后才能用于决策分析。
对此,模型起着重要的转化作用,通过模型化处理,不仅能对数据的价值结构进行改造,而且还能对决策赋以深层次的分析。
《数据模型与决策》复习题及参考答案第一章绪言一、填空题1.运筹学的主要研究对象是各种有组织系统的管理问题,经营活动。
2.运筹学的核心是运用数学方法研究各种系统的优化途径及方案,为决策者提供科学决策的依据。
3.模型是一件实际事物或现实情况的代表或抽象。
4、通常对问题中变量值的限制称为约束条件,它可以表示成一个等式或不等式的集合。
5.运筹学研究和解决问题的基础是最优化技术,并强调系统整体优化功能。
运筹学研究和解决问题的效果具有连续性。
6.运筹学用系统的观点研究功能之间的关系。
7.运筹学研究和解决问题的优势是应用各学科交叉的方法,具有典型综合应用特性。
8.运筹学的发展趋势是进一步依赖于_计算机的应用和发展。
9.运筹学解决问题时首先要观察待决策问题所处的环境。
10.用运筹学分析与解决问题,是一个科学决策的过程。
11.运筹学的主要目的在于求得一个合理运用人力、物力和财力的最佳方案。
12.运筹学中所使用的模型是数学模型。
用运筹学解决问题的核心是建立数学模型,并对模型求解。
13用运筹学解决问题时,要分析,定议待决策的问题。
14.运筹学的系统特征之一是用系统的观点研究功能关系。
15.数学模型中,"s·t"表示约束。
16.建立数学模型时,需要回答的问题有性能的客观量度,可控制因素,不可控因素。
17.运筹学的主要研究对象是各种有组织系统的管理问题及经营活动。
二、单选题1.建立数学模型时,考虑可以由决策者控制的因素是〔 AA.销售数量B.销售价格C.顾客的需求D.竞争价格2.我们可以通过〔 C来验证模型最优解。
A.观察B.应用C.实验D.调查3.建立运筹学模型的过程不包括〔 A 阶段。
A.观察环境B.数据分析C.模型设计D.模型实施4.建立模型的一个基本理由是去揭晓那些重要的或有关的〔 BA数量 B变量 C 约束条件 D 目标函数5.模型中要求变量取值〔 DA可正 B可负 C非正 D非负6.运筹学研究和解决问题的效果具有〔 AA 连续性B 整体性C 阶段性D 再生性7.运筹学运用数学方法分析与解决问题,以达到系统的最优目标。

第一章(管理科学简介)P5(1)管理科学介绍管理科学本质:是对与定量因素有关的管理问题通过应用科学的方法进行辅助管理决策制定的一门学科.管理科学发展过程:快速发展开始于20世纪四五十年代起初的动力来自于第二次世界大战另一个里程碑是1947年丹捷格发明单纯形罚更大的推动作用的是计算机革命的爆发管理决策:管理者考虑管理科学对定量因素进行分析得出的结果后,再考虑管理科学以外的众多无形因素,然后根据其最佳判断做出决策管理科学小组系统和考察时步骤:定义问题与收集数据——构件数学模型——从模型中形成对于一个问题进行求解的基于计算机的程序——测试模型并在必要时进行修正——应用模型分析问题以及提出管理建议——帮助实施被管理者采纳的小组建议课后问题:1.管理科学什么时候有了快速发展?快速发展开始于20世纪四五十年代2.商学院以外还广泛使用的对管理科学学科的叫法:运筹学3.管理科学研究提供给管理者什么?对问题涉及的定量因素进行分析并向开明的管理者提出建议4.管理科学以哪些领域作为基础?科学领域:数学,计算机社会领域:经济学5.什么是决策支持系统?辅助管理决策制定的交互式基于计算机的系统6.与管理问题有关的一般定量因素有哪些?生产数量,收入,成本,资源P11(2)一个例子:盈亏平衡分析步骤:分析问题——建立模型——敏感性分析,电子表格模型提供上述三者了方便的途径如果预测销售数量<盈亏平衡点,Q=0预测销售数量>盈亏平衡点,Q=预测销售数量敏感性分析目的:研究如果一个估计值发生了变化,将会给模型带来什么样的变化Min(a,b):取a,b中的最小值If(A,b,c):如果表达式A为真,则值为b,否则为c第二章(线性规划:基本概念)P31(3)在电子表格上建立恩德公司问题的模型1.开始在电子表格上建立线性规划模型时需要回答的三个问题:要做出的决策是什么?在做出这些决策上有哪些约束条件?这些决策的全部绩效测度是什么?2.以下各个单元格的作用数据单元格:显示数据的单元格可变单元格:需要做出决策的单元格输出单元格:依赖于可变单元格的输出结果的单元格目标单元格:在生产率做出决策时目标值定为尽可能大的特殊单元格3.该案例中每个输出单元格(包括目标单元格)的Excel等式的形式:可以表达为一个SUMPRODUCT函数,这里的每一项是一个数据单元格和可变单元格的乘积P33(4)电子表格的数学模型1.电子表格模型与代数模型相同的初始步骤:收集相关数据确定要做出的决策确定对这些决策的约束条件确定为这些决策的完全绩效测度把约束条件和绩效测度的口头描述转化为数据和决策表示的定量表达式2.用代数形式建立线性规划模型时,模型中需要引入代数符号来表示哪几类数量?用来表示绩效测度与决策4.模型的一个可行解是什么意思?决策变量的任何一个取值P41(5)求两问题变量的图解法1.图解法能用来求解带有几个决策变量的线性规划问题?只有两个2.什么是约束边界线?形成一个约束条件所允许的边界的直线什么是约束边界方程?形成一个约束条件所允许的边界的直线的方程可行域?比所有约束边界线更靠近原点的那些点成为可行解,可行解所在的区域成为可行域会作图求解P44(6)应用Excel求解线性规划问题(solver)1.用来输入目标单元格和可变单元格地址的对话框是什么?目标单元格:set target cell 可变单元格:by changing cells2.具体化模型的函数约束的对话框是什么?subjecttotheConstraints3.在solver中,哪些选项一般需要选定以求得一个线性规划模型?采用线性模型,假定非负P48(7)一个最小化的例子——利博公司广告组合问题3. 利博公司的目标?在达到市场份额的前提下,确定最低的总成本并决定要在每种媒体上做多少钱的广告4.在电子表格中设置目标单元格和可变单元格的基本原理是什么?目标单元格:?可变单元格:?P50(8)管理视角的线性规划1.管理部门一般对线性规划研究的技术细节设计深么?不深,没有必要2.一般问题有两个以上决策变量看,那么研究两个决策变量问题的图解法的意义?实际意义中没有价值,但对于传达线性规划设计确定约束边界和使目标值往尽可能大的这一方向移动的这一基本观念有很大价值3.开明的管理者关于线性规划应该知道哪些事项?需要知道线性规划是什么的一个良好直觉对线性规划的适用性和作用有一个正确的评价使得在合适的时候鼓励应用能够区分能胜任和以次充好的线性规划研究理解如何解释研究成果第三章(电子表格建模的艺术)(多简答和选择)P76(2)电子表格建模程序的概述1.当你不知道从哪里开始时,帮助你开始建立电子表格模型的方法是什么?设想一下的目标手工进行一些计算建立一个小的电子表格2.手工计算可从那两方面帮助你?首先,它能帮助理清输出单元格公式的形式其次,它可以帮助检验表格3.描述一下组织和编排电子表格的一个有用方法计划设想一下你的目标手工进行一些计算建立一个电子表格建模先建立一个小模型测试利用不同的测试数据分析模型的逻辑关系,将模型扩展为完整的模型分析评估建议的解和/或利用solver优化4.哪些数值应被输入数据单元格以测试模型?试着输入一些我知道输出单元格结果的数值5.单元格绝对坐标:当被填入其它单元格时,坐标不会改变的坐标,如&E&11单元格相对坐标:公式中单元格或者范围的坐标通常是基于他们相对含有公式的单元格的位置P81(3)建立一个好的电子表格模型的几个原则1.模型的哪个部分最先输入电子表格?在建立电子表格之前,先输入和仔细编排所有数据2.数据应包含在公式中,还是被单独输入数据单元格?单独3.区域名称是如何使公式和模型在Solver对话框中更易于理解?如何选择区域名称??1:用区域名称取代单元格地址写入公式中,使得公式更容易说明?2:选择“插入”菜单中“名称/定义”,然后输入一个名称,获得区域名称4.区分数据单元格,可变单元格,输出单元格,目标单元格有哪些方法?对不同类型的单元格使用不同的边框,单元格阴影5.在电子表格中完整的表达一个约束条件需要多少单元格?3P86(4)调试电子表格模型1.调试电子表格模型的第一个步骤是什么?在你预知输出单元格正确结果的情况下,将不同的数值输入可变单元格,然后观察模型的计算结果是否和预期结果一致2.如何输出单元格在数值和公式中的切换?pc上同时按control和~键(Mac上同时按Command和~键)3.对于一个给定的单元格,哪一个Excel工具可以用来追踪其从属单元格或引用单元格?“工具”——“审核/追踪从属单元格”,会显示出箭头,以观察单元格之间的联系建立一个好的电子表格所需原则:●首先输入数据●组织和清楚标识数据●每个数据输入唯一的单元格●将数据与公式分离●保持简单化●使用区域名称●使用相对和绝对坐标简化公式的复制●使用边框、阴影和颜色来区分单元格类型●在电子表格中显示整个模型第四章(线性规划:建模与应用)P97(1)案例研究——超级食品公司的广告混合问题4.在评价使用线性规划来表示该实际问题的准确性时,要做出的假设条件有哪些?允许有分数解包括目标单元格和可变单元格都可以用SUMPRODUCT函数以数据单元格和可变单元格表示(有时候只是可变单元格的加总)P106(2)资源分配问题1.资源分配问题的共性在线性规划模型中每一个函数限制均为资源限制,并且,每一种资源都可以表现为如下的形式:使用的资源数量<=可用的资源数量2.资源限制的形式如何?使用的数量<=可获得的数量3.为解决资源分配问题,必须收集哪三类数据?每种资源的可供量每一种活动所需要的各种资源的数量,对于每一种资源约活动的组合,单位活动所消耗的资源量必须首先估计出来每一种活动对总的绩效测度的单位贡献P113(3)成本收益平衡问题1.资源分配问题与成本收益平衡问题在管理目标上的差异是什么?资源分配问题:各种资源是受限制的因素(包括财务资源),问题的目标是(根据特定的总绩效测度)最有效的利用各种资源成本收益问题:管理层采取更为主动的姿态,他们指定哪些收益必须实现(不管如何使用资源),并且要以最低的成本实现所指明的收益2.成本收益平衡问题的共性是什么?所有的函数约束均为收益约束,并具有如下的形式:完成的水平>=最低可接受的水平3.收益限制的形式如何?完成的水平>=最低可接受的水平4.为解决成本收益平衡问题必须收集的三类数据包括哪些?每种收益的最低可接受水平(管理决策)每一种活动对每一种收益的贡献(单位活动的贡献)每种活动的单位成本P117(4)网络配送问题1.为什么这类问题为网络配送问题?这类问题通过配送网络能以最小的成本完成货物的配送,所以称之为网络配送问题2.网络配送问题的共性是什么?确定需求的约束,提供的数量=需要的数量3.确定需求的约束与资源约束和收益约束的区别是什么?确定需求的约束:提供的数量=需要的数量资源约束:使用的资源数量<=可用的资源数量收益约束:完成的水平>=最低可接受的水平P129(7)管理视角的建模1.为什么what-if分析是线性规划的研究中非常重要的一个组成部分?尽管可能使用许多变异的模型,但是对于一个特定版本的模型,一次只能求得一个解,但是在求得一个解以后,管理层会有很多问题:如果模型的参数估计有误怎么办?如果做出不同的似是而非的假设,问题的将会如何变化?如果管理方面所要求的某一选项没有被考虑在内,会产生怎样的结果?What-if分析有助于解决上述等相关问题P131(8)线性规划应用经典回顾1.比较三种线性规划的应用,注意各种类型的问题应该使用哪一类型的线性规划模型(资源分配、成本收益平衡、网络配送以及混合问题)第五章(线性规划的What-if分析)P158(3)只有一个目标函数系数变动1.目标函数系数允许变化范围的含义是什么?能使最优解保持不变的目标函数系数的变化范围称为目标函数系数允许变化范围2.如果目标系数的估计值不是实际值,并且不在允许变化范围之内,会有怎样的影响?最优解不正确3.在Excel的灵敏度分析报告中,目标函数系数一栏该如何解释?允许增加值和允许减少值一栏又该如何解释?目标函数系数一栏:目标函数系数的现值允许增加值和允许减少值一栏:是这些系数在最优的范围内,允许增加和减少的量(1E+30):10的三十次方的缩写,表示无穷大P165(4)目标函数系数同时变动的影响1.目标系数变动百分比法则中,变动的百分比指什么?各个变动系数占该系数允许变化范围允许变动量的百分比之和(有方向)2.在百分百法则中,如果变动的百分比之和不超过100%,最初的最优解将如何?不会改变3.在百分百法则中,如果变动的百分比之和超过100%,是否就意味着最初的最优解已经不再是最优解?不能确定最优解是否改变P172(5)单个约束条件变化的影响1.为什么要研究函数的约束条件的变化带来的影响?因为在建模时,还不能得到模型的这些参数的精确值更重要的是:这些常数往往不是由外界决定而是由管理层的政策决策决定的2.为什么函数约束的右端值可能改变?这些常数往往不是由外界决定而是由管理层的政策决策决定的,因此,在建模并求解之后管理者想要知道如果改变这些决策是否会提高最终的收益3.影子价格的含义是什么?约束常数增加微小的量1,使得目标函数增加的量4.用电子表格如何找到影子价格?用Solver表格呢?用灵敏度报告呢?电子表格:改变某一约束条件的值,重新按下Solver键,尝试在约束条件变化范围内找出每单位约束条件变化引起的目标函数值的变化即为影子价格Solver表格:?灵敏度报告:Shadow price栏5.为什么管理者会对影子价格感兴趣?管理者可以用影子价格评价,在影子价格的有效域内幅度不大的改变工作时间的各种决策6.影子价格是否也同样适用于减少函数约束右端值的数值的情况?是7.影子价格0对管理者来说是什么意思?该影子价格对应的约束条件在其变化范围内对目前的最优解没有影响8.为什么管理层会对可行域感兴趣??176(6)约束右端值同时变动的情形1.为什么要研究约束条件同时发生变化的情况?经常会出现需要我们考虑约束条件同时变动的情况。




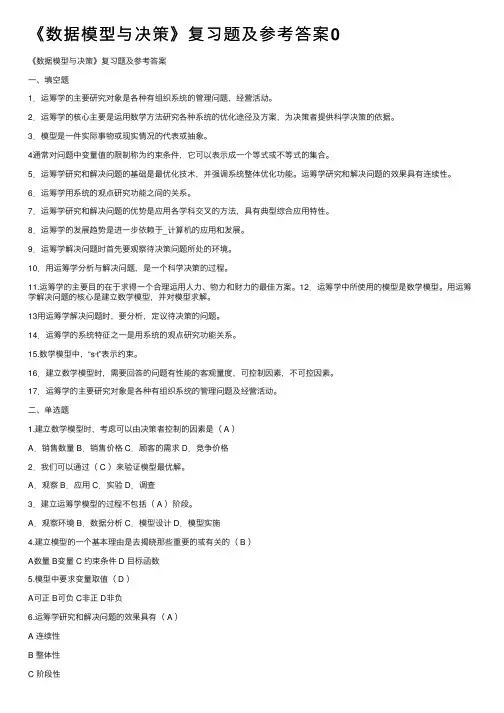
《数据模型与决策》复习题及参考答案0《数据模型与决策》复习题及参考答案⼀、填空题1.运筹学的主要研究对象是各种有组织系统的管理问题,经营活动。
2.运筹学的核⼼主要是运⽤数学⽅法研究各种系统的优化途径及⽅案,为决策者提供科学决策的依据。
3.模型是⼀件实际事物或现实情况的代表或抽象。
4通常对问题中变量值的限制称为约束条件,它可以表⽰成⼀个等式或不等式的集合。
5.运筹学研究和解决问题的基础是最优化技术,并强调系统整体优化功能。
运筹学研究和解决问题的效果具有连续性。
6.运筹学⽤系统的观点研究功能之间的关系。
7.运筹学研究和解决问题的优势是应⽤各学科交叉的⽅法,具有典型综合应⽤特性。
8.运筹学的发展趋势是进⼀步依赖于_计算机的应⽤和发展。
9.运筹学解决问题时⾸先要观察待决策问题所处的环境。
10.⽤运筹学分析与解决问题,是⼀个科学决策的过程。
11.运筹学的主要⽬的在于求得⼀个合理运⽤⼈⼒、物⼒和财⼒的最佳⽅案。
12.运筹学中所使⽤的模型是数学模型。
⽤运筹学解决问题的核⼼是建⽴数学模型,并对模型求解。
13⽤运筹学解决问题时,要分析,定议待决策的问题。
14.运筹学的系统特征之⼀是⽤系统的观点研究功能关系。
15.数学模型中,“s·t”表⽰约束。
16.建⽴数学模型时,需要回答的问题有性能的客观量度,可控制因素,不可控因素。
17.运筹学的主要研究对象是各种有组织系统的管理问题及经营活动。
⼆、单选题1.建⽴数学模型时,考虑可以由决策者控制的因素是( A )A.销售数量 B.销售价格 C.顾客的需求 D.竞争价格2.我们可以通过( C )来验证模型最优解。
A.观察 B.应⽤ C.实验 D.调查3.建⽴运筹学模型的过程不包括( A )阶段。
A.观察环境 B.数据分析 C.模型设计 D.模型实施4.建⽴模型的⼀个基本理由是去揭晓那些重要的或有关的( B )A数量 B变量 C 约束条件 D ⽬标函数5.模型中要求变量取值( D )A可正 B可负 C⾮正 D⾮负6.运筹学研究和解决问题的效果具有( A )A 连续性B 整体性C 阶段性D 再⽣性7.运筹学运⽤数学⽅法分析与解决问题,以达到系统的最优⽬标。
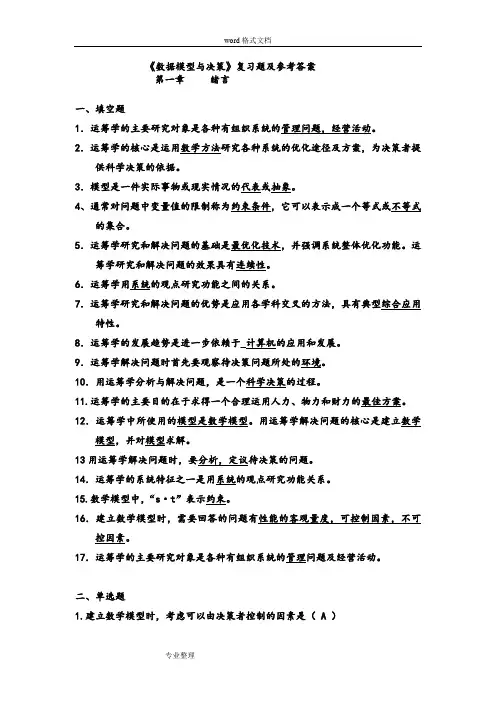
《数据模型与决策》复习题及参考答案第一章绪言一、填空题1.运筹学的主要研究对象是各种有组织系统的管理问题,经营活动。
2.运筹学的核心是运用数学方法研究各种系统的优化途径及方案,为决策者提供科学决策的依据。
3.模型是一件实际事物或现实情况的代表或抽象。
4、通常对问题中变量值的限制称为约束条件,它可以表示成一个等式或不等式的集合。
5.运筹学研究和解决问题的基础是最优化技术,并强调系统整体优化功能。
运筹学研究和解决问题的效果具有连续性。
6.运筹学用系统的观点研究功能之间的关系。
7.运筹学研究和解决问题的优势是应用各学科交叉的方法,具有典型综合应用特性。
8.运筹学的发展趋势是进一步依赖于_计算机的应用和发展。
9.运筹学解决问题时首先要观察待决策问题所处的环境。
10.用运筹学分析与解决问题,是一个科学决策的过程。
11.运筹学的主要目的在于求得一个合理运用人力、物力和财力的最佳方案。
12.运筹学中所使用的模型是数学模型。
用运筹学解决问题的核心是建立数学模型,并对模型求解。
13用运筹学解决问题时,要分析,定议待决策的问题。
14.运筹学的系统特征之一是用系统的观点研究功能关系。
15.数学模型中,“s·t”表示约束。
16.建立数学模型时,需要回答的问题有性能的客观量度,可控制因素,不可控因素。
17.运筹学的主要研究对象是各种有组织系统的管理问题及经营活动。
二、单选题1.建立数学模型时,考虑可以由决策者控制的因素是( A )A.销售数量 B.销售价格 C.顾客的需求 D.竞争价格2.我们可以通过( C )来验证模型最优解。
A.观察 B.应用 C.实验 D.调查3.建立运筹学模型的过程不包括( A )阶段。
A.观察环境 B.数据分析 C.模型设计 D.模型实施4.建立模型的一个基本理由是去揭晓那些重要的或有关的( B )A数量 B变量 C 约束条件 D 目标函数5.模型中要求变量取值( D )A可正 B可负 C非正 D非负6.运筹学研究和解决问题的效果具有( A )A 连续性B 整体性C 阶段性D 再生性7.运筹学运用数学方法分析与解决问题,以达到系统的最优目标。
第一章1社会科学研究中,积极借助定量分析可达到的目的:1、通过引进数量研究方法,可以在一定程度上改变社会科学的研究面貌。
2、通过增加数量研究的成分,可以改变社会科学工作者的身份。
3、数量分析法可以为经济政策和管理措施的制定提供实验室的论证与检验。
4、数量分析法可以提高研究结论的精确化水平。
2模型的概念:对客观事物的一种描述、模仿或抽象。
3数据、模型与决策的关系:1、数据、模型共同服务于决策分析。
2、从应用的角度讲,统计方法比较强调实证性做法。
统计的语言是数据,没有大量的、客观准确的数据资料,统计决策分析只能停留在纯理论的阶段,无法形成具体的分析结论。
3、数据资料本身存在不系统、不充分、不完备的问题。
因此,背景数据必须经过科学的编辑处理汇总提炼才能用于决策。
对此,模型起着重要的转化作用。
4原则上,运用定量方法开展决策分析需要考虑以下要求:1、以定性分析为先导。
2、以管理决策为根本目标。
3、以科学方法论为指导。
4、以数学模型为主要工具。
5、以软件应用为辅助性手段。
5运用数量分析管理手段进行管理决策需要经过的步骤:1、明确对象。
2、建立决策分析模型。
3、搜集数据资料。
4、模型求解和检验。
5、结果解读和敏感性分析。
6、形成决策分析报告。
第二章1搜集数据资料之前,提纲的内容:1、研究目标。
2、研究对象。
3、研究变量。
4、数据资料搜集的渠道。
5、资料的最终用途。
2统计数据资料的来源:1、直接来源:把搜集第一手统计资料所采用的方法称为直接来源。
2、间接来源:把搜集第二手资料的渠道称为间接来源。
3普查的概念、作用和特点:普查是专门组织的、一次性的全面调查,主要用来搜集某一时点或一定时期内现象总量的资料。
通过普查所得到的资料,在了解国情国力、制订社会发展规划、确定重大决策方面,发挥重要作用。
特征:1、定期举行。
2、依法进行。
3、应用广泛。
4、质量控制。
5、项目增多。
6、计算机介入。
4随机抽样调查的概念、优点:抽样调查既具备一般非全面调查的优点,又可以通过科学推算达到对研究对象的认识,因而是一种最常用、最重要的获取统计资料的手段。
CHAPTER 15COMPUTER SIMULATION: BASIC CONCEPTS Review Questions15.1-1 Computer simulation imitates the operation of a stochastic system by using thecorresponding probability distributions to randomly generate the various events that occur in the system.15.1-2 Computer simulation typically takes a lot of time and effort, which tends to berelatively expensive.15.1-3 Computer simulation typically is used when the stochastic system involved is toocomplex to be analyzed satisfactorily by mathematical models.15.1-4 A random number is a number between 0 and 1 which is generated in such a waythat every possible number within this interval has an equal chance of occurring.These numbers are then used to generate random occurrences from probability distributions.15.1-5 The inverse transformation method is a method for generating random observationsfrom a probability distribution. The first step is to generate a uniform random number r. The second step is to find the value of x such that F(x)=r. The value of x is the desired random observation from the probability distribution.15.2-1 Herr Cutter must decide whether or not to hire an associate.15.2-2 The first rule of thumb is that in a well run barbershop with a long-establishedclientele, these loyal customers are willing to tolerate an average waiting time of about 20 minutes until the haircut begins. The second rule of thumb is that in a well run barbershop, new customers are willing to tolerate an average waiting time of about 10 minutes before the haircut begins.15.2-3 The probability distributions for service times and interarrival times need to beestimated.15.2-4 Uniform random numbers and the inverse transformation method are used togenerate random observations from these distributions.15.2-5 A simulation clock is a variable in the computer program that records how muchsimulated time has elapsed.15.2-6 The main procedure for advancing the time on the simulation clock is called next-event time advance.15.2-7 The state of the system is N(t)=number of customers in the system at time t.15.2-8 The only difference comes when the next-event time-advance procedure isdetermining which event occurs next. Instead of just two possibilities for this next event, there are three.15.3-1 Fritz began by simulating the current operation of the shop. This was largely to testthe validity of his simulation model.15.3-2 The Queueing Simulator obtains a point estimate and a 95% confidence interval.15.3-3 Fritz compared the results from the simulation run with the analytical results available.He also asked Herr Cutter whether the numbers seem consistent with what he has been experiencing in the barbershop.15.3-4 Fritz’s simulation model assumes that the system has an infinite queue and that oncestarted, the system operates continually without ever closing and reopening. A simulation model does not need to be a completely realistic representation of the real system.15.3-5 It is estimated that Herr Cutter’s income would eventually increase if he adds anassociate.15.4-1 The case study is an example of queueing system simulation.15.4-2 The management science team simulated various redesigns of the company’s entiresupply chain.15.4-3 The probability of meeting a deadline is being estimated when computer simulation isused to supplement the PERT three-estimate approach.15.4-4 How many machines of each type should be provided?15.4-5 A new distribution system with central dispatching was being designed.15.4-6 Computer simulation provides a probability distribution of the return from theinvestment.15.4-7 Simulating the use of hospital resources when treating patients with coronary heartdisease has been done.15.4-8 An automated system to handle mail was being planned. It was projected to achievelabor savings of over $4 billion per year.15.5-1 The management science team needs to begin by meeting with management.15.5-2 A simulation model often is formulated in terms of a flow diagram.15.5-3 Before constructing a computer program, the management science team shouldengage the people most intimately familiar with how the system will operate in checking the accuracy of the simulation model.15.5-4 A general-purpose simulation language is capable of programming almost any kindof simulation model. Applications-oriented simulators are designed for simulating fairly specific types of systems.15.5-5 In an animation, key elements of a system are represented in a computer display byicons that change shape, color or position when there is a change in the state of the simulation system.15.5-6 Will the measures of performance for the real system be closely approximated by thevalues of these measures generated by the simulation model?15.5-7 Each simulation run can be viewed as a statistical experiment that is generatingstatistical observations of the performance of the simulated system.15.5-8 The output from the simulation run now provide statistical estimates of the desiredmeasures of performance for each system configuration of interest.15.5-9 Presentation is usually done through both a written report and a formal oralpresentation to the managers responsible for making the decisions regarding the system under study.Problems15.1 a) Let the numbers 0.0000 to 0.4999 correspond to heads and the numbers 0.5000to 0.9999 correspond to tails. The random observations for throwing an unbiasedcoin are 0.3039 = heads, 0.7914 = tails, 0.8543 = tails, 0.6902 = tails, 0.3004 =heads, and 0.0383 = heads.b) Let the numbers 0.0000 to 0.5999 correspond to strikes and the numbers 0.6000to 0.9999 correspond to balls. The random observations for pitches are 0.3039 =strike, 0.7914 = ball, 0.8543 = ball, 0.6902 = ball, 0.3004 = strike, and 0.0383 =strike.c) Let the numbers 0.0000 to 0.3999 correspond to green lights, the numbers 0.4000to 0.4999 correspond to yellow lights, and the numbers 0.5000 to 0.9999correspond to red lights. The random observations for lights are 0.3039 = green,0.7914 = red, 0.8543 = red, 0.6902 = red, 0.3004 = green, and 0.0383 = green.15.2 a) Answers will vary.b)c) 14 replications:d)1000 replications:15.3 a) Answers will vary.b) Let the numbers 0.0000 to 0.4999 correspond to heads and the numbers 0.5000to 0.9999 correspond to tails.Group 1: 0.7142 = T, 0.4546 = H, 0.3142 = HGroup 2: 0.1722 = H, 0.0932 = H, 0.3645 = HGroup 3: 0.1636 = H, 0.7572 = T, 0.3067 = HGroup 4: 0.9520 = T, 0.8548 = T, 0.7464 = TGroup 5: 0.9781 = T, 0.6584 = T, 0.8829 = TGroup 6: 0.7861 = T, 0.0679 = H, 0.9296 = TGroup 7: 0.4430 = H, 0.1223 = H, 0.4530 = HGroup 8: 0.3972 = H, 0.9289 = T, 0.2195 = HGroups with 0 heads=2, with 1 heads=1, with 2 heads=3, with 3 heads=2c)d) Answers will vary. The following 8 replications have 0 replications with 0 heads(0/8), 5 replications with 1 head (5/8), 2 replication with 2 heads (2/8), and 1 replication with 3 heads (1/8). This is not very close to the expected probabilitye) Answers will vary. With the following 800 replications, 97 have 0 heads (97/800),324 have 1 head (324/800), 289 have 2 heads (289/800), and 90 have 3 headsthe expected probability distribution.15.4 a) If it is raining then let the numbers 0.0000 to 0.5999 correspond to rain for thenext day and 0.6000 to 0.9999 correspond to clear for the next day. If it is clearthen let the numbers 0.0000 to 0.7999 correspond to clear for the next day andthe numbers 0.8000 to 0.9999 correspond to rain for the next day.b)15.5 a)b)one simulation of 25 replications.c) Answers will vary. For these 25 tosses, a loss occurs on toss 2, a win on toss 3, aloss on toss 5, a loss on toss 11, a loss on toss 17, a win on toss 21, a loss on toss23, and win on toss 25.15.6 a) Prob(2) = 4/25; Prob (3) = 7/25; Prob(4) = 8/25; Prob (5) = 5/25; Prob(6) = 1/25b) Mean = (2)(4/25) + (3)(7/25) + (4)(8/25) + (5)(5/25) + (6)(1/25) = 3.68 stovesc) Random numbers can be assigned to the various sales levels to simulate dailysales. Let the numbers 0.000 to 0.1599 correspond to 2 stoves being sold in a day,the numbers 0.1600 to 0.4399 correspond to 3 stoves, the numbers 0.4400 to0.7599 correspond to 4 stoves, the numbers 0.7600 to 0.9599 correspond to 5stoves, and the numbers 0.9600 to 0.9999 correspond to 6 stoves.d) Sales are 0.4476 = 4 stoves, 0.9713 = 6 stoves, and 0.0629 = 2 stoves on the threedays. The average is 4, which is 0.32 higher than the mean obtained in part b.e) Answers will vary. The following 300-day simulation yielded an average demand15.7 a)xClaimb) F (x ) = (x + 10) / 50 = 0.0965 when x = –5.18 F (x ) = (x + 10) / 50 = 0.5692when x = 18.46F (x ) = (x + 10) / 50 = 0.6658 when x = 23.29c) = –10 + 50*RAND()15.8 a)F(x)x Minutes17.09b) F(x) = (x–3) / 5 = 0.6506 when x= 6.25F(x) = (x–3) / 5 = 0.0740 when x= 3.37F(x) = (x–3) / 5 = 0.8443 when x= 7.22F(x) = (x–3) / 5 = 0.4975 when x= 5.49F(x) = (x– 3) / 5 = 0.8178 when x = 7.09c) Average = 5.88 which is higher that the mean of 5.5yielded an average of 5.426.d)15.9 a) Let the numbers 0.0000 to 0.3999 correspond to a minor repair and 0.4000 to0.9999 correspond to a major repair. The random numbers then indicate 0.7256 =major, 0.0817 = minor, 0.4392 = major.Using the random numbers, the average length of the three repairs is then1.2243 hours (first major repair)0.9503 hours (minor repair)1.6104 hours (second major repair)The average repair time is then (1.224+ 0.950 + 1.610) / 3 = 1.26 hours.b)12xHoursc) F(x) = 0.4x when 0≤ x ≤1F(x) = 0.4 + 0.6(x–1) when x≥ 1F(x) = 0.2243 →x= 0.561 hours F(x) = 0.9503 →x= 1.917 hours F(x) = 0.6104 →x= 1.351 hoursThe average repair time is then (0.561 + 1.917 + 1.351) / 3 = 1.28 hours.d) F(x) = 0.7757 →x= 1.626 hoursF(x) = 0.0497 →x= 0.124 hours F(x) = 0.3896 →x= 0.974 hours The average repair time is then (1.626 + 0.124 + 0.974) / 3 = 0.91 hours.e) The average repair time is(0.561 + 1.917 + 1.351 + 1.626 + 0.124 + 0.974) / 6 = 1.09 hours.f) The method of complementary random numbers in part e gave the closestestimate. It performs well because using complements helps counteract the more extreme random numbers (such as 0.9503).g) Results will vary. The following 300-day simulation using the method ofcomplementary random numbers yielded an overall average service time of 1.103minutes.0.4)/0.6).The formula in E4 is =IF(D4<0.4, D4/0.4, 1+(D4–0.4)/0.6).15.10 a) Let the numbers 0.0000 to 0.3999 correspond to no claims filed, 0.4000 to 0.7999correspond to small claims filed, and 0.8000 to 0.9999 correspond to large claimsfiled. The random numbers then indicate 0.7256 = small claim, 0.0817 = no claim,0.4392 = small claim.Using the random numbers, the average size of each claim is then(0.2243)($2000)=$448.60 (small claim)$0 (no claim)(0.6104)($2000)=$1,220.80 (small claim)The average claim is then ($448.60 + $1,220.80) / 2 = $834.70.b)$2000$20,000xClaimc) F(x) = 0 if x< 0F(x) = 0.4 + (0.4x / 2,000) when 0 ≤ x≤ 2,000 F(x) = 0.8 + [0.2(x–2,000) / 18,000] when 2,000 ≤ x≤ 20,000F(x) = 0.2243 →x= $0 F(x) = 0.9503 →x= $15,527 F(x) = 0.6104 →x= $1,052The average claim is then ($0 + $15,527 + $1052) / 3 = $5526.33.d) F(x) = 0.7757 →x= $1,880F(x) = 0.0497 →x= $0 F(x) = 0.3896 →x= $0 The average claim is then ($1,880 + $0 + $0) / 3 = $626.67 hours.e) The average claim is($0 + $15,527 + $1052 + $1880 + $0 + $0) / 6 = $3076.50.f) The method of complementary random numbers in part e gave the closestestimate. It performs well because using complements helps counteract the more extreme random numbers (such as 0.9503).g) Results will vary. The following 300-day simulation using the method ofcomplementary random numbers yielded an overall average claim size of$2600.0.4),2000+(18000/0.2)*(B4-0.8))).15.11 a)b) If cell C4 contains the uniform random number, then the excel function would be=IF(C4<0.2, 7+(2/0.2)*C4, IF(C4<0.8, 9+(2/0.6)*(C4-0.2), 11+(2/0.2)*(C4-0.8))). 15.12 a) F(x) = x2 = r⇒x=r.b)c)d) =SQRT(RAND()).15.13 a)Number of Customers in theSystemElapsed Time (minutes)1822b) Estimates:P 0 = 5 / 32 = 0.156 P 1 = (3+4+1+7) / 32 = 0.469 P 2 = (5+1+2+3) / 32 = 0.344 P 3 = 1 / 32 = 0.031 L = (0)(0.156) + (1)(0.469) + (2)(0.344) + (3)(0.031) = 1.25 customers L q = (0)(0.156 + 0.469) + (1)(0.344) + (2)(0.031) = 0.406 customersW q = (0 + 5 + 2 + 3 + 3)/5=2.6minutesW = (8 + 11 + 4 + 7 + 10) / 5 = 8 minutesc)Number of Customers in theSystemElapsed Time (minutes)1814d) Estimates:P0= (5+3) / 29 = 0.276 P1= (3+1+1+3+7) / 29 = 0.517 P2= (5+1) / 29 = 0.207 L= (0)(0.276) + (1)(0.517) + (2)(0.207) = 0.931 customers L q= (0)(0.276 + 0.517) + (1)(0.207) = 0.207 customersW q= (0+0+0+0+0) / 5 = 0 minutes W = (8+6+2+4+7) / 5 = 5.4 minutes15.14 a) 1. A description of the components of the system. The system is a single-serverqueueing system with the crew as the server and machines as the customers. Theservice time has a uniform distribution over the interval from 0 to twice the mean,and interarrival time distribution has an exponential distribution with a mean of 5hours.2. A simulation clock will record the amount of simulated time that will elapse.3. The state of the system will be defined as N(t) = number of machines needingrepair at time t.4. The breakdowns and repairs that occur over time are randomly generated bygenerating random observations from the distributions of interarrival and servicetimes.5. Adjust the state of the system when a breakdown or repair occurs by:Reset N(t)=N(t)+1,if a breakdown occurs at time t N(t)-1,if a repair occurs at time t⎧⎨⎩6. Advance the time on the simulation clock by using the next-event time advance procedure.b)For these simulation runs, 3 servers was enough to get the average waiting timebefore repair below 3 hours.c)For these simulation runs, 3 servers was enough to get the average waiting time before repair below 3 hours.d)3 servers is enough to get the average waiting time before repair down to 3 hours.15.15a) Only the third customer has to wait before beginning a haircut. He waits for 2.6 minutes.W q = (2.6 minutes) / 10 = 0.26 minutes for this simulation.b)Number of Customersin theSystemElapsed Time (minutes)19.621.044.523.677.8114.3147.5138.6174.4187.4199.4206.215.16 a)Number ofCustomersin theSystemElapsed Time (minutes)b) Estimates:P0= 10 / 100 = 0.1P1= (17+15+18) / 100 = 0.5P2= (24 + 16) / 100 = 0.4P3 = 0 / 100 = 0c) Estimates:L= 1(0.5) + 2(0.4) + 3(0) = 1.3L q = 1(0.4) + 2(0) = 0.4d) Estimates:W= (sum of observed times) / (number of observed times) =(41 + 55 + 34) / 3 = 43.33 minutes.W q= (sum of observed waiting times) / (number of observed times) = (0 + 24 + 16) / 3 = 13.33 minutes.15.17 a)b)c)d) Two tellers provides reasonable wait times, with both the original arrival rate (W q =0.3 minutes) and the higher arrival rate in part c (W q = 0.6 minutes).15.18c)d)e)f) This option significantly decreases the waiting time for German cars without theg)The results of the simulation were quite accurate for all but part b, where only 100 arrivals were simulated. This suggests that more than 100 arrivals should be simulated.h) Answers will vary. The option of training the two current mechanics significantlydecreases the waiting time for German cars, without a significant impact on the wait for Japanese cars, and does so without the added cost of a third mechanic.Adding a third mechanic lowers the average wait for German cars even more, but comes with the added cost of the third mechanic.15.19c)d)e)The new inspection equipment would drastically reduce the average waiting time for both monitors (7.0 minutes to 1.3 minutes) and printers (7.1 minutes to less than 1.1 minutes).15.20 a)b)15.21 a)qb)qc) qd) qe) The results from a computer simulation can be quite sensitive to the probabilitydistribution of service times. In a to d, for example, the waiting times were typically 20% to 30% lower for the computer simulation runs than for the queueing models.Cases15.1 Current Situation: A simulation run (shown below) indicates that the average numberof jobs in the system is 2.0. Of these, half will be platen castings (1) and half will be housing castings (1). The waiting cost is therefore ($200)(1) + ($100)(1) = $300 / hour.Proposal 1: A simulation run (shown below) indicates that the average number of jobs in the system with three planers is approximately 1.4. Of these, half will be platen castings (0.7) and half will be housing castings (0.7). The waiting cost is therefore ($200)(0.7) + ($100)(0.7) = $210 / hour. The savings ($90 / hour) is substantially more than the added cost of the third planer ($30 / hour), so this looks to be worthwhile.The net savings would be $60 / hour.Proposal 2: A simulation run (shown below) indicates that the average number of jobs in the system with constant interarrival times is approximately 1.4. Of these, half will be platen castings (0.7) and half will be housing castings (0.7). The waiting cost is therefore ($200)(0.7) + ($100)(0.7) = $210 / hour. The savings ($90 / hour) is somewhat more than the added cost of changing the preceding production cost ($60 / hour). The net savings ($30) is less than for proposal 1, so this option is less worthwhile.Proposal 1 and 2: A simulation run (shown below) indicates that the average number of jobs in the system with both three planers and constant interarrival times is approximately 1.33. Of these, half will be platen castings (0.665) and half will be housing castings (0.665). The waiting cost is therefore ($200)(0.665) + ($100)(0.665) = $200 / hour. The savings ($85 / hour) is less than the combined cost of adding a third planer and changing the preceding production cost ($90 / hour), so this combined option does not appear to be worthwhile.Overall recommendation: Proposal 1 appears to be the most worthwhile, with a net savings of about $36 / hour over the current situation. Other proposals that may be worth looking into should include giving priority to platen castings, because of the higher waiting cost for that type of job.15.2 a)Inventory cost = (7.5 + 3.6)($8/hour) = $88.80 / hourMachine cost = (10)($7/hour) = $70 / hourInspector cost = $17 / hourTotal cost = $175.80 / hourb) Proposal 1 will increase the in-process inventory at the presses to 10.6 sheetsThe in-process inventory at the inspection station will not change.Inventory cost = (10.6 + 3.6)($8/hour) = $113.60 / hour Machine cost = (10)($6.50) = $65 / hour Inspector cost = $17 / hourTotal cost = $195.60 / hourThis total cost is higher than for the status quo so should not be adopted. The main reason for the higher cost is that slowing down the machines won’t change in-process inventory for the inspection station.15-41c) Proposal 2 will increase the in-process inventory at the inspection station to 4.2The in-process inventory at the presses will not change.Inventory cost = (7.5 + 4.2)($8/hour) = $93.60 / hour Machine cost = (10)($7/hour) = $70 / hour Inspector cost = $17 / hourTotal cost = $180.60 / hourThis total cost is higher than for the status quo so should not be adopted. The main reason for the higher cost is the increase in the service rate variability (Erlang rather than constant) and the resulting increase in the in-process inventory.15-42d) They should consider increasing power to the presses (increasing there cost to$7.50 per hour but reducing their average time to form a wing section to 0.8Inventory cost = (5.7 + 3.6)($8/hour) = $74.40 / hour Machine cost = (10)($7.50/hour) = $75 / hour Inspector cost = $17 / hourTotal cost = $166.40 / hourThis total cost is lower than the status quo and both proposals.15-43。