英文图表描述.
- 格式:ppt
- 大小:1.11 MB
- 文档页数:46
今天我们所要关注的是运动图表,无论是什么题目的运动图表,无论题出的多难,我们都要清醒的认识到,那就是考官也逃不出如下的5个范畴,它们分别是运动范畴,程度范畴,时间范畴,数据范畴与连接范畴。
在运动范畴中存在着如下的8种运动趋向:1、保持平稳:我们可以使用的套用结构有: stay stable/ remain steady举例:表示人口数量保持平稳的时候可以写: the number of population stayed stable。
/the number of population remained steady2、上升/增加:我们可以使用的套用结构有:rise/ climb/ increase/ ascend/mount/aggrandize(增加) 举例:人口上升:the number of population increased/ascended/mounted等等。
3、下降/减少:我们可以使用的套用结构有:fall/ drop/ decrease/ descend/ decline举例:人口减少:the number of population decreased/ declined全国注册建筑师、建造师考试备考资料历年真题考试心得模拟试题4、下降后保持平稳:这个线段前面是向下的,后面是平的,在表示这个平的时候我们就不可以使用remain steady了,我们要使用的结构是bottom out举例:人口下降后保持平稳:the number of population decreased and bottomed out5、上升后保持平稳:前面的上升我们就不用说了,但是在上升以后保持平稳,我们需要使用level off举例:人口上升后保持平稳:number of population mounted and leveled off6、复苏:前面下降了以后,然后就上升了,这两条线段的连接点就叫复苏。
学术英语图表描述范文英文回答:Chart Description.The provided chart illustrates the average number of visitors to a particular national park over a six-year period. The data is presented in a bar graph, with the X-axis representing the year and the Y-axis representing the number of visitors in millions.The chart reveals a steady increase in the number of visitors to the park over the six-year period. In 2015, the park received approximately 2 million visitors. This number rose to around 2.5 million in 2016 and continued to increase each year thereafter. In 2020, the park welcomed an estimated 3.5 million visitors, marking a significant increase from the previous year.It is evident from the chart that the number ofvisitors to the park has grown substantially since 2015. This growth trend suggests that the park is becoming increasingly popular, possibly due to factors such as improved accessibility, increased marketing efforts, or the introduction of new attractions and facilities.中文回答:图表描述。
描述图表的英语范文雅思英文回答:The given bar chart depicts the average monthly expenditure of households in five different income groupsin a particular region. The data is presented in British pounds.The highest income group, with monthly earnings exceeding £5,000, spends the most on average, at £3,900 per month. This group also has the highest expenditure on housing, transport, food, and leisure activities.The second highest income group, with earnings between £4,000 and £5,000, spends an average of £3,200 per month. Their expenditure pattern is similar to that of the highest income group, with significant outlays on housing, transport, and food.The middle income group, with earnings between £3,000and £4,000, spends an average of £2,600 per month. Their expenditure is relatively evenly distributed acrossdifferent categories, with slightly higher spending on housing.The fourth income group, with earnings between £2,000 and £3,000, spends an average of £2,100 per month. They allocate a significant portion of their budget to housing and food, with less spending on transport, clothing, and leisure activities.The lowest income group, with earnings below £2,000, spends the least on average, at £1,500 per month. The majority of their expenditure goes towards housing and food, with limited spending on other categories.In summary, the bar chart shows that higher income households spend more on a wider range of goods and services, while lower income households spend less and prioritize essential expenses such as housing and food.中文回答:给定的柱状图描述了某个地区五个不同收入组家庭的平均每月开支。
描述图表英文作文1. The bar chart displays the percentage of people in different age groups who use social media platforms. It is evident that the younger age groups have a higher usage rate compared to the older age groups. 。
2. Moving on to the line graph, it illustrates the fluctuation in the average temperature throughout the year. We can observe that there is a clear seasonal pattern, with the highest temperatures occurring in the summer months and the lowest temperatures in the winter months. 。
3. The pie chart represents the distribution of household expenses. It is immediately noticeable that the largest portion of the budget is allocated to housing, followed by transportation and food. 。
4. Let's now turn our attention to the scatter plot, which shows the relationship between hours of studying and exam scores. Interestingly, there seems to be a positivecorrelation between the two variables, indicating that students who study more tend to achieve higher scores. 。
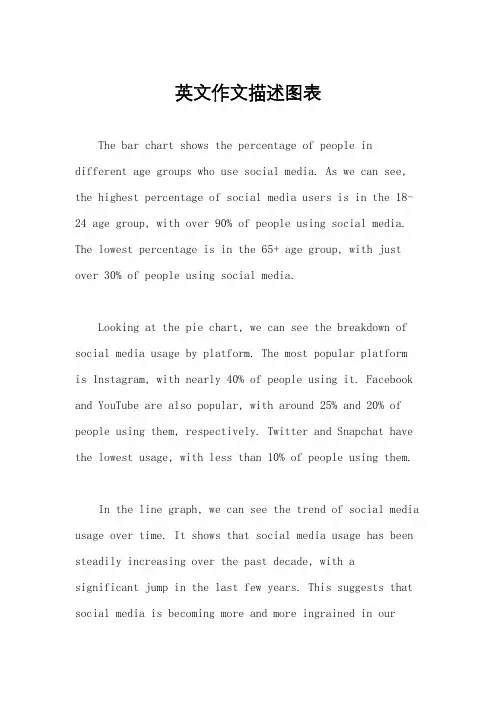
英文作文描述图表The bar chart shows the percentage of people in different age groups who use social media. As we can see, the highest percentage of social media users is in the 18-24 age group, with over 90% of people using social media. The lowest percentage is in the 65+ age group, with just over 30% of people using social media.Looking at the pie chart, we can see the breakdown of social media usage by platform. The most popular platformis Instagram, with nearly 40% of people using it. Facebook and YouTube are also popular, with around 25% and 20% of people using them, respectively. Twitter and Snapchat have the lowest usage, with less than 10% of people using them.In the line graph, we can see the trend of social media usage over time. It shows that social media usage has been steadily increasing over the past decade, with asignificant jump in the last few years. This suggests that social media is becoming more and more ingrained in ourdaily lives.The scatter plot shows the relationship between social media usage and happiness. Interestingly, it seems that there is a slight negative correlation between the two –as social media usage increases, happiness levels seem to decrease. However, it's important to note that correlation does not imply causation, and there could be many other factors at play.In conclusion, the data shows that social media usage is widespread, especially among younger age groups, and is continuing to grow. However, there may be a potential downside in terms of its impact on happiness. It's important for us to be aware of this and to use social media in a way that enriches our lives rather than detracts from it.。
1.我们可以从图表上看出:托雅的女生比例远远高于男生所占比例。
As can be seen from the chart, the percentage of female students was far higher than that of male students at Toya.2.从图表反映的情况来看:读雅思的人数远远超过读托福的,同时,读托福的人数一直呈现平稳上升趋势。
As can be seen from the chart, those who chose to study for IELTS far outnumbered those choosing to study for TOEFL. Meanwhile, the number of those who chose to study for TOEFL was on a steady rise.3.从图表反映的情况来看:托雅学生在饭店用餐的频率在不同的月份呈现出了相应的波动趋势。
As can be seen from the diagram, the frequency of Toya students eating at restaurants revealed a trend of fluctuations in different months.4.从图表反映的情况来看:托雅男教师所承担的每周工作量要高于女教师的。
As can be seen from the charts, the weekly workload borne by male teachers outweighed that of female teachers at Toya.5.从整个图表反映的情况来看:托雅总部以及五个分校的营业收入都呈现出了快速的增长趋势。
As can be seen from the chart, the sales of Toya Headquarter and the five branch schools all revealed a trend of fast increase across the board.6.从整个图表反映的情况来看:托雅教师的收入状况呈现出了稳步增长的总态势。

有关图表、数据的英文表达图表”的多种表达及区别table (表格表格))通常指有格子的表格a table of contents :目录graph (曲线图曲线图))通常用来表示发展趋势的直线或曲线的变化chart (海图海图))通常用来表示柱状图(column chart )或者饼状图形(pie chart ) flow chart :流程图diagram (图解图解、、图例图例))通常指为演示或解释某物如何工作或者说明各部分之间关系而设计的平面图、示意图或外形图等a diagram showing how the machine works :绘图说明机器如何运转描述”的多种表达show 、display(表示)illustrate(图表说明)describe (描述、描写)indicate (显示、指出、预示) reveal (揭示)有关“总体大趋势”的表示There will be an overall / a general increasing / falling trend for the revenue in the coming year. 明年的营业额将持普遍增加/下降的趋势。
The trend was towards an increase / a decrease in the sales over the past 5-year period. 过去五年内营业额保持一个上升/下降的态势。
The number has taken an upward / downward trend since last year.自去年开始人数有增加/下降的趋势。
This trend continues throughout the graph. 这一趋势贯穿整个图表。
有关“保持不变或一样”的表示Stay, remain, keep …the same, stable, steady, unchanged, constant, flat, stationary The monthly sales remained a steady uptrend over the past 3 quarters.Level off 稳定The output appeared to level off in the second half of the year and remained constant at about 1,000 units per day.Hover around 盘旋于The rate hovers around 70%, compared with 60% a year ago.有关“变化”的表示增加increase, rise, grow, rocket, go up, shoot up, climb + by …(增加了)/ + to …(增加到)达到come to, reach, jump to极值peak at …, the highest/lowest point, the top/bottom of减少、下降decrease, decline, reduce, fall, go down, drop, crash, plummet(垂直下落), plunge(跳落), dive(跳水)恢复come back to …, make a comeback, recover from …, regain its increasing trend …上下波动fluctuate between …and …, go up and down, has been experienced ups and downs有关“比例”的表示占represent, occupy, comprise, dominateaccount for, make up, take upA, which makes up 20%, ranks first among the four factors; then next is B with 15%, followed by C, representing 10%, and finally comes D, at 5%.The proportion of A to B is X to Y.A 和B 的比例是X 比Y。
:(地图、天体图、布局图、专用图、图谱)Battle map 作战地图Highway map 公路图Genetic map 基因图谱(图形、平面图)Geometric(al) figure 几何图形Dimension figure 尺寸图Plane figure 平面图)(图案、图型、图样)Checkboard pattern 棋盘型图案Recording pattern 录像图型Circular pattern 圆形图样(草图、略图、简图)Eye sketch 目测草图Topographic sketch 地形略图Dimensional sketch 尺寸简图&shematic(图解、示意图、流程图、电路图)Flow scheme 流程图Induction scheme 感应电路图(草图)Chisel draft 雕刻前在石头上画出边缘轮廓草图(曲线图表)Algebraic curve 代数曲线Comfort curve 湿度舒适曲线《(曲线图表)Funtional graph 函数图(亦称plot)Bar graph 条形图(也称chart)(视图)Plane view 平面视图(几何图)Plane geometry 平面几何Solid geometry 立体几何图<(航海图、图表)Aeronautical chart 领航图Demographic data chart 人口统计图表Pie chart 饼图Bar chart 柱图(工程图、插图)Drawing 建筑图Explanatory drawing 说明(插)图*(布局图、规划图)1、图形种类及概述法:泛指一份数据图表:a data graph(曲线图)/chart/diagram/illustration/table饼图:pie chart直方图或柱形图:bar chart/histogram趋势曲线图:line chart/curve diagram、表格图:table流程图或过程图:flow chart/sequence diagram程序图:processing/procedures diagram2、常用的描述用法The table/chart diagram/graph shows (that)According to the table/chart diagram/graphAs (is) shown in the table/chart diagram/graphAs can be seen from the table/chart/diagram/graph/figures,;figures/statistics shows (that)……It can be seen from the figures/statisticsWe can see from the figures/statisticsIt is clear from the figures/statisticsIt is apparent from the figures/statisticstable/chart/diagram/graph figures (that)……table/chart/diagram/graph shows/describes/illustrates3、图表中的数据(Data)具体表达法《数据(Data)在某一个时间段固定不变:fixed in time在一系列的时间段中转变:changes over time持续变化的data在不同情况下:增加:increase/raise/rise/go up ……减少:decrease/grow down/drop/fall ……波动:fluctuate/rebound/undulate/wave ……稳定:remain stable/stabilize/level off ……}二、相关常用词组1、主章开头图表类型:table(表格)、chart(图表)、diagram(图标)、graph(多指曲线图)、column chart(柱状图)、pie graph(饼图)、tree diagram(树形图)描述:show、describe、illustrate、can be seen from、clear、apparent、reveal、represent 内容:figure、statistic、number、percentage、proportion2、表示数据变化的单词或者词组rapid/rapidly 迅速的,飞快的,险峻的dramatic/dramatically 戏剧性的,生动的/significant/significantly 有意义的,重大的,重要的sharp/sharply 锐利的,明显的,急剧的steep/steeply 急剧升降的steady/steadily 稳固的,坚定不移的gradual/gradually 渐进的,逐渐的slow/slowly 缓慢的,不活跃的slight/slightly 稍微的、略微地stable/stably 稳定的,3、其它在描述中的常用到的词significant changes 图中一些较大变化noticeable trend 明显趋势during the same period 在同一时期grow/grew 增长distribute 分布unequally 不相等地in the case of 在……的情况下【in terms of/in respect of/regarding 在……方面in contrast 相反,大不相同government policy 政府政策market forces 市场力量measuren n.尺寸,方法,措施v.估量,调节forecast n.先见,预见v.猜测?三、图表描述套句精选table shows the changes in the number of……over the period from……to……该表格描述了在……年之……年间……数量的变化。
图表英文作文描述1. The bar chart shows the percentage of students participating in different extracurricular activities. It's clear that the most popular activity among students is sports, with nearly 60% of students participating. This is followed by music, which attracts around 30% of students. Other activities, such as art, drama, and debate, have much lower participation rates, ranging from 5% to 10%.2. The line graph illustrates the changes in average temperature over the course of a year. As expected, there is a clear seasonal pattern, with temperatures peaking in the summer months and dropping to their lowest point in winter. However, what's interesting is the gradual increase in average temperature over the years. This suggests along-term warming trend, which is a cause for concern regarding climate change.3. The pie chart provides a breakdown of the sources of air pollution in a city. It's alarming to see that themajority of pollution comes from transportation, accounting for over 50%. This is followed by industrial emissions, which contribute around 30% to the overall pollution. Other sources, such as residential activities and agriculture, make up the remaining percentage. This data highlights the need for stricter regulations on transportation andindustry to improve air quality.4. The scatter plot displays the relationship between hours of studying and exam scores. Interestingly, there seems to be a positive correlation between the two variables. As the number of hours spent studying increases, so does the exam score. However, it's important to notethat this correlation does not imply causation. Other factors, such as natural aptitude or study techniques, may also play a role in determining exam performance.5. The table presents the statistics on population growth in different countries. It's evident that some countries are experiencing rapid population growth, while others are facing population decline. For example, China and India have the largest populations and continue to growsteadily, while Japan and Germany have negative growth rates. This data underscores the need for effective population management policies to address the challenges associated with population growth or decline.6. The line graph depicts the fluctuations in stock prices over a certain period of time. It's clear that the stock market is highly volatile, with prices constantly fluctuating. This volatility can be attributed to various factors, such as economic conditions, investor sentiment, and geopolitical events. As a result, investing in the stock market carries inherent risks and requires careful analysis and decision-making.7. The pie chart shows the distribution of household expenses. It's evident that the largest portion of expenses goes towards housing, accounting for nearly 40%. This is followed by transportation, which takes up around 20% of the budget. Other significant expenses include food, healthcare, and entertainment. This data highlights the importance of budgeting and making informed financial decisions to ensure a balanced and sustainable lifestyle.。

雅思图表类英语作文模板英文回答:1. Introduce the chart/graph: Briefly describe the type of chart/graph, the data it presents, and the time period or geographical location it covers.2. Overall trend: State the general trend or pattern observed in the data. Use specific numbers or percentages to support your statement.3. Key features: Highlight the most important or noticeable features of the chart/graph, such as peaks, valleys, or changes over time.4. Possible reasons: Speculate on the reasons behind the trends or features you have identified. Consider external factors or events that may have influenced the data.5. Predictions or recommendations: Based on the data presented, make predictions about future trends or provide recommendations for action.中文回答:雅思图表类英语作文模板。
1. 图表介绍,简要描述图表类型、数据内容以及时间跨度或地理范围。
2. 总体趋势,陈述数据中观察到的总体趋势或模式。
如何用英语描述图表2.the bar chart illustrates that……该柱状图展示了……3.the graph provides some interesting data regarding……该图为我们提供了有关……有趣数据。
4.the diagram shows (that)……该图向我们展示了……5.the pie graph depicts (that)……该圆形图揭示了……6.this is a cure graph which describes the trend of……这个曲线图描述了……的趋势。
18.the graph,presented in a pie chart,shows the general trend in……该图以圆形图形式描述了……总的趋势。
19.this is a column chart showing……这是个柱型图,描述了……20.as can be seen from the graph,the two curves show the flutuation of……如图所示,两条曲线描述了……的波动情况。
……月(年)至……月(年)……的数量基本不变。
26.the number sharply went up to……数字急剧上升至……27.the percentage of……stayed the same between……and…………至……期间……的。
如何用英语描述图表2.the bar chart illustrates that……该柱状图展示了……3.the graph provides some interesting data regarding……该图为我们提供了有关……有趣数据。
4.the diagram shows (that)……该图向我们展示了……5.the pie graph depicts (that)……该圆形图揭示了……6.this is a cure graph which describes the trend of……这个曲线图描述了……的趋势。
用百分比介绍图表写英文作文英文回答:In the provided chart, the data is presented as percentages, indicating the relative proportions of various elements within a specific context. The percentages provide insights into the distribution and composition of the data, allowing for comparisons and analysis.To provide a comprehensive overview, I will discuss the key features of the data and analyze the implications of the percentages presented.中文回答:图表解读。
图表中数据以百分比的形式呈现,表明了特定内容中各个元素的相对比例。
这些百分比让我们深入了解数据的分布和构成,以便进行比较和分析。
为了提供全面的概述,我将讨论数据的关键特征,并分析所呈现的百分比的含义。
英文回答:Data Distribution.The chart displays a range of percentages, from small values representing minor contributions to larger values indicating more significant shares. This distribution provides a clear picture of the relative importance of different components.Contribution to the Whole.The percentages indicate the contribution of each element to the overall total. By comparing the percentages, we can determine which elements are most prevalent and which have a relatively smaller impact.Comparisons and Trends.The chart allows for comparisons between different categories or time periods. By examining the changes in percentages over time, we can identify trends and patterns that provide insights into the dynamics of the data.中文回答:数据分布。
1.Map(地图、天体图、布局图、专用图、图谱)Battle map 作战地图Highway map 公路图Genetic map 基因图谱2.Figure(图形、平面图)Geometric(al) figure 几何图形Dimension figure 尺寸图Plane figure 平面图3.Pattern(图案、图型、图样)Checkboard pattern 棋盘型图案Recording pattern 录像图型Circular pattern 圆形图样4.Sketch(草图、略图、简图)Eye sketch 目测草图Topographic sketch 地形略图Dimensional sketch 尺寸简图5.Scheme/shematic(图解、示意图、流程图、电路图)Flow scheme 流程图Induction scheme 感应电路图6.Draft(草图)Chisel draft 雕刻前在石头上画出边缘轮廓草图7.Curve(曲线图表)Algebraic curve 代数曲线Comfort curve 湿度舒适曲线8.Graph(曲线图表)Funtional graph 函数图(亦称plot)Bar graph 条形图(也称chart)9.View(视图)Plane view 平面视图10.Geometry(几何图)Plane geometry 平面几何Solid geometry 立体几何图11.Chart(航海图、图表)Aeronautical chart 领航图Demographic data chart 人口统计图表Pie chart 饼图Bar chart 柱图12.Drawing(工程图、插图)Drawing 建筑图Explanatory drawing 说明(插)图yout(布局图、规划图)1、图形种类及概述法:泛指一份数据图表:a data graph(曲线图)/chart/diagram/illustration/table饼图:pie chart直方图或柱形图:bar chart/histogram趋势曲线图:line chart/curve diagram表格图:table流程图或过程图:flow chart/sequence diagram程序图:processing/procedures diagram2、常用的描述用法The table/chart diagram/graph shows (that)According to the table/chart diagram/graphAs (is)shown in the table/chart diagram/graphAs can be seen from the table/chart/diagram/graph/figures,figures/statistics shows (that)……It can be seen from the figures/statisticsWe can see from the figures/statisticsIt is clear from the figures/statisticsIt is apparent from the figures/statisticstable/chart/diagram/graph figures (that)……table/chart/diagram/graph shows/describes/illustrates3、图表中的数据(Data)具体表达法数据(Data)在某一个时间段固定不变:fixed in time在一系列的时间段中转变:changes over time持续变化的data在不同情况下:增加:increase/raise/rise/go up ……减少:decrease/grow down/drop/fall ……波动:fluctuate/rebound/undulate/wave ……稳定:remain stable/stabilize/level off ……二、相关常用词组1、主章开头图表类型:table(表格)、chart(图表)、diagram(图标)、graph(多指曲线图)、column chart (柱状图)、pie graph(饼图)、tree diagram(树形图)描述:show、describe、illustrate、can be seen from、clear、apparent、reveal、represent内容:figure、statistic、number、percentage、proportion2、表示数据变化的单词或者词组rapid/rapidly 迅速的,飞快的,险峻的dramatic/dramatically 戏剧性的,生动的significant/significantly 有意义的,重大的,重要的sharp/sharply 锐利的,明显的,急剧的steep/steeply 急剧升降的steady/steadily 稳固的,坚定不移的gradual/gradually 渐进的,逐渐的slow/slowly 缓慢的,不活跃的slight/slightly 稍微的、略微地stable/stably 稳定的3、其它在描述中的常用到的词significant changes 图中一些较大变化noticeable trend 明显趋势during the same period 在同一时期grow/grew 增长distribute 分布unequally 不相等地in the case of 在……的情况下in terms of/in respect of/regarding 在……方面in contrast 相反,大不相同government policy 政府政策market forces 市场力量measuren n.尺寸,方法,措施v.估量,调节forecast n.先见,预见v.猜测三、图表描述套句精选1.the table shows the changes in the number of……over the period from……to……该表格描述了在……年之……年间……数量的变化。
英文作文描述图表下载温馨提示:该文档是我店铺精心编制而成,希望大家下载以后,能够帮助大家解决实际的问题。
文档下载后可定制随意修改,请根据实际需要进行相应的调整和使用,谢谢!并且,本店铺为大家提供各种各样类型的实用资料,如教育随笔、日记赏析、句子摘抄、古诗大全、经典美文、话题作文、工作总结、词语解析、文案摘录、其他资料等等,如想了解不同资料格式和写法,敬请关注!Download tips: This document is carefully compiled by theeditor. I hope that after you download them,they can help yousolve practical problems. The document can be customized andmodified after downloading,please adjust and use it according toactual needs, thank you!In addition, our shop provides you with various types ofpractical materials,such as educational essays, diaryappreciation,sentence excerpts,ancient poems,classic articles,topic composition,work summary,word parsing,copyexcerpts,other materials and so on,want to know different data formats andwriting methods,please pay attention!The bar chart illustrates the percentage of people in different age groups who use social media platforms. The data is based on a survey conducted in a small town.In the 18-24 age group, a staggering 90% of the respondents reported using social media. This comes as no surprise, as young people are known to be avid users of platforms such as Facebook, Instagram, and Snapchat. It seems that social media has become an integral part of their daily lives, with many of them spending hours scrolling through feeds and engaging with friends online.Moving on to the 25-34 age group, the percentage drops slightly to 80%. While still a significant number, it is evident that social media usage is not as prevalent among this age group compared to the younger demographic. This could be due to various factors, such as work commitments, family responsibilities, or simply a shift in interests as individuals grow older.Interestingly, the percentage of social media users among the 35-44 age group is significantly lower, at only 60%. This could be attributed to the fact that individuals in this age range are more focused on their careers and family life, leaving them with less time for social media. Additionally, some may not be as technologically savvy or may prefer more traditional forms of communication.In the 45-54 age group, the percentage drops even further to 40%. This could be due to a combination of factors, including a lack of interest in social media, a preference for face-to-face interactions, or a lack of knowledge about how to use these platforms. It is clearthat social media is not a priority for this age group.Finally, in the 55 and above age group, the percentage of social media users is the lowest, at only 20%. This is not surprising, as older individuals may not see the need or benefit of using social media platforms. They may prefer more traditional forms of communication, such as phonecalls or in-person meetings, and may find technology to beoverwhelming or unnecessary.Overall, the data from the bar chart highlights the varying levels of social media usage among different age groups. While young people are heavily invested in these platforms, older individuals are less inclined to engage with them. This demonstrates the generational divide when it comes to technology and communication preferences.。