2007_A New and Effective Image Retrieval Method Based on Combined Features
- 格式:pdf
- 大小:316.18 KB
- 文档页数:5

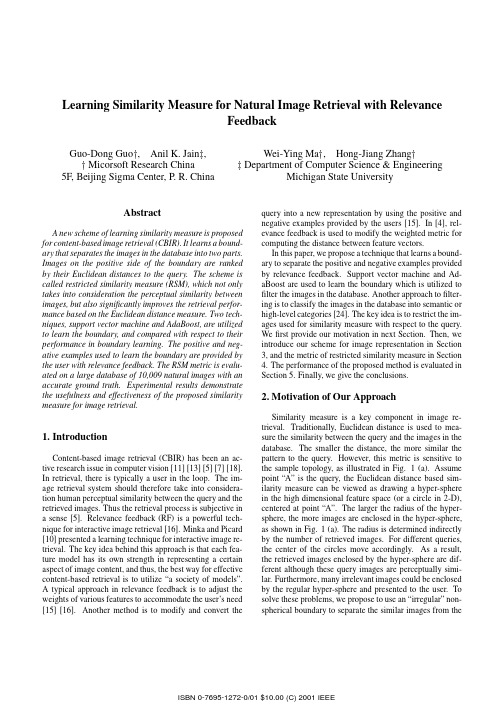
Learning Similarity Measure for Natural Image Retrieval with RelevanceFeedbackGuo-Dong Guo,Anil K.Jain, Micorsoft Research China5F,Beijing Sigma Center,P.R.ChinaWei-Ying Ma,Hong-Jiang Zhang Department of Computer Science&Engineering Michigan State UniversityAbstractA new scheme of learning similarity measure is proposed for content-based image retrieval(CBIR).It learns a bound-ary that separates the images in the database into two parts. Images on the positive side of the boundary are ranked by their Euclidean distances to the query.The scheme is called restricted similarity measure(RSM),which not only takes into consideration the perceptual similarity between images,but also significantly improves the retrieval perfor-mance based on the Euclidean distance measure.Two tech-niques,support vector machine and AdaBoost,are utilized to learn the boundary,and compared with respect to their performance in boundary learning.The positive and neg-ative examples used to learn the boundary are provided by the user with relevance feedback.The RSM metric is evalu-ated on a large database of10,009natural images with an accurate ground truth.Experimental results demonstrate the usefulness and effectiveness of the proposed similarity measure for image retrieval.1.IntroductionContent-based image retrieval(CBIR)has been an ac-tive research issue in computer vision[11][13][5][7][18]. In retrieval,there is typically a user in the loop.The im-age retrieval system should therefore take into considera-tion human perceptual similarity between the query and the retrieved images.Thus the retrieval process is subjective in a sense[5].Relevance feedback(RF)is a powerful tech-nique for interactive image retrieval[16].Minka and Picard [10]presented a learning technique for interactive image re-trieval.The key idea behind this approach is that each fea-ture model has its own strength in representing a certain aspect of image content,and thus,the best way for effective content-based retrieval is to utilize“a society of models”.A typical approach in relevance feedback is to adjust the weights of various features to accommodate the user’s need [15][16].Another method is to modify and convert the query into a new representation by using the positive and negative examples provided by the users[15].In[4],rel-evance feedback is used to modify the weighted metric for computing the distance between feature vectors.In this paper,we propose a technique that learns a bound-ary to separate the positive and negative examples provided by relevance feedback.Support vector machine and Ad-aBoost are used to learn the boundary which is utilized to filter the images in the database.Another approach tofilter-ing is to classify the images in the database into semantic or high-level categories[24].The key idea is to restrict the im-ages used for similarity measure with respect to the query. Wefirst provide our motivation in next Section.Then,we introduce our scheme for image representation in Section 3,and the metric of restricted similarity measure in Section 4.The performance of the proposed method is evaluated in Section5.Finally,we give the conclusions.2.Motivation of Our ApproachSimilarity measure is a key component in image re-trieval.Traditionally,Euclidean distance is used to mea-sure the similarity between the query and the images in the database.The smaller the distance,the more similar the pattern to the query.However,this metric is sensitive to the sample topology,as illustrated in Fig.1(a).Assume point“A”is the query,the Euclidean distance based sim-ilarity measure can be viewed as drawing a hyper-sphere in the high dimensional feature space(or a circle in2-D), centered at point“A”.The larger the radius of the hyper-sphere,the more images are enclosed in the hyper-sphere, as shown in Fig.1(a).The radius is determined indirectly by the number of retrieved images.For different queries, the center of the circles move accordingly.As a result, the retrieved images enclosed by the hyper-sphere are dif-ferent although these query images are perceptually simi-lar.Furthermore,many irrelevant images could be enclosed by the regular hyper-sphere and presented to the user.To solve these problems,we propose to use an“irregular”non-spherical boundary to separate the similar images from thedissimilar ones,and the Euclidean distance measure is ap-plied only to a limited number of images.As shown in Fig.1(b),the Euclidean similarity measure for query “A”is only done with respect to the black rectangular patterns.The boundary can be learned from the positive and neg-ative examples provided by the user in image retrieval.We decide to use learning techniques that are non-parametric and do not need a large number of examples to learn a deci-sion rge margin classifiers,such as SVM [25][2]and AdaBoost [3],can be used for suchpurpose.(a)(b)Figure 1.Perceptually similar patterns as rect-angular ones.See the text for description.Can we directly use the distances of the images to the boundary to define the similarity measure?The answer is “no”.Suppose a query image “B”is given by the user,which is very similar to image “C”,as shown in Figs.1(a)and (b).Both “B”and “C”are at the positive side of the boundary,and yet close to the boundary.In such a case,other images with large distances to the boundary will al-ways be ranked in the top matches when the distance-from-boundary (DFB)metric is used for similarity measure,while image “C”can only be retrieved for example after top 20matches or even more.In an extreme case,image “C”is the same as “B”,but can not be retrieved in the top 1or 2matches.On the contrary,if we use Euclidean dis-tance measure for the small number of images filtered by the boundary,the image “C”can usually be retrieved in the top matches.In other words,the merit of the Euclidean distance measure is lost if merely the DFB metric is used.3.Image RepresentationColor information is one of the important features forimage retrieval [21].We use the HSV color space since it provides the best retrieval performance for color histograms [7].The color histogram is quantized to 256levels,which results in 256features for each image.Color moments con-stitute another kind of color features,which are simple yeteffective for image retrieval [20],and do not require quan-tization.The first three order moments are calculated in the HSV space of each image,resulting in a feature vector of dimension 9.In addition,color coherence vectors (CCV)is used to incorporate spatial information into color histogram representation [12].The CCV features with 64quantization result in a 128-dimensional feature vector.Texture is another type of low-level image feature.The Tamura features are designed based on the psychological studies in human visual perceptions of textures [22].We compute the coarseness histogram with 10quantization lev-els,and the histogram of directionality with 8quantization levels.Another one is the wavelet coefficients.The pyrami-dal wavelet transform (PWT)[9]is used and the mean and standard deviation of the energy distribution are calculated corresponding to each of the sub-bands at each decomposi-tion level.For three-level decomposition,PWT results in afeature vector with ()components.We concatenate all color and texture features into one vector (with normalization)to represent each image.4.Restricted Similarity MeasureIn retrieval,we use the restricted similarity measure (RSM)with the restriction imposed by the boundary be-tween the positive and negative examples.4.1.Providing ExamplesHow to provide the system with some positive and neg-ative examples?One way is to present a set of pre-selected positive and negative examples for each query class as in [23].However,new queries may be on the negative side of the boundary (or even far away)pre-learned with the pre-selected examples,thus the user can not obtain his expected results.A better way is to provide examples using relevance feedback technique,which is natural and adaptive.There-fore the boundary is adapted to each query.4.2.Learning with Support Vector MachineGiven two-class examples,,withand ,support vector machine(SVM)finds an optimal separating hyperplane (OSH)to separate them.The optimal solution is the sad-dle point of the Lagrange functional,,where are theLagrange multipliers.By Lagrangian duality,the solution(1)whereandare any two support vectors with ,,and .Slack variables and a penalty function,,where s are a measure of the mis-classification error,can be used to solve the non-separable problem[1]. The solution is identical to the separable case except for a modification of the Lagrange multipliers as.The SVM can realize non-linear discrimi-nation by kernel mapping[25],and we choose the Gaussian radial basis function(GRBF)in our experiments,where is the width of the Gaussian.4.3.Learning the Boundary with AdaBoostBoosting is a method to combine a collection of weak learners to form a stronger classifier.AdaBoost is an adap-tive algorithm,in that the weights are updated dynamically according to the errors in previous learning[3].Tieu and Viola[23]adapted the AdaBoost algorithm for image re-trieval.They let the weak learner work on a single feature each time.So after rounds of boosting,features are selected together with the weak classifiers.The simple algorithm[23]is briefly described as below:AdaBoost AlgorithmInput:1)training exampleswith or;2)the number of iterations. Initialize weights or for or, respectively,with.Do for:1.Train one hypothesis for each feature with, and error.2.Choose such that.Let.3.Update:,where or for example classified correctly or incorrectly respectively, with and.4.Normalize the weights so that they are a distribution,.Output thefinal hypothesis,(2)However,they[23]did not consider the perceptual sim-ilarity between images.In fact,the distance to the decision boundary can not be used directly to measure perceptual similarity as explained in Section2.Here,we use the Ad-aBoost[23]to learn a boundary and compare it with the SVM based learning.Furthermore,instead of using pre-selected images[23]for each class,the boundary is learned with the user interaction.4.4.Restricted Similarity MeasureFor a query,after the boundary is learned based on the user’s feedback,the images in the database arefiltered by the boundary,and treated differently based on their posi-tions with respect to the boundary.For the positive im-ages,we rank them based on their Euclidean distances to the query.It is well known that in the CIE and color spaces[27],the Euclidean distance between two colors is proportional to their perceptual dissimilarity [14].Thus the Euclidean distance can be used as a sim-ilarity measure for color images.Currently,there are no texture features where the Euclidean distance corresponds to human perceptual dissimilarity,yet intuitively the Eu-clidean distance can be used for texture similarity measure [8][6].On the other hand,the negative images are ranked only based on their distances to the boundary,which comes from the intuition that the images similar to the query may not have positive distances,but typically they are expected not far away from it.So,these images can be retrieved for the user just after the positive images if they are ranked by their distances to the boundary.For this reason,we use the distance-from-boundary(DFB)measure to deal with the negative images.Why do we rank negative images?Two considerations:one is that some perceptually similar im-ages may have negative distances to the boundary.If they are discarded,they may not be retrieved to the user forever; another is that sometimes the user would like to browse more images than thefiltered positive images.If the neg-ative images are discarded,the number of images to be re-trieved will be insufficient.In sum,our strategy is called restricted similarity measure(RSM).It is formulated as(3) where denotes the similarity measure of the image with respect to the query,and represents thedistance of to the boundary characterized by a param-eter set.The distance of the image to the boundary is calculated by(4) for the SVM learned boundary,and computed by,(5) for AdaBoost learned boundary.In addition,(6)is the Euclidean distance between image and the query .While is the maximum Euclidean distance among the positive images to the query,(7)can be viewed as a kind of pseudo Eu-clidean distance measure for ranking any negative image.5.ExperimentsOur restricted similarity measure is evaluated on a sub-set of Corel photo Gallery.We select 10,009images with ground truth of 79concepts or classes.Recall and preci-sion are used to evaluate the retrieval performance.Recall is the ratio of the number of relevant images returned to the total number of relevant images.Precision is the ratio of the number of relevant images returned to the total number of images returned.We calculate precision and recall with respect to the number of relevance feedback.The results of the traditional Euclidean distance measure are given as a baseline in the evaluation.Note that although retrieval re-sults based on Euclidean distance measure are shown in the same figure,there is no feedback (no learning,or we call no restriction)to it.The curves for the Euclidean distance measure are drawn with respect to the number of displayedimages,which equalsin our experiments,with the number of relevancefeedback.flower leopardmountainsunsets waterfallplanemodel race car tigerFigure 2.Representative images of 9groups.5.1.Image Data SetThe Corel Gallery contains 1,000,000images,and uses semantic concepts to group them,each group with 100im-ages.However,their divisions can not be used directly as the ground truth to evaluate CBIR algorithms.First,some images have the same or similar content but divided into dif-ferent directories,such as “Ballon1”and “Ballon2”,“Cui-sine”and “Cuisines”,and so on.We put them into the same group.Second,some “concepts”are abstract and the corre-sponding images within those groups vary largely in con-tent,for example,“Spring”,“Winter”,“Hongkong”,and “Montreal”.It is difficult for current CBIR algorithms to deal with.Therefore,we exclude those groups in our im-age database.Considering these aspects,we construct a database of 10,009images of 79groups.The number of images within each group ranges from 100to 300.5.2.Retrieval PerformanceTwo goals in our experiments:1)evaluate whether the restricted similarity measure can deliver better retrieval re-sults;2)compare to see which method (SVM or AdaBoost)leads to a better performance for filtering.We select 9concepts out of 79to evaluate the retrieval performance,i.e.,“flower”(200),“leopard”(100),“model”(300),“mountain”(200),“plane”(200),“race car”(209),“sunsets”(200),“tiger”(100),and “waterfall”(100),as shown in Fig.2.The numbers indicate how many images in each group.We simulate the user’s behavior in relevance feedback as follows:40images are shown each time,and the user clicks all the similar images to submit positive response.However,the users typically do not like to click on so many negative examples frequently,they may just click on the negative in the first round.In the precision and recall curves,the total feedback times are 9,with 0feedback referring to the re-trieval based on Euclidean distance measure without inter-action.The boundary is updated continuously afterwards.For each concept,the precision and recall are aver-aged over all query images,which is a more representa-tive evaluation.Filtering based on the boundaries learned by SVMs can usually deliver a better result in compari-son with that learned by AdaBoost,such as in retrieval of “flower”,“leopard”,“mountain”,“waterfall”,“plane”,“race car”,and “tiger”.The AdaBoost based boundary learning can only present performance close to the SVM based approach for “sunsets”and “model”,but still worse than that based on SVM.Furthermore,the worst cases for AdaBoost approach are in the retrieval of “race car”and “tiger”,in which the boundary restrictions do not improve or only improve marginally over the Euclidean distance measure.Due to space limitations,these separate results areFigure 3.Averaged precision and recall versus the number of relevance feedback of R:SVM, R:AdaBoost,and No Restriction,over the total nine concepts.not shown here.In stead,only the whole precision and re-call curves averaged over the selected9concepts(of1609queries)is given in Fig. 3.It is obvious that both preci-sion and recall are explicitly improved by using the bound-ary(learned with SVM)restricted similarity measure.Evenonly after one or two feedback,the performance has dra-matically improved.However,the averaged performanceof AdaBoost has marginal improvement over the Euclideandistance measure.5.3.DiscussionsIn our RSM with SVM,we use all the435features.A further consideration is to reduce the feature dimensionalityso as to speed up the retrieval process.In AdaBoost[23],feature selection is incorporated into the learning stage. Usually20rounds of boosting is enough,and hence20fea-tures are used.We would like to see if a similar method canbe used for SVM to simply select a small number of fea-tures.For this purpose,we try a simple method for featureselection for SVM,similar to that in[23]for AdaBoost.In Fig.4,we show the averaged precision and recall perfor-mance over200images of“flower”,with featuresselected and used for SVM,denoted as“R:SVM-20”for simplicity.It is obvious that its performance is worse thanthe traditional Euclidean distance metric.To see whetherit is because the number of features is too small,we let and and show the results in the same figure.The performances of“R:SVM-50”and“R:SVM-100”are worse than the AdaBoost based approach,whichindicates the major problem is not the number of selectedfeatures.The simple feature selection method can not be used for SVM,while a more elaborated algorithm[26]can be tried instead.This also indirectly indicates the different mechanism for SVM and AdaBoost.The number of support vectors is determined automati-cally in SVM learning.If too many examples are presented in feedback(although not actual in practice),the SVM may use lots of support vectors,which makes thefiltering pro-cess slow.Some methods[19]can be tried to reduce the number of support vectors.Finally,the AdaBoostfiltering may have better results than the SVM for some individual queries.In such cases, how to select the better or combine them to deliver a good result is an open question.6.ConclusionsWe have presented a restricted similarity measure(RSM) for content based image retrieval.This measure takes into consideration the perceptual similarity between images and improves the retrieval performance.Two techniques are used to learn the boundary,and the experimental results in-dicate that generally the SVM based method is much better than the AdaBoost based approach.References[1] C.Cortes and V.Vapnik,Support vector networks,MachineLearning,20,273-297,1995.[2]R.P.W.Duin,Classifiers in almost empty spaces,Proc.ofInternal Conf.on Pattern Recognition,vol.2,1-7,2000. [3]Y.Freund and R.E.Schapire,A decision-theoretic general-ization of online learning and an application to boosting.J.Comp.&Sys.Sci.,55(1):119-139,1997.[4]J.Huang,S.R.Kumar,and M.Metra,Combining supervisedlearning with color coorelograms for content-based image re-trieval.Proc.of ACM Multimedia’95,325-334,1997.Figure4.Averaged over200queries of“flower"to evaluate the simple feature selection for SVM (R:SVM-),compared with R:SVM,R:AdaBoost,and the Euclidean,for,,and.[5] B.Johansson,A survey on:contents based search imimage databases,http://www.isy.liu.se/cvl/Projects/VISIT-bjojo/,Feb.15,2000.[6]W.Y.Ma and B.S.Manjunath,Texture features and learningsimilarity.Proc.CVPR,425-430,1996.[7]W.Y.Ma and H.J.Zhang,Content-based image indexing andretrieval,Chapter11,In Handbook of Multimedia Computing, Borko Furht,ed.CRC Press,1998.[8] B.S.Manjunath and W.Y.Ma,Texture features for browsingand retrieval of image data.IEEE PAMI,837-842,1996. [9]S.G.Mallat,A theory for mutiersolution signal decomposi-tion:the wavelet representation,IEEE Trans.on Patern Anal-ysis and Machine Intelligence,vol11,674-693,July1989. [10]T.P.Minka and R.W.Picard,Interactive learning using a“society of models”,Technical Report No.349,MIT Media Laboratory,1995.[11]W.Niblack,et al,The QBIC project:querying imagesby content using color,texture,and shape,Proc.of SPIE, SRIVD,v.1908,San Jose,CA,173-187,Feb.1993.[12]G.Pass and R.Zabih,Histogram refinement for content-based image retrieval,IEEE Workshop on Applications of Computer Vision,96-102,1996.[13] A.Pentland,R.W.Picard,and S.Sclaroff,Photobook:toolsfor content based manipulation of image databases,Proc.of SPIE,SRIVD,No.2185,San Jose,CA,34-47,Feb.1994. [14]J.Puzicha,J.M.Buhmann,Y.Rubner and C.Tomasi,Em-perical evaluation of dissimilarity measures for color and tex-ture,Proc.ICCV,vol.,1165-1172,1999.[15]Y.Rui,et al,A relevance feedback architecture in content-based multimedia information retrieval systems,Proc.of IEEE Workshop on CAIVL,1997.[16]Y.Rui,T.S.Huang,M.Ortega,and S.Mehrotra,Relevancefeedback:a powerful tool for interactive content-based image retrieval,IEEE Trans.on CSVT,No.5,644-655,1998.[17]S.Santini and R.Jain,Similarity measures,IEEE PAMI,vol.21,No.9,871-883,1999.[18] A.W.M.Smeulders,M.Worring,S.Santini,A.Gupta,andR.Jain,Content-based image retrieval at the end of the early years,IEEE PAMI,vol.22,No.12,1349-1380,Dec.2000.[19] B.Scholkopf,et al.,Input space versus feature space inkernel-based methods,IEEE Trans.on Neural Networks,V ol.10,No.5,1000-1017,Sept.1999.[20]M.Stricker and M.Orengo,Similarity of color images,SPIEStorage and Retrieval for Image and Video Databases III,vol 2185,381-392,Feb.1995.[21]M.J.Swain and B.H.Ballard,Color indexing,Int’l -puter Vision,vol,7,No.1,11-32,1991.[22]H.Tamura,S.Mori,and T.Yamawaki,Texture features cor-responding to visual perception,IEEE Trans.on Systems, Man,and Cybernetics,vol.8,no.6,1978.[23]K.Tieu and P.Viola,Boosting image retrieval,in Proc.ofCVPR,v.1,228-235,2000.[24] A.Vailaya,M.A.T.Figueiredo,A.K.Jain and H.J.Zhang,Image Classification for content-based indexing,IEEE Trans.Image Processing,v.10,no.1,117-130,2001.[25]V.N.Vapnik,Statistical learning theory,John Wiley&Sons,New York,1998.[26]J.Weston,et al,Feature selection for SVMs,NIPS,vol.13,2000.[27]G.Wyszecki and W.S.Stiles,Color Science:Concepts andMethods,Quantitative Data and Formulae.,John Wiley and Sons,New York,NY,1982.。
Perceptual Consistency Improves Image Retrieval Performance Huizhong Long,Wee Kheng LeowSchool of Computing,National University of Singapore3Science Drive2,Singapore117543longhuiz,leowwk@.sgABSTRACTAn ideal retrieval system should retrieve images that sat-isfy the user’s need,and should,therefore,measure image similarity in a manner consistent with human’s perception. However,existing computational similarity measures are not perceptually consistent.This paper proposes an approach of improving retrieval performance by improving the per-ceptual consistency of computational similarity measures for textures based on relevance feedback judgments.1.INTRODUCTIONAn ideal retrieval system should retrieve images that sat-isfy the user’s need.It should,therefore,measure image similarity in a manner consistent with human’s perception. However,existing computational similarity measures are not perceptually consistent[3,6].This problem leads to re-trieval results that do not always meet the users’expecta-tions[7].To improve retrieval performance,relevance feed-back technique is often used to tune computational simi-larity measures[4,5,8].Typically,each new query resets the similarity measure back to its initial state,which is not perceptually consistent.Subsequent feedback for the query are used to adjust the weighting factors of the similarity measure to improve retrieval performance.The main difficulty with this method is that very few users are willing to go through endless iterations of feedback in hope of retrieving the best results.A successful relevance feedback process must yield positive results within three or four iterations[1].So,feedback methods that require many iterations to improve retrieval performance are not practi-cally useful.Another shortcoming of this method is that previous feedback results are typically not retained in the system.Each new query starts with a similarity measure that is not perceptually consistent.The users have to go through the relevance feedback process even if the same feed-back information has been given in the past.This problem is partially alleviated with user profiling.Permission to make digital or hard copies of all or part of this work for personal or classroom use is granted without fee provided that copies are not made or distributed for pro£t or commercial advantage and that copies bear this notice and the full citation on the£rst page.To copy otherwise,to republish,to post on servers or to redistribute to lists,requires prior speci£c permission and/or a fee.SIGIR’01,September9-12,2001,New Orleans,Louisiana,USA. Copyright2001ACM1-58113-331-6/01/0009...$5.00.This paper addresses the root of the problem of low re-trieval performance:perceptual inconsistency.It proposes an approach of improving retrieval performance by improv-ing the perceptual consistency of computational similarity measures.It uses relevance feedback judgments to incre-mentally transform a computational space into a perceptual space.Image similarity measured in the perceptual space would be perceptually consistent.This approach could be applied to both document and image retrieval,though this paper focuses mainly on texture image retrieval.2.ADAPTIVE PERCEPTUAL SPACEIn[2,3],we have demonstrated that commonly used tex-ture features and similarity measures are not consistent with human’s perception,and that mapping texture features to the perceptual texture space improves the perceptual con-sistency of computational features as well as their retrieval performance.This paper introduces an incremental algo-rithm for constructing the perceptual space using the rele-vance feedback judgments provided by the users.Let P denote a perceptual space in which every image i is assigned a point x i and the Euclidean distance between im-age points x i and x j in P is equal to the perceptual distance p ij between images i and j.Then,the problem of incremen-tal construction becomes one of computing the perceptual distances p ij from cumulative feedback.The incremental construction algorithm can be summarized as follows:1.Initialize image space to a computational space.Initialize each p ij to a computational distance,e.g., the Euclidean distance between images i and j.Ap-ply multidimensional scaling(MDS)to compute the coordinates x i of each image i from the distances p ij.2.Initialize co-occurrence and feedback matrices.Initialize the entries c ij of co-occurrence matrix C andb ij of feedback matrix B to zero.Matrix C accumulatesthe relevance feedback results and B indicates whether feedback results have been received.3.Update co-occurrence and feedback matrices.Let q denote a query image,and R and I the sets of relevant and irrelevant images marked by a user.Update the matrices as follows:c qi←c qi+1for each image i∈Rc qi←c qi−1for each image i∈I,if c qi>1b qi←1for each image i∈R∪IprecisionFigure1:Precision-recall curves of the incremental space at stages1to4.As information coverage in-creases,the curve shifts towards the upper bound achieved by direct mapping to PTS using SVM.This accumulation step can be executed several times before going on to the next step.4.Update perceptual distances.This step involves merging the new distance measure-ments d ij=n−c ij with the old perceptual distances p ij.The variable n denote the total number of feed-back iterations executed so far.To merge them suc-cessfully,d ij and p ij must be normalized to the same scale.This is achieved by equalizing the population means and variances of d ij and p ij.After equaliza-tion,p ij is replaced by d ij if b ij=1.5.Update perceptual space.Re-compute the coordinates x i of each image i from the distances p ij using MDS.Steps3to5are repeated for new feedback results.2.1Retrieval TestsExperiments were conducted to test the algorithm’s per-formance.Figure1plots the precision-recall curves at vari-ous relevance feedback stages.Ten feedback iterations,each containing non-redundant information,were performed be-tween each stage.As more and more feedback results were received,information coverage(i.e.,information conveyed by the feedback judgments)increased and retrieval perfor-mance approached the upper bound achieved by directly mapping computational features to the perceptual texture space using support vector machine(SVM)[2,3].The per-ceptual texture space was constructed using human judg-ment data collected in psychological experiments[2,3]. The incremental construction method shows an interest-ing phenomenon called phase shifting.Initially,the percep-tual consistency of the texture space was as low as that of a computational space(e.g.,Euclidean and scaled Eu-clidean[9]spaces).As more feedback results were received, the space shifted towards a perceptual space(Fig.2).This phase shifting property offers another useful advantage.As a user’s relevance judgment changes over time,the space will also change accordingly,thus adapting to the user’s chang-ing need.3.CONCLUSIONThis paper presented an incremental method of measur-ing perceptual distances and constructing a perceptual space using relevance feedback judgements.The method requires% coverage Pearson rEFFCSESVMmixedspaceFigure2:Phase shifts of texture space.The line indicates the perceptual consistency at various per-centage of information coverage.The labels mark the positions of various similarity measures(E:Eu-clidean,SE:scaled Euclidean,FFC[9],and SVM mapping[3])according to perceptual consistency.only a small amount of relevance judgments at each feedback iteration.It accumulates the feedback information over dif-ferent queries to construct the perceptual space.The con-structed space exhibits phase shifting from a purely com-putational space towards a perceptual space as more and more feedback results are received.This property confirms that the method can indeed construct a perceptual space in-crementally.If the feedback judgments are provided by the same user,then the perceptual distances measured would be consistent with a single user’s perception.Otherwise, the measurements would reflect the average perception of typical users.In the case of a single user,the measurements would eventually stabilize if the user’s judgment remains consistent over time.Otherwise,the measurements would adapt to the changes in the user’s judgment.4.REFERENCES[1]rmation Storage and Retrieval.John Wiley&Sons,1997.[2]H.-Z.Long and W.K.Leow.Invariant andperceptually consistent texture mapping forcontent-based image retrieval.In Proc.ICIP,2001. [3]H.-Z.Long and W.K.Leow.Perceptual texture spaceimproves perceptual consistency of computationalfeatures.In Proc.IJCAI,2001.[4]W.Y.Ma and B.S.Manjunath.Texture features andlearning similarity.In Proc.IEEE CVPR’96,pages425–430,1996.[5]T.P.Minka and R.W.Picard.Interactive learningusing a“society of models”.In Proc.IEEE CVPR’96, pages447–452,1996.[6]J.S.Payne,L.Hepplewhite,and T.J.Stonham.Perceptually based metrics for the evaluation oftextural image retrieval methods.In Proc.IEEEICMCS’99,pages793–797,1999.[7]Y.Rui and T.Huang.Optimizing learning imageretrieval.In Proc.CVPR,2000.[8]Y.Rui,T.S.Huang,and S.Mehrotra.Content-basedimage retrieval with relevance feedback in MARS.InProc.ICIP’97,1997.[9]S.Santini and R.Jain.Similarity measures.IEEETrans.PAMI,21(9):871–883,1999.。
Pattern Recognition 40(2007)2641–2655/locate/prLearning to display high dynamic range imagesGuoping Qiu a ,∗,Jiang Duan a ,Graham D.Finlayson ba School of Computer Science,The University of Nottingham,Jubilee Campus,Nottingham NG81BB,UKb School of Computing Science,The University of East Anglia,UKReceived 27September 2005;received in revised form 10April 2006;accepted 14February 2007AbstractIn this paper,we present a learning-based image processing technique.We have developed a novel method to map high dynamic range scenes to low dynamic range images for display in standard (low dynamic range)reproduction media.We formulate the problem as a quantization process and employ an adaptive conscience learning strategy to ensure that the mapped low dynamic range displays not only faithfully reproduce the visual features of the original scenes,but also make full use of the available display levels.This is achieved by the use of a competitive learning neural network that employs a frequency sensitive competitive learning mechanism to adaptively design the quantizer.By optimizing an L 2distortion function,we ensure that the mapped low dynamic images preserve the visual characteristics of the original scenes.By incorporating a frequency sensitive competitive mechanism,we facilitate the full utilization of the limited displayable levels.We have developed a deterministic and practicable learning procedure which uses a single variable to control the display result.We give a detailed description of the implementation procedure of the new learning-based high dynamic range compression method and present experimental results to demonstrate the effectiveness of the method in displaying a variety of high dynamic range scenes.᭧2007Pattern Recognition Society.Published by Elsevier Ltd.All rights reserved.Keywords:Learning-based image processing;Quantization;High dynamic range imaging;Dynamic range compression;Neural network;Competitive learning1.IntroductionWith the rapid advancement in electronic imaging and com-puter graphics technologies,there have been increasing interests in high dynamic range (HDR)imaging,see e.g.,Ref.[1–17].Fig.1shows a scenario where HDR imaging technology will be useful to photograph the scene.This is an indoor scene of very HDR.In order to make features in the dark areas visible,longer exposure had to be used,but this rendered the bright area saturated.On the other hand,using shorter exposure made features in the bright areas visible,but this obscured features in the dark areas.In order to make all features,both in the dark and bright areas simultaneously visible in a single image,we can create a HDR radiance map [3,4]for the ing the technology of Ref.[3],it is relatively easy to create HDR maps for high dynamic scenes.All one needs is a sequence of low∗Corresponding author.Fax:+441159514254.E-mail address:qiu@ (G.Qiu).0031-3203/$30.00᭧2007Pattern Recognition Society.Published by Elsevier Ltd.All rights reserved.doi:10.1016/j.patcog.2007.02.012dynamic range (LDR)photos of the scene taken with different exposure intervals.Fig.2shows the LDR display of the scene in Fig.1mapped from its HDR radiance map,which has been created using the method of [3]from the photos in Fig.1.It is seen that all areas in this image are now clearly visible.HDR imaging technology has also been recently extended to video [13,14].Although we can create HDR numerical radiance maps for high dynamic scenes such as those like Fig.1,reproduction devices,such as video monitors or printers,normally have much lower dynamic range than the radiance map (or equivalently the real world scenes).One of the key technical issues in HDR imaging is how to map HDR scene data to LDR display values in such a way that the visual impressions and feature details of the original real physical scenes are faithfully reproduced.In the literature,e.g.,Refs.[5–17],there are two broad categories of dynamic range compression techniques for the dis-play of HDR images in LDR devices [12].The tone reproduc-tion operator (TRO)based methods involve (multi-resolution)spatial processing and mappings not only take into account the2642G.Qiu et al./Pattern Recognition 40(2007)2641–2655Fig.1.Low dynamic range photos of an indoor scene taken under different exposureintervals.Fig.2.Low dynamic display of high dynamic range map created from the photos in Fig.1.The dynamic range of the radiance map is 488,582:1.HDR radiance map synthesis using Paul Debevec’s HDRShop software (/HDRShop/).Note:the visual artifacts appear in those blinds of the glass doors were actually in the original image data and not caused by the algorithm.values of individual pixel but are also influenced by the pixel spatial contexts.Another type of approaches is tone reproduc-tion curve (TRC)based.These approaches mainly involve the adjustment of the histograms and spatial context of individual pixel is not used in the mapping.The advantages of TRO-based methods are that they generally produce sharper images when the scenes contain many detailed features.The problems with these approaches are that spatial processing can be computa-tionally expensive,and there are in general many parameters controlling the behaviors of the operators.Sometimes these techniques could introduce “halo”artifacts and sometimes they can introduce too much (artificial)detail.TRC-based methods are computationally simple.They preserve the correct bright-ness order and therefore are free from halo artifacts.These methods generally have fewer parameters and therefore are eas-ier to use.The drawbacks of this type of methods are that spa-tial sharpness could be lost.Perhaps one of the best known TRC-based methods is that of Ward and co-workers’[5].The complete operator of Ref.[5]also included sophisticated models that exploit the limita-tions of human visual system.According to Ref.[5],if one just wanted to produce a good and natural-looking display for an HDR scene without regard to how well a human ob-server would be able to see in a real environment,histogram adjustment may provide an “optimal”solution.Although the histogram adjustment technique of Ref.[5]is quite effective,it also has drawbacks.The method only caps the display contrast(mapped by histogram equalization)when it exceeds that of the original scene.This means that if a scene has too low contrast,the technique will do nothing.Moreover,in sparsely populated intensity intervals,dynamic range compression is achieved by a histogram equalization technique.This means that some sparse intensity intervals that span a wide intensity range will be com-pressed too aggressively.As a result,features that are visible in the original scenes would be lost in the display.This un-satisfactory aspect of this algorithm is clearly illustrated in Figs.9–11.In this paper,we also study TRC-based methods for the dis-play of HDR images.We present a learning-based method to map HDR scenes to low dynamic images to be displayed in LDR devices.We use an adaptive learning algorithm with a “conscience”mechanism to ensure that,the mapping not only takes into account the relative brightness of the HDR pixel val-ues,i.e.,to be faithful to the original data,but also favors the full utilization of all available display values,i.e.,to ensure the mapped low dynamic images to have good visual contrast.The organization of the paper is as follows.In the next section,we cast the HDR image dynamic range compression problem in an adaptive quantization framework.In Section 3,we present a solution to HDR image dynamic range compression based on adaptive learning.In Section 4,we present detailed imple-mentation procedures of our method.Section 4.1presents re-sults and Section 4.2concludes our presentation and briefly discusses future work.2.Quantization for dynamic range compressionThe process of displaying HDR image is in fact a quantiza-tion and mapping process as illustrated in Fig.3.Because there are too many (discrete)values in the high dynamic scene,we have to reduce the number of possible values,this is a quantiza-tion process.The difficulty faced in this stage is how to decide which values should be grouped together to take the same value in the low dynamic display.After quantization,all values that will be put into the same group can be annotated by the group’s index.Displaying the original scene in a LDR is simply to rep-resent each group’s index by an appropriate display intensity level.In this paper,we mainly concerned ourselves with the first stage,i.e.,to develop a method to best group HDR values.Quantization,also known as clustering,is a well-studied subject in signal processing and neural network literature.Well-known techniques such as k -means and various neural network-based methods have been extensively researched [18–21].Let x(k),k =1,2,...,be the intensities of the luminance compo-nent of the HDR image (like many other techniques,we only work on the luminance and in logarithm space,also,we treatG.Qiu et al./Pattern Recognition 40(2007)2641–26552643QuantizationInputHigh dynamic range data (real values)1x xMappingDisplaying Intensity LevelsFig.3.The process of display of high dynamic range scene (from purely anumerical processing’s point of view).each pixel individually and therefore are working on scalar quantization).A quantizer is described by an encoder Q ,which maps x(k)to an index n ∈N specifying which one of a small collection of reproduction values (codewords)in a codebook C ={c n ;n ∈N }is used for reconstruction,where N in our case,is the number of displayable levels in the LDR image.There is also a decoder Q −1,which maps indices into reproduction values.Formally,the encoding is performed as Q(x(k))=n if x(k)−c n x(k)−c i ∀i (1)and decoding is performed as Q −1(n)=c n .(2)That is (assuming that the codebook has already been de-signed),an HDR image pixel is assigned to the codeword that is the closest to it.All HDR pixels assigned to the same code-words then form a cluster of pixels.All HDR pixels in the same cluster are displayed at the same LDR level.If we order the codewords such that they are in increasing order,that is c 1<c 2<···<c N −1<c N ,and assign display values to pixels belonging to the clusters in the order of their codeword values,then the mapping is order preserving.Pixels belonging to a clus-ter having a larger codeword value will be displayed brighter than pixels belonging to a cluster with a codeword having a smaller value.Clearly,the codebook plays a crucial role in this dynamic range compression strategy.It not only determines which pix-els should be displayed at what level,it also determines which pixels will be displayed as the same intensity and how many pixels will be displayed with a particular intensity.Before we discuss how to design the codebook,lets find out what require-ments for the codebook are in our specific application.Recall that one of the objectives of mapping are that we wish to preserve all features (or as much as possible)of the HDR image and make them visible in the LDR reproduction.Because there are fewer levels in the LDR image than in the HDR image,the compression is lossy in the sense that there will be features in the HDR images that will be impossible to reproduce in the LDR images.The question is what should bepreserved (and how)in the mapping (quantization)in order to produce good LDR displays.For any given display device,the number of displayable lev-els,i.e.,the number of codewords is fixed.From a rate dis-tortion’s point of view,the rate of the quantizer is fixed,and the optimal quantizer is the one that minimizes the distortion.Given the encoding and decoding rules of Eqs.(1)and (2),the distortion of the quantizer is defined asE =i,ki (k) x(k)−c i where i (k)=1if x(k)−c i ≤ x(k)−c j ∀j,0otherwise .(3)A mapping by a quantizer that minimizes E (maximizes rate distortion ratio)will preserve maximum relevant information of the HDR image.One of the known problems in rate distortion optimal quan-tizer design is the uneven utilization of the codewords where,some clusters may have large number of pixels,some may have very few pixels and yet others may even be empty.There may be two reasons for this under utilization of codewords.Firstly,the original HDR pixel distribution may be concentrated in a very narrow range of intensity interval;this may cause large number of pixels in these densely populated intervals to be clustered into a single or very few clusters because they are so close together.In the HDR image,if an intensity interval has a large concentration of pixels,then these pixels could be very important in conveying fine details of the scene.Although such intervals may only occupy a relatively narrow dynamic range span because of the high-resolution representation,the pixels falling onto these intervals could contain important de-tails visible to human observers.Grouping these pixels together will loose too much detail information.In this case,we need to “plug”some codewords in these highly populated intensity intervals such that these pixels will be displayed into different levels to preserve the details.The second reason that can cause the under utilization of codewords could be due to the opti-mization process being trapped in a local minimum.In order to produce a good LDR display,the pixels have to be reasonably evenly distributed to the codewords.If we assign each code-word the same number of pixels,then the mapping is histogram equalization which has already been shown to be unsuitable for HDR image display [5].If we distribute the pixel popula-tion evenly without regarding to their relative intensity values,e.g.,grouping pixels with wide ranging intensity values just to ensure even population distribution into each codeword,then we will introduce too much objectionable artifacts because compression is too aggressive.In the next section,we intro-duce a learning-based approach suitable for designing dynamic range compression quantizers for the display of HDR images.3.Conscience learning for HDR compressionVector quantization (VQ)is a well-developed field [16](although we will only design a scalar quantizer (SQ),we will borrow techniques mainly designed for VQ.There are2644G.Qiu et al./Pattern Recognition40(2007)2641–2655 many methods developed for designing vector quantizers.Thek-means type algorithms,such as the LBG algorithm[18],and neural network-based algorithms,such as the Kohonenfeature map[19]are popular tools.As discussed in Section2,our quantizer should not only be based on the rate distortioncriterion,but also should ensure that there is an even spreadof pixel population.In other words,our quantizer should min-imize E in Eq.(3)and at the same time the pixels should beevenly distributed to the codewords.Therefore the design algo-rithm should be able to explicitly achieve these two objectives.In the neural network literature,there is a type of consciencecompetitive learning algorithm that will suit our application.Inthis paper,we use the frequency sensitive competitive learning(FSCL)algorithm[20]to design a quantizer for the mappingof HDR scenes to be displayed in low dynamic devices.Tounderstand why FSCL is ideally suited for such an application,wefirst briefly describe the FSCL algorithm.The philosophy behind the FSCL algorithm is that,when acodeword wins a competition,the chance of the same codewordwinning the next time round is reduced,or equivalently,thechance of other codewords winning is increased.The end effectis that the chances of each codeword winning will be equal.Putin the other way,each of the codewords will be fully utilized.In the context of using the FSCL for mapping HDR data tolow dynamic display,the limited number of low dynamic levels(codewords)will be fully utilized.The intuitive result of fullyutilized display level is that the displayed image will have goodcontrast,which is exactly what is desired in the display.How-ever,unlike histogram equalization,the contrast is constrainedby the distribution characteristics of the original scene’s inten-sity values.The overall effect of such a mapping is thereforethat,the original scenes are faithfully reproduced,while at thesame time,the LDR displays will have good contrast.FSCL algorithmStep1:Initialize the codewords,c i(0),i=1,2,...,N,to ran-dom numbers and set the counters associated with each code-word to1,i.e.f i(0)=1,i=1,2,...,NStep2:Present the training sample,x(k),where k is thesequence index,and calculate the distance between x(k)andthe codewords,and subsequently modify the distances usingthe counters valuesd i(k)= x(k)−c i(k) d∗i(k)=f i(k)d i(k)(4)Step3:Find the winner codeword c j(k),such thatd∗j(k) d∗i(k)∀iStep4:Update the codeword and counter of the winner asc j(k+1)=c j(k)+ (x(k)−c j(k))f j(k+1)=f j(k)+1where0< <1(5)Step5:If converged,then stop,else go to Step2.The FSCL process can be viewed as a constrained optimiza-tion problem of the following form:J=E+iki(k)−|x(k)|N2,(6)where is the Lagrange multiplier,|x(k)|represents the totalnumber of training samples(pixels),N is the number of code-words(display levels),E and are as defined in Eq.(3).Minimizing thefirst term ensures that pixel values close toeach other will be grouped together and will be displayed asthe same single brightness.Minimizing the second term facil-itates that each available displayable level in the mapped im-age will be allocated similar number of pixels thus creating awell contrast display.By sorting the codewords in an increasingorder,i.e.,c1<c2<···<c N−1<c N,the mapping also ensuresthat the brighter pixels in the original image are mapped to abrighter display level and darker pixels are mapped to a darkerdisplay level thus ensuring the correct brightness order to avoidvisual artifacts such as the“halo”phenomenon.Because the mapping not only favors an equally distributedpixel distribution but also is constrained by the distancesbetween pixel values and codeword values,the current methodis fundamentally different from both traditional histogramequalization and simple quantization-based methods.His-togram equalization only concerns that the mapped pixels haveto be evenly distributed regardless of their relative brightness,while simple quantization-based mapping(including many lin-ear and nonlinear data independent mapping techniques,e.g.,Ref.[2])only takes into account the pixel brightness valuewhile ignoring the pixel populations in each mapped level.As a result,histogram equalization mapping will create visu-ally annoying artifacts and simple quantization-based methodwill create mappings with under utilized display levels whichoften resulting in many features being squashed and becomeinvisible.With FSCL learning,we could achieve a balancedmapping.4.Implementation detailsBecause the objective of our use of the FSCL algorithm inthis work is different from that of its ordinary applications,e.g.,vector quantization,there are some special requirementsfor its implementation.Our objective is not purely to achieverate distortion optimality,but rather should optimize an ob-jective function of the form in Eq.(6)and the ultimate goalis,of course,to produce good LDR displays of the HDR im-ages.In this section,we will give a detailed account of itsimplementation.4.1.Codebook initializationWe work on the luminance component of the image only andin logarithm space,from thefloating point RGB pixel valuesof the HDR radiance map,we calculateL=log(0.299∗R+0.587∗G+0.114∗B),L max=MAX(L),L min=MIN(L).(7)In using the FSCL algorithm,we found that it is very importantto initialize the codewords to linearly scaled values.Let thecodebook be C={c i;i=1,2,...,N},N is the number ofcodewords.In our current work,N is set to256.The initialG.Qiu et al./Pattern Recognition 40(2007)2641–26552645020004000600080001000012000133659712916119322505000100001500020000250000326496128160192224petitive learning without conscience mechanism will produce a mapping close to linear scaling.Left column:competitive learning without conscience mechanism.Right column:linear scaling.Radiance map data courtesy of Fredo Durand.values of the codewords are chosen such that they are equally distributed in the full dynamic range of the luminance:c i (0)=L min +i256(L max −L min ).(8)Recall that our first requirement in the mapping is that the dis-play should reflect the pixel intensity distribution of the original image.This is achieved by the optimization of E in Eq.(3)with the initial codeword values chosen according to Eq.(8).Let us first consider competitive learning without the conscience mechanism.At the start of the training process,for pixels falling into the interval c i (0)±(L max −L min )/512,the same code-word c i will win the competitions regardless of the size of pixel population falling into the interval.The pixels in the intensity intervals that are far away from c i will never have the chance to access it.In this case,distance is the only criterion that de-termines how the pixels will be clustered and pixel populations distributed into the codewords are not taken into account.Af-ter training,the codewords will not change much from their initial values because each codeword will only be updated by pixels falling close to it within a small range.In the encodingor mapping stage,since the codewords are quite close to their corresponding original positions which are linearly scattered in the FDR,the minimum distortion measure will make the map-ping approximately linear and extensive simulations demon-strate that this is indeed the case.As a result,the final mapped image will exhibit the pixel intensity distribution characteris-tics of the original image.Fig.4(a)shows a result mapped by competitive learning without the conscience mechanism,com-pared with Fig.4(b),the linearly scaled mapping result,it is seen that both the images and their histograms are very similar which demonstrate that by initializing the codewords according Eq.(8),optimizing the distortion function E in Eq.(3)has the strong tendency to preserve the original data of the original im-age.However,like linear compression,although the resulting image reflects the data distribution of the scene,densely pop-ulated intensity intervals are always over-quantized (too much compression)which causes the mapped image lacking contrast.With the introduction of the conscience mechanism,in the training stage,competition is based on a modified distance measure,d ∗in Eq.(4).Note that if a codeword wins the competitions frequently,its count and consequently its modi-2646G.Qiu et al./Pattern Recognition 40(2007)2641–2655σ = 0.05, η(0) = 0.1 σ = 0.05, η(0) = 0.2 010002000300040005000600070008000900006412819210002000300040005000600070008000064128192100020003000400050006000700006412819210002000300040005000600070000641281921000200030004000500060007000064128192σ = 0.05, η(0) = 0.3σ = 0.05, η(0) = 0.4σ = 0.05, η(0) = 0.5Fig.5.Final mapped images and their histograms for fixed and various (0).Radiance map data courtesy of Fredo Durand.fied distance increases,thus reducing its chance of being the winner and increasing the likelihood of other codewords with relatively lower count values to win.This property is exactly what is desired.If a codeword wins frequently,this means that the intensity interval it lies in gathers large population of pixels.In order to ensure the mapped image having goodG.Qiu et al./Pattern Recognition 40(2007)2641–26552647η(0) = 0.2, σ= 0.05 020004000600080000641281922000400060008000064128192100020003000400050006000700006412819210002000300040005000600070000641281921000200030004000500060007000064128192η(0) = 0.2, σ = 0.04 η(0) = 0.2, σ = 0.02η(0) = 0.2, σ = 0.0087η(0) = 0.2, σ = 0.002Fig.6.Final mapped images and their histograms for fixed (0)and various .Radiance map data courtesy of Fredo Durand.contrast,these densely populated intensity intervals should be represented by more codewords,or equivalently,more dis-play levels.The incorporation of the conscience mechanism makes the algorithm conscience of this situation and passes the chances to codewords with lower count values to win the com-petitions so that they can be updated towards the population dense intensity intervals and finally join in the quantization of these intervals.2648G.Qiu et al./Pattern Recognition40(2007)2641–2655 The training starts from linearly scattered codewords,withthe introduction of the conscience mechanism,the code-words are moved according to both their values and the pixelpopulation distribution characteristics.At the beginning of thetraining phase,the mapping is linear,and the mapped image’shistogram is narrow,as training progresses,the mapped im-age’s histogram is gradually wider,and when it reaches anequilibrium,it achieves an optimal mapping that preserves theappearance of the original scene and also has good visibilityand contrast.Although initializing the codewords according to Eq.(8)may lead to largerfinal distortion E than other(random)meth-ods for codeword initialization,this does not matter.Unlike conventional use of FSCL,our objective is not to achieve rate distortion optimality,but rather,the aim is to cluster the HDR image pixels in such a way that the groupings not only reflect the pixel distribution of the original scene,the pixel populations are also evenly distributed to the codewords such that the im-age can be displayed in LDR devices with good visibility and contrast.Because of the special way in which the initial values of the codewords are set,some codewords may scatter far away from densely populated intensity intervals where more codewords are needed to represent the pixels.In order to achieve this,we let the fairness function,f i’s in Eq.(5)of the FSCL algorithm,accumulate the counts throughout the entire training process,thus increasing the chances to obtain more contrast.4.2.Setting the training rateThe training rate in Eq.(5)is an important parameter in the training of the quantizer.It not only determines the convergence speed but also affects the quality of thefinal quantizer.In the neural network literature,there are extensive studies on this subject.In our work,we use the following rule to set the training rate as a function training iterations(k)= (0)exp(− k)),(9) where (0)is the initial value set at the beginning of the training, is a parameter controlling how fast the training rate decadesas training progresses.In the experiments,we found that larger initial training rate values and slower decreasing speeds(smaller in Eq.(9)) led to higher contrast images when the algorithm achieved an equilibrium state.The result is rger initial val-ues and slower decreasing speed of the training rate make remain relatively large throughout.Once a codeword,which may be far away from densely populated intensity intervals, wins a competition,the larger training rate would drag it closer to the densely populated intensity intervals and thus increasing its chance to win again the next time round.Thefinal result is that densely populated intensity intervals are represented by more codewords or more display levels and the displayed im-ages will have more details.The effects for smaller training rates are almost the opposite,small training rate will result in1214161811011211411611810.20.30.40.50.6η(0)=EIterationsFig.7.Training curves forfixed =0.05and various (0)corresponding to those in Fig.5.the image having a narrower histogram(lower contrast)and more similar to the effect of linear compression.This is again expected.Because we initialize the codewords by linear scal-ing and small will make thefinal codewords closer to their initial values when the training achieves an equilibrium.Fig.5 shows examples of mapped images and their histograms with different (0)andfixed .Fig.6shows examples of mapped images and their histograms with different andfixed (0). By changing the training rate settings,the mapped image’s his-togram can be controlled to have narrower shapes(lower con-trast images)or broader shapes(higher contrast images).This property of the training rate provides the users with a good guidance to control thefinal appearance of the mapped HDR images.According to the above analysis,in order to control the final appearance of the mapped image,we canfix one param-eter and change the other.To achieve the same contrast for the final mapping,we can either use a smaller (0)and a smaller , or,a larger (0)and a larger .However in the experiments we found that,with a smaller (0)and a smaller ,the algorithm took longer to converge to an equilibrium state.Fig.7shows the training curves for the training rate settings corresponding to those in Figs.5and8shows the training curves for the train-ing rate settings corresponding to those in Fig.6.The image in Fig.5mapped with (0)=0.5and =0.05and the image in Fig.6mapped with (0)=0.2and =0.002have similar contrast.However,as can be seen from the training curves in Figs.7and8,for (0)=0.5and =0.05,the training con-verged within100iterations and for (0)=0.2and =0.002 the training took more than400iterations to converge.Thus as a guide for the use of the training algorithm,we recom-mend that the control of thefinal image appearance be achieved byfixing a relatively aggressive and adjusting (0)because of the fast convergence speed under such conditions.Setting (0)=0∼1and =0.05,and train the quantizer for100 iterations worked very well for all images we have tried.After 50iterations,E changed very little by further iterations,there-fore for most images,less than50iterations suffice.Through experiments,we also found that it was only necessary to use。
第11章20世纪20年代•意象派•庞德I.Fill in the blanks.1.“In a Station of the Metro”by Ezra Pound goes like this:The apparition of these faces in the crowd;_____.(首师大2008研)【答案】Petals on a wet,black bough.【解析】这是意象派诗人庞德的名作,意为:人群中这些面孔幽灵一般显现,湿漉漉的黑色枝条上许多花瓣。
2._____,by Ezra Pound,employs the complex association of scholarly lore, anthropology,modern history and personages,private history and Witticism,and obscure literary interpolations in various languages.(人大2006研)【答案】The Cantos【解析】庞德的《诗章》包罗万象,是庞德的代表作。
3.Author_____Title_____.(南京大学2007研)The apparition of these faces in the crowd;Petals on a wet,black bough.【答案】Author:Ezra Pound Title:“In a Station of the Metro”【解析】题目节选自庞德的《在一个地铁车站》,该诗是以一个意象作为叙述语言的典型范例。
4.Ezra Pound’s lifelong endeavor had been devoted to the writing of_____,which contains_____poems.(国际关系学院2007研)【答案】The Cantos;117【解析】庞德把毕生精力都投入到写作《诗章》当中,《诗章》共包括117首诗。
A peer-reviewed student publicationof the University at BuffaloDepartment of Library and Information Studies Collaborative tagging, folksonomies, distributed classification or ethnoclassification: a literaturereviewEdith SpellerAssistant LibrarianRoyal College of MusicLondon, United KingdomLibrary Student Journal,February 2007AbstractTagging, folksonomy, distributed classification, ethnoclassification—however it is labelled, the concept of users creating and aggregating their own metadata is gaining ground on the internet. This literature review briefly defines the topic at hand, looking at current implementations and summarizing key advantages and disadvantages of distributed classification systems with reference to prominent folksonomy commentators.After considering whether distributed classification can replace expert catalogers entirely, it concludes that distributed classification can make an important contribution to digital information organisation, but that it may need to be integrated with more traditional organisation tools to overcome its current weaknesses. Introduction The literature of tagging is largely opinion-based, almost entirely online, and the topic is largely absent from academic literature as it has only emerged as a system in the last two years. This review aims to make some sense of the subject by drawing out some dominant themes from the literature, with reference to a range of interesting and/or significant papers.DefinitionsMetadata creation, and who does it, is an important issue with the current explosion of textual and non-textual information available on the internet. In his seminal introduction to tagging and folksonomies, Mathes (2004) summarises three different agents who may create metadata: professionals (e.g. cataloguers), authors, and users. Tagging is an approach to user metadata creation where users describe information objects with a free-form list of keywords (‘tags’), often to allow them to organise and retrieve the objects at a later date. It is important to remember that objects can be tagged with as many or as few words as desired; there is no restriction to placing objects in one category. The tags produced by many users can be aggregated to form a non-hierarchical group of terms christened by Vander Wal as a ‘folksonomy’ (Porter, 2005; Smith, 2004). This can be searched or browsed by users, either to retrieve itemsthey previously tagged themselves, or to discover items tagged by other people. There is some argument over the most appropriate term to use for this type of system—as well as ‘folksonomy’, suggestions have included‘ethnoclassification’ (Merholz, 2004b), and ‘distributed classification’ (Mejias, 2004).‘Folksonomy’ is emerging as the dominant term, with Google results for the word in the tens of millions rather than the tens or hundreds of thousands found for the other terms. However, it is argued that folksonomy is a misleading term as the systems in question bear very little relation to taxonomies or ontologies (as clarified by Vander Wal, 2005), and that distributed classification is more descriptive of the tagging process (Hammond, Hannay, Lund, & Scott, 2005; Merholz, 2004a). Therefore, this article will refer to this type of system as distributed classification.PrecursorsFor some time, there has been awareness that existing models of information organisation needed revision and development to cope with both digital and multimedia information. Bates (1998) states that users performing unknown-item searches have a different level of knowledge from the indexers describing the objects for retrieval. She also contends that indexing and term selection is a deeply subjective process, affected by morphological, syntactic and semantic term variation, which means that imposing one person's view of an item in a retrieval system may hinder retrieval by others. The idea of asking users to index items was already being developed by Hidderley and Rafferty (1997), who saw the process as a possible way of indexing particularly subjective forms of information where full-text searching is either not possible or not useful, such as multimedia objects and fiction. They developed the idea of aggregating users' indexing terms to create a generalised overall view of the resources, which is being adapted by some working systems: for example, () search results display the most common tags used for each result. Current implementationsThe two best-known implementations of distributed classification are and Flickr (). The former is a social bookmarking system where users tag and store web links which they want to find again in the future, while the latter is a photo-sharing website where users upload and tag their own photos to aid retrieval by themselves and others. Multiple users tagging the same resource is rare in Flickr, although image owners can permit others to add new tags to their photos if they wish. There are numerous other interesting implementations of the idea. For example, CiteULike () has a similar approach to but is more focused on scholarly writing and journal articles in particular, allowing academics to keep a record of reading, and share useful references with others. Some sites are developing distributed classification of multimedia resources, such as Last.fm (st.fm) for music and YouTube () for video (often user-authored, like the photography in Flickr).Interestingly, there are also emerging attempts to organise offline resources using distributed classification. One example is LibraryThing () which enables users to create metadata records for their book collections based on MARC library catalogue records (or Amazon records) as well as tagging them. It currently boasts nine million (non-unique) catalogued items, and is becoming an impressive source of book information.A prototype library catalogue incorporating tagging came about after Levine (2005)mentioned the idea on her weblog. Pattern (2005a, 2005b) developed the idea and created both a ‘tag cloud’ (a visual representation of how popular different tags or subjects are) from his catalogue's professionally-added subject headings, and an experimental interface allowing users to tag books in the library catalogue. Casey Bisson has also been experimenting with alternative ways of displaying OPAC information, and has been awarded for his WPopac project (Bisson, 2006; Guinnee, 2006). The WPopac involves catalogue records being posted as blog entries, which allows records to be tagged and enables a variety of other enhancements to the OPAC, such as increasing the possibilities of finding items through alternative search systems, including Google. Advantages of distributed classificationThe consensus viewpointOne of the most evangelical supporters of distributed classification, Clay Shirky (2005b), gave a talk and wrote an essay entitled ‘Ontology is Overrated’ in early 2005. One of his key claims about distributed classification is that it can be harnessed to create a bottom-up consensus view of the world, which is more valid than any one view imposed from the top down. This ties in with the idea of ‘desire lines’ described by Merholz (2004b) and Kroski (2005). They argued that if index terms are created by users, other users are more likely to find what they need. This in turn corresponds with the ideas articulated by Bates mentioned above. A related idea is the theory of ‘wisdom of crowds’ by James Surowiecki (explained by Sinha, 2006). This suggests that there are four steps needed to harness the wisdom of crowds: diverse opinions, independent decision-making, decentralisation of power, and a way of aggregating opinions. All of these are usually possessed in distributed classification systems to differing degrees. The ease of participation described by Mathes (2004) and Kroski (2005) should help to enable anyone who wants to contribute to do so. One argument against these ideas, particularly desire lines, is given by Powers (2005), who extends the metaphor to contend that this system gives disproportionate power to the few, saying paths are worn by young people who don’t care about the common good. It is debatable whether giving most of the power to some opinionated people is better than giving all the power to an educated few, but at least the former allows input from a broad spectrum of information users.Pseudo-faceted classification and analogue classification: ‘this is probably about x, but might be about y too’ Pseudo-faceted classification, or the classification of objects using several aspects of their ‘nature’ simultaneously, is a feature shared by many thesauri, such as those used for indexing journal articles. However, at present the indexing terms generated by distributed classification are not grouped together in any way like a true faceted scheme, which usually consists of multiple navigable hierarchies (Weinberger, 2006). A few attempts to aggregate tags into facets are underway at present, such as (/facetious/facetio us.jsp; using data from ), and the tag section of Mefeedia(/tags). Golder and Huberman (2006) point out that tags can be seen as filters which can be used to create combinable sets of search results. Analogue classification is tangentially related to faceting. When many users have classified the same object, the degree of term overlap can be used to tell users that the object is thought to be about subject x by (say) 75% of users, while 30% of users see it as being about subject y. Hammond et al. (2005) thinks this will be useful when search results are ranked by relevance,while Shirky (2005b) explains that this can also be used to automatically determine which terms are perceived as synonymic.Rapid adaptability to changing vocabulariesA commonly cited advantage of distributed classification is its flexibility and ability to reflect changing terminologies, without the substantial effort involved in choosing and adding terms to a controlled vocabulary (Hammond, et al., 2005; Kroski, 2005; Mathes, 2004; Merholz, 2004b; Shirky, 2005b). This is helpful in the rapidly evolving technology field but may also be relevant more generally, especially with more subjective information: Veltman (2004) contends that cultural information is very context-dependent and its meaning may well change over time. On the other hand, Smith (2005) points out in his critique of Shirky’s essay that unless people reclassify older objects after shifts in vocabulary, distributed classification systems will face the same problems as traditional classification schemes. This means many items will become difficult to retrieve or may be indexed confusingly. Perhaps there is a need for some sort of time-weighting or an expiry date for tags, although this may cause its own problems: for example, older tags with current relevance could receive a lower weighting than newer and less useful tags, simply because of their age. Serendipitous browsingSome feel that distributed classification is an excellent tool for serendipitous browsing: the flat structure of the metadata can be beneficial as it allows for more chance discovery through exploring related tags, which may have been widely separated in a thesaurus (Kroski, 2005; Mathes, 2004). This aspect of the concept helps to support this method of information-seeking online and make up for the reduction of users browsing a physical library collection, especially in the context of OPAC searching. Tagging can be used to make keyword searches more effective and more closely linked to users' own views of the material in question. This may enable more fruitful searching than keyword searching of more traditional metadata such as title and imposed subject headings. Disadvantages of distributed classificationSynonyms and homonymsSynonyms and homonyms present different but related problems to distributed classification systems, as pointed out by many writers (Golder & Huberman, 2006; Guy & Tonkin, 2006; Kroski, 2005; Mathes, 2004; Merholz, 2004b; Powers, 2005). Distributed classification usually makes no allowance for formal identification of synonyms, which leads to the fracturing of collections and reduced recall when searching the system (Kroski, 2005). aims to aid retrieval by automatically finding ‘common tags’, i.e. those often used in combination with the search term, and suggesting the user searches for these tags too. LibraryThing (2007) takes this a step further and allows users to select synonymous tags from the list of related terms, which the system then groups together: for an example see the‘library science’ tag.The presence of homonyms in the system means that search precision is reduced: one example is that a search for ‘apple’ may give results about both fruit and the technology company, one of which is bound to be irrelevant to the searcher's needs (Weinberger, 2006). Flickr (2007) tries to improve precision by automatically generating ‘clusters’ of terms to disambiguate different meanings of the search term, which can work well: for example, look at the clusters formed around the ‘apple’ tag. Of course, this increase in precision results in a loss of recall as some photos may be tagged ‘apple’ only and sowill not be found but, as Kroski (2005) asserts, this is a necessary trade-off. Golder and Huberman (2006) suggest the same solution but performed manually— searching for more than one tag simultaneously will reduce the homonymy problem.‘Sloppy’ tagging: morphological, syntactic and semantic term variation Indexing terms selected without guidance by a large group of untrained users are almost inevitably going to be inconsistent and even inaccurate. Two morphological problems are the use of singular versus plural nouns, and the varying capitalisation of terms, which can be partly solved using stemming and treating tags in different cases as synonymous. However, Shirky (2005b) feels that any form of aggregating terms dilutes the strength of distributed classification, and Mejias (2005) points out that users may use ‘apples’ instead of‘Apple’ to distinguish the fruit from the technology company. Guy and Tonkin (2006) found that a substantial proportion of tags were misspelled, although this included many compound-word tags, which are not yet handled consistently; users often insert punctuation to separate words. This may not matter if items are tagged many times by different users and reach a ‘critical mass,’ allowing cross-referencing between different spellings, but in a system like Flickr where photos tend only to be indexed once, a misspelling can lead to the item being very difficult to find.Multilingual user groups also cause problems for distributed classification, as the lack of structure makes it difficult for tags in one language to be translated into another, and some systems cannot even handle non-Latin alphabets adequately (Guy & Tonkin, 2006). Powers (2005) takes this point further and argues that, as some languages are less suitable for keyword indexing of any sort, distributed classification as a system is "based on bias, formed from a specific culture, which tends to be male, western, with English as a native language" (¶ 45) The implication is that it is little better than the inherent structural biases of a system like the Dewey Decimal Classification. However, Shirky (2005a) argues that at least with a distributed classification system the people creating metadata tend to be visible members of the system which allows their possible bias to be understood and taken into account. Guy and Tonkin (2006) hope that user profiles will become more extensive and that discussion facilities can be integrated into the systems to allow people to explain why they have tagged objects in a particular way. Several writers also hope that systems can be developed further to encourage better tagging through suggesting popular tags (which already does when users tag links), suggesting different facets of the object to describe, or giving feedback (Guy & Tonkin, 2006; Hammond, et al., 2005; Mathes, 2004; Pind, 2005). An alternative is the user community deciding on voluntary tagging guidelines (perhaps a new netiquette), for example whether to use singular or plural nouns and how to handle compound terms. But creating these guidelines may in itself hinder the system's ease of use which is one of its great benefits (Guy & Tonkin, 2006; Mejias, 2005).A thorny semantic problem is the issue of‘basic level variation’ described by Kroski (2005), and Golder and Huberman (2006). This relates to how much detail an individual will go into when tagging a resource: Golder and Huberman (2006) give the example of an average person naturally tagging a photo as ‘bird’ when a birdwatcher would have naturally tagged it ‘robin’. This difference means that the two users may find each other's tags next-to-useless because they are at the wrong level of specificity for their needs. Hierarchy and structured vocabularies come into their own when facing this problem: this is one of the strongest arguments in favour of finding a way to synthesise hierarchical structuresinto distributed classification without destroying its essence.Can distributed classification replace expert cataloguers? Some commentators feel that distributed classification is inevitable and essential if we are to successfully organise online information, due to the money and labour required to catalogue objects using other methods (Kroski, 2005; Shirky, 2005a). Most agree that distributed classification is useful and that it is unlikely to go away, but they still see important functions that other organisation systems should fulfil. Lawley (2005) says folksonomies are extremely useful, but she does not think "all expertise can be replicated through repeated and amplified non-expert input". Smith (2005) concurs, saying "One can be enthusiastic about tags and folksonomies (I am) and still confront the serious problems that face them as a stand-alone tool for organizing information." Hammond et al. (2005) and Guy and Tonkin (2006) agree that tagging can play a complimentary role alongside more formal types of organisation.There are many other areas relating to distributed classification which there is not space to discuss here: for example, the social issues surrounding tagging including spamming, the issue of privacy and the growth of social networks, as well as the topic of trust and authority (Blood, 2005; Hammond, Hannay, Lund, & Scott, 2005; Kroski, 2005; Lawley, 2005; Sinha, 2006). The cognitive process behind tagging is another interesting area, which Sinha (2005) is exploring.ConclusionDistributed classification is in its infancy both as a theory and as a system in practice. The emergent viewpoint is that the system may work best when organising non-physical information objects in tandem with ‘traditional’ information organisation tools such as controlled thesauri, but how this could happen in practice has not yet been worked out. Research and experimentation in this area is necessary; one promising area appears to be the integration of tagging into OPACs, working in conjunction with traditional cataloguing; another may be the use of user-generated indexing to devise a thesaurus more relevant to users' needs and use of language. Raising the quality of tagging is an important challenge unless aggregation of tags can be used to get around the problems of ‘sloppy’ tagging. The level of specificity used when indexing may well become a greater issue as collections grow: users are already discovering that the level of specificity they chose to use when first indexing items may be too general once their collection grows. The folksonomy will not eliminate traditional forms of classification, as its greatest cheerleaders have claimed, but instead will perform a complimentary role, and will become a useful tool for information professionals and others aiming to organise and enable access to information objects. ReferencesBates, M. (1998). Indexing and access for digital libraries and the internet: Human, database, and domain factors. Journal of the American Society for Information Science, 49(13), 1185–1205.Bisson, C. (2006). WPopac: An OPAC 2.0 Testbed. Retrieved 17 January, 2007, from /blog/post/11133/ Blood, R. (2005). I've noticed a slight problem with the Technorati tagging system. Retrieved 17 January, 2007, from/archive/2005/0 1.html#11technoratiFlickr. (2007b). Clusters for the 'apple' tag. Retrieved 17 January, 2007, from/photos/tags/apple/clus ters/Golder, S., & Huberman, B. (2006). Usage patterns of collaborative tagging Systems. Journal of Information Science, 32(2), 198–208.Guinnee, E. (2006). Bisson's WPopac wins Mellon Award. Retrieved 17 January, 2007, from/20 06/12/bissons-wpopac-wins-mellon-award.htmlGuy, M., & Tonkin, E. (2006). Folksonomies: Tidying up tags? [Electronic Version]. D-Lib Magazine, 12. Retrieved 17 January, 2007, from/dlib/january06/guy/01guy .htmlHammond, T., Hannay, T., Lund, B., & Scott, J. (2005). Social bookmarking tools (I): A general review [Electronic Version]. D-Lib Magazine, 11. Retrieved 17 January, 2007, from/dlib/april05/hammond/04 hammond.htmlHidderley, R., & Rafferty, P. (1997). Democratic indexing: An approach to the retrieval of fiction. Information Services & Use, 17(2/3), 101–109.Kroski, E. (2005). The Hive Mind: Folksonomies and user-based tagging. Retrieved 17 January, 2007, from/2005/12/07/t he-hive-mind-folksonomies-and-user-based-tagging/Lawley, L. (2005). Social consequences of social tagging. Retrieved 17 January, 2007, from/archives/2005/01/2 0/social_consequences_of_social_tagging.p hp Levine, J. (2005). MLS February Tech Summit on Social Bookmark Services. Retrieved 17 January, 2007, from/archives/ 2005/01/18/mls_february_tech_summit_on_ social_bookmark_services.html LibraryThing. (2007). Library Science tag. Retrieved 17 January, 2007, from/tag/library+scien ceMathes, A. (2004). Folksonomies - cooperative classification and communication through shared metadata. Retrieved 17 January, 2007, from/academic/com puter-mediated-communication/folksonomies.html Mejias, U. A. (2004). Bookmark, classify and share: A mini-ethnography of social practices in a distributed classification community. Retrieved 17 January, 2007, from/ideant/2004/12/a_ delicious_stu.htmlMejias, U. A. (2005). Tag literacy. Retrieved 17 January, 2007, from/ideant/2005/04/ta g_literacy.htmlMerholz, P. (2004a). Ethnoclassification and vernacular vocabularies. Retrieved 17 January, 2007, from/archives/000387.ht mlMerholz, P. (2004b). Metadata for the masses. Retrieved 17 January, 2007, from /publications/e ssays/archives/000361.phpPattern, D. (2005a). Taggytastic! Retrieved 17 January, 2007, from/blog/index.php/archi ves/46/Pattern, D. (2005b). Taggytastic - part 3. Retrieved 17 January, 2007, from/blog/index.php/archi ves/57/Pind, L. (2005). Folksonomies: How we can improve the tags. Retrieved 17 January, 2007, from/articles/2005/01/23/folkson omies-how-we-can-improve-the-tagsPorter, J. (2005). I’ve heard of folksonomies, Now how do I apply them to my site? Retrieved 17 January, 2007, from /archives/applying_f olksonomies/Powers, S. (2005). Accidental smarts á la mode (a response to just about about any body who is interested). Retrieved 8 January, 2007, from/2005/02/10/ac cidentalsmarts/Shirky, C. (2005a). Folksonomies are a forced move: A response to Liz. Retrieved 17 January, 2007, from/archives/2005/01/2 2/folksonomies_are_a_forced_move_a_res ponse_to_liz.phpShirky, C. (2005b). Ontology is Overrated: Categories, Links, and Tags. Retrieved 17 January, 2007, from/writings/ontology_ove rrated.htmlSinha, R. (2005). A cognitive analysis of tagging (or how the lower cognitive cost of tagging makes it popular). Retrieved 17 January, 2007, from/archives/05_09 /tagging-cognitive.htmlSinha, R. (2006). A social analysis of tagging (or how tagging transforms the solitary browsing experience into a social one). Retrieved 17 January, 2007, from /archives/06_01 /social-tagging.html Smith, G. (2004). Folksonomy: social classification. Retrieved 17 January, 2007, from/archives/2004/08/folksono my_social_classification.htmlSmith, G. (2005). Market populism in the folksonomies debate. Retrieved 17 January, 2007, from/archives/2005/04/market_p opulism_in_the_folksonomies_debate.html Vander Wal, T. (2005). Folksonomy definition and Wikipedia. Retrieved 17 January, 2007, from/random/entrysel.p hp?blog=1750Veltman, K. H. (2004). Towards a semantic web for culture [Electronic Version]. Journal of Digital Information, 4. Retrieved 17 January, 2007, from/Articles/v04/i04/Veltman /Weinberger, D. (2006). Taxonomies and Tags: From Trees to Piles of Leaves. Retrieved 17 January, 2007, from/blogger/misc/taxo nomies_and_tags.htmlAuthor's BioEdith Speller works as an Assistant Librarian at London's Royal College of Music, and recently completed an MSc in Library and Information Studies at City University. Her dissertation researched affective (emotional) dimension user indexing of pop music. Edith's pre-qualification work experience includes a graduate traineeship at the London Library. Edith maintains a personal weblog(/edith/weblog/) in which she writes about her studies as well as more general issues relating to librarianship.。
The image retrieval based on transformdomainWei-bin FuHainan UniversityCollege of Information Science and TechnologyHaikou Hainan, China***************Jing-bing Li*Hainan University,College of Information Science and TechnologyHaikou Hainan, China**************************Meng-xing HuangHainan UniversityCollege of Information Science and TechnologyHaikou Hainan, China*****************Yi-Cheng LIHainan University,College of Information Science and TechnologyHaikou Hainan, China***************Abstract—Due to the most of popular algorithms based on image retrieval have a large calculation. While the method of DCT domain have less calculation, and compatible with international popular standard of data compression (JPEG、MPEG、H261/263). So this paper proposes an image retrieval method based on DCT compression. First, we can extract the feature vector of the image through the DCT transform, and then set up characteristic databases, finally through matching the feature vector of the normalized correlation coefficient (NC) to realize the image retrieval. The results show that this method can not only reduce the database storage space occupied, but also can effectively resist the conventional attacks and geometrical attacks, has strong robustness.Keywords-image retrieval; DCT; feature vector; normalized correlation coefficient; robustness.I.INTRODUCTIONWith the rapid development of Internet, multimedia technology, and computer technology, people began to use a variety of advanced technology to gather and produce various types of multimedia data, including text, images, sound, video, etc. Image as a rich content multimedia data, has become an irreplaceable important network information resources, it contains more information than the text. In the face of huge amounts of image data, how to better implement quickly and accurately to retrieve the information that users need, has become the urgent problem to solve [1][2].In the 80 s, although the multimedia technology is developing rapidly, and the image acquisition, creation, compression, storage technology has made remarkable achievements, but the management of the image information has not been given enough attention. In the early 90 s, with the emergence of large-scale digital image library makes the image data is growing fast. And the image data is transmitted through the network to all over the world. Therefore, how rapidly and efficiently from the vast amounts of image data to retrieve the information you need is a current important problem in many applications [3].The traditional information retrieval is based on the numerical/character. It does not objectively reflect the diversity of image content. Its mathematical model, system structure, such as inquiry mode and the user interface also does not have effective management and the ability to retrieve the image data [4]. In order to realize automatic and intelligent Image query and management mode, and achieve a single intervention management work. A new image retrieval technology, content-based Image Retrieval technology (CBIR, Content - -based Image Retrieval) was proposed and developed rapidly. CBIR based on computer vision and image understanding theory, combining the artificial intelligence, object-oriented technology, cognitive psychology, database and other multi-disciplinary knowledge. Image content description is no longer rely on manual annotation, but with the help of visual features of automatically extracted from the image, the retrieval process is no longer a keyword matching, but the similarity matching between the visual features[5][6][7].However, the current problems still existing in content-based image retrieval are as follow:(1)The image retrieval Based on image color feature index of the characteristics of the main problems is a person of color visual perception and consideration is still not enough.(2)The image retrieval Based on image texture feature index of the main problems is that a variety of methods to choose texture feature set depends on the specific texture image.(3) While the image retrieval based on shape feature, automatic extraction of shape boundary has been the main problem in image processing field for many years. In the present retrieval systems mostly adopt the way of manual outline. To extract shape feature is a very heavy work, and mass image data for this problem will appear more prominent.(4) At present most popular algorithms, they all have the shortcomings of great amount of calculation.In view of the above problems, this paper proposes an image retrieval method based on DCT compression.International Conference on Mechatronics, Electronic, Industrial and Control Engineering (MEIC 2015)First, we can extract the feature vector of the image through the DCT transform, and then set up characteristic databases, finally through matching the feature vector of the normalized correlation coefficient (NC) to realize the image retrieval. The algorithm is simple, and can greatly reduce the database storage space, has a certain ability to resist conventional and geometric attacks[8][9][10].II.B ASIC THEORYA.Two-dimensional discrete cosine and reversetransformation formulaA M×N matrixA two-dimensional discrete cosine transform (DCT) is formula is as follows:(2)Two-dimensional discrete cosine transformation (IDCT) formula is as follows:(4)The x, y is the sampling value for space domain; u, v is the samples values for the frequency domain. In the digital image processing, digital image usually expressed in pixel phalanx, namely, M = N.III.A LGORITHM PROCESSWe choose an image with black box as the original image, and black border is to ensure that conservation of energy when the original image geometry transform. The original image to remember: F={f(i,j)|f(i,j)∈R;1≤i ≤N1,1≤j≤N2 .F (i, j) is the pixel gray value of the original image. In order to facilitate the operation, we assume that the N1=N2=N.A.The characteristics of the original image vectorselection methodFirst of all, we put the original image to global DCT transform, and get the DCT coefficient matrix FD (i, j). Then take in the DCT coefficient matrix of F (1, 1) ~ F (1, 10) ten low intermediate frequency coefficient. We found that when the image is under the geometric attacks, the size of the low part of the DCT intermediate frequency coefficient changed but the symbols (on behalf of the component or 180 ° in the direction of the phase) basically didn’t change. We use “1” to express the positive DCT coefficients, and use “0” to express the negative coefficient (including the zero), as shown in table 1 coefficient of symbol sequence, we observed the column can be found that regardless of conventional attacks or geometric attacks, the symbol can maintain similar sequences and the original image sequence of symbols, and the original symbol sequence correlation coefficient is larger (see last column here took 10 DCT coefficient symbol)T ABLE11 FULL ORIGINAL IMAGE DCT TRANSFORM COEFFICIENT OF LOW FREQUENCY PART AND DIFFERENT ATTACKS AFTER THE CHANGE OF THEVALUEFor different original image get coefficients of image sequences through the above mentioned methods, and each image is obtained by symbolic operation sequence of the low intermediate frequency DCT symbols (taking the former 32-bit), and characteristic vector, as shown in table 2 indicate different between the original image, feature vector is large, less relevant, and less than 0.5.T ABLE 2 DIFFERENT ORIGINAL IMAGE FEATURE VECTORCORRELATION COEFFICIENT (WITH NO BLACK BOX)As a result, the DCT coefficient of image symbol sequence can be used as its visual feature vector.B.Establishing database of image featuresStep1: An image feature vector obtained by the DCT transforms.We let each of the original image in the global DCT transform, and get the DCT coefficient matrix FD (i, j), then to Zig - Zag scanning of DCT coefficient matrix, from low to high frequency DCT coefficients obtained sequence Y(j), and then choose the former L value, and the visual characteristics of the original image is obtained by symbolic operation vector V(n), L is the number of transform coefficient, this paper is 32.(5)(6)(7)Step2: Putting the original image feature vector in the original image feature database C.To implement image retrievalStep3: To obtain the retrieve image feature vector by DCT transform.Set to retrieve images to F '(i, j), through global DCT transform, get the DCT coefficient matrix FD' (i, j), according to the above Step1, seeks to retrieve image visual feature vector V’.(8)(9)(10)Step4: Use the peak signal-to-noise ratio (PSNR) evaluation to retrieve image quality after the attack. Peak signal to noise ratio PSNR of the formula is:(11)I (i, j), I '(i, j) are the original image and retrieve images. In (i, j) this pixel values, M and N represent the image of the row and column, for the convenience of operation, usually digital image in pixels square, namely, M = N. Peak signal to noise ratio is a power signal is possible and destructive affected the accuracy of his said noise power ratio engineering terms, usually adopt peak signal-to-noise ratio as an objective evaluation standard of image quality.Step5: Matching all visual feature vector V (n) in the database with retrieve image visual feature vector V ',and get the normalized correlation coefficient NC (n). The normalized correlation coefficient formula NC (n) is :(12)Step6: Put the picture of the NC (n) is greater than 0.5 presses from big to small order, and supply the user to select pictures.Fig .1 is the flow chart of the algorithm.Figure 1 flow chart of the image retrieval algorithm based on DCTtransform domainIV. T HE EXPERIMENTAL RESULTSWe are using Matlab2010a simulation platform. The original image is shown in Fig .2 (a), the original image is expressed as F (i, j), 1≤i ≤128,1≤j ≤128; The DCT transform coefficient matrix is the FD (i, j), 1≤i ≤128,1≤j ≤128. Through the coefficient of low frequency part of its symbolic operation to get the image visual feature vector. Considering the robustness and the time complexity of the algorithm, we take the former 32 coefficient in the low intermediate frequency (a plural has a real part and imaginary part of two coefficient). We judge the retrieve images which is user wanted bycalculating the normalized correlation coefficient (NC)(a).original image (b). detector responseFigure 2 No attack on the similarity of the original image detectionFig . 2(b) for no attack on the similarity of the original image detection, we can see the NC = 1.0, you can retrieve the original image. A. Conventional attack 1) Gaussian noiseLabel to the original texture image with Gaussian noise interference, noise intensity was 20%. At this point, the image PSNR = 9.95 dB, by observing the Fig .3 (a) can be found that images have become blurred; Can see from Fig .3 (b), can still detect the label for the originaltexture image, NC = 1.0.(a). Gaussian noise (b). detector response intensity was 20%Figure 3 Gaussian noise intensity of 20% retrieval image andsimilarity detection T ABLE 3 G AUSSIAN NOISE INTERFERENCE EXPERIMENT DATANC 1.0 1.0 1.0 1.0 1.0 1.0 1.0To observe the experimental data can be seen in table 3, when Gaussian noise intensity is as high as 90%, NC = 1.0, still can pass the test judging is the original image. It indicates that the algorithm has a good ability to resist Gaussian noise interference. 2) JPEG compressionOriginal image to JPEG compression, when the compression quality is 4%, the image appears square effect, as shown in Fig .4 (a). See from Fig .4 (b) still can retrieve the original image, NC = 1.0.(a). JPEG compression (b). detector response quality of 4%Figure 4 JPEG compression quality of 4% for detecting andsimilarity retrieval imagesT ABLE 4 JPEG COMPRESSION EXPERIMENT DATAquality(%) 2 4 8 10 20 40 PSNR(dB)25.87 27.78 31.49 32.62 36.05 39.25 NC1.01.01.01.01.01.0Observe the experimental data in table 4, when the compression quality is 4%, with NC = 1.0, still can accurately retrieve the original image. As a result, the algorithm has a very ideal JPEG attack resistance. B. Geometric attacks 3) Rotation transformationThe original image is 3 degrees clockwise, as shownin Fig .5 (a), Fig .5 (b) as the similarity of detector response, this time the sex ratio of the image is very low,TABLE PSNR = 15.61dB, but NC = 0.76, still can accuratelydetect for the original image.(a). Clockwise 3 ° (b). detector response Figure 5 5 ° clockwise to retrieve images and similarity detectionT ABLE V R OTATION TRANSFORM TO THE EXPERIMENTAL DATAdegree(clockwise) 1° 3° 5° 7° 9° PSNR(dB) 20.23 15.61 13.86 12.79 12.13 NC0.940.760.690.630.58By the experimental data in table 5, we observed rotation degrees up to 9 degrees, NC = 0.58, still can be more accurate to detect for the original image. Therefore, the presented algorithm has stronger ability to resist rotation attack.4) The scaling attackTo reduce 0.5 times as the original image, clear image decreases a lot, as shown in Fig .6 (a). From Fig .6 (b) you can get, NC = 1.00, can be accurately detected forthe original image.(a). narrow the (b). detector response image 0.5 times Figure 6 Images of the scaling factors of 0.5 and similaritydetectionVI S CALING ATTACK EXPERIMENTAL DATAfactor 0.4 0.5 0.8 1.2 2.0 4.0 NC1.001.001.001.001.001.00According to table 6 experimental data shows that when the scaling factor is 4.0 can be detected as the original image, NC = 1.00. Therefore, this algorithm has strong ability of anti scaling attack.V.C ONCLUSIONThis paper puts forward a kind of image retrieval algorithm based on transform domain. It combines visual feature vector, symbolic operation and database technology. The experiment results show that the algorithm can resist some regular attack and geometric attack ability, and has strong robustness. In addition, the algorithm is realized in the database storage features vector instead of the original image, greatly reduces the storage space. Therefore, this method has good practicality in the process of practical application.ACKNOWLEDGEMENTThis work is supported by the National Natural Science Foundation of China (No:61263033) and the Institutions of Higher Learning Scientific Research Special project of Hainan Province (Hnkyzx2014-2) and the Key Science and Technology Project of Hainan (No: ZDXM20130078).R EFERENCE[1] eklund Yi. The combination of SIFT features and PGH imageretrieval method research [D]. Chongqing university, 2013.[2] Sun Jun. Content-based image retrieval technology research [D].Xi 'an university of electronic science and technology, 2005. [3]Xiang-lin Huang, Zhao zhongxu. Content-based image retrievaltechnology research [J]. Journal of electronics, cut flower production potentials of 2002:1065-1071.[4]Flickner M.,Sawhney H.,Niblaek W.,etal.,Query by image andvideo content: The QBIC System.IEEE ComPuter,1995,28(9):23一32.[5] Smith J.R.,Chnag5.F.,VisualSEEK:a fully automated content-based image query system.Pore.ACM Multimedia Nov.1996,PP.87一98.[6] Cllad C.,Segre B.,Hayit.,et al.Bloekworid:image segmentationusing Expectation-maximization and its application to image querying.IEEE Trans on PAMI,2002,24(8):1026一1038.[7]Xu Qing, Yang Weiwei, Chen Shengtang. Content-based imageretrieval technology [J]. Computer technology and development, 2008,01: + 131 126-128.[8] Cox I, Kilian J, Leighton T, Shamoon T, “Secure spread spectrumwatermarking for multimedia ,” IEEE Transactions on Image Processing,6(12),pp.1673-1687,1997.[9] Ester Yen and Li-Hsien Lin,"Rubik’s cube watermark technologyfor grayscale images", Vol 37(6), pp 4033-4039, Jun. 2010. [10] Alar Kuusik, Enar Reilent, Ivor Loobas, Marko Parve, "SoftwareArchitecture for Modern Telehealth Care Systems", AISS, Vol. 3, No. 2, pp. 141 ~ 151, 2011.。
提升自我形象的方法英语作文英文回答:Improving one's self-image is a process that requires effort and self-reflection. There are several methods that can help boost self-image and enhance personal confidence.First and foremost, it is essential to take care of oneself physically. This includes maintaining a healthy lifestyle, such as exercising regularly, eating nutritious foods, and getting enough sleep. When we feel physically well, it positively affects our mental state and self-perception. For example, I used to neglect my physical health by not exercising regularly and eating unhealthy foods. However, once I started taking care of my body and making healthier choices, I noticed a significant improvement in my self-image.Additionally, setting and achieving personal goals can greatly contribute to enhancing self-image. By settingrealistic and attainable goals, we can experience a sense of accomplishment and boost our self-confidence. For instance, I set a goal to learn a new language within a year. As I made progress and eventually achieved fluency, my self-image improved because I felt capable and accomplished.Another effective method is practicing self-acceptance and embracing one's flaws. We all have imperfections, and it is important to recognize and accept them. By embracing our flaws, we can focus on our strengths and build a positive self-image. For example, I used to be self-conscious about my public speaking skills. However, I started attending public speaking workshops and gradually improved my confidence. Instead of dwelling on my initial shortcomings, I focused on my progress and eventually developed a more positive self-image.Furthermore, surrounding oneself with positive and supportive individuals can greatly impact self-image. Negative influences can bring us down and damage our self-confidence. On the other hand, being around people whobelieve in us and encourage our growth can help us developa more positive self-image. For instance, I had a friendwho constantly criticized my choices and made me doubt myself. Once I distanced myself from that negativeinfluence and surrounded myself with supportive friends, my self-image improved significantly.Lastly, practicing self-care and engaging in activities that bring joy and fulfillment can contribute to a positive self-image. This includes engaging in hobbies, spendingtime with loved ones, and practicing self-care rituals such as meditation or taking relaxing baths. When we prioritize our own well-being and engage in activities that bring us joy, it positively impacts our self-perception. For example, I started dedicating more time to my hobbies, such as painting and playing the guitar. As I immersed myself in these activities, I felt a sense of fulfillment and myself-image improved.In conclusion, there are various methods to enhanceself-image, including taking care of oneself physically, setting and achieving personal goals, practicing self-acceptance, surrounding oneself with positive influences, and engaging in activities that bring joy. By incorporating these methods into our lives, we can improve our self-perception and boost our self-confidence.中文回答:提升自我形象是一个需要努力和自我反思的过程。