Juniper ssg isg防火墙 哪些程序占用,造成cpu利用率高
- 格式:docx
- 大小:30.47 KB
- 文档页数:6


USG防火墙故障定位主要命令汇总故障定位在现网出现故障时,如何排除和定位防火墙是否转发报文或者丢弃报文,可采用以下方法按顺序进行,总的原则就是先确定是否是防火墙丢包,然后再定位报文是否到达防火墙。
1. 查看会话使用场合针对可以建会话的报文,可以通过查看会话是否创建以及会话详细信息来确定报文是否正常通过防火墙。
命令介绍display firewall session table [ verbose ] [ source { inside ip-address | global ip-address } ] [ destination { insideip-address | global ip-address } ] [ source-vpn-instance{ vpn-instance-name | public } ] [ dest-vpn-instance{ vpn-instance-name | public } ] [ application protocol–name1 ][ protocol protocol–name2 ] [ nat ][ source-port source-port ][ destination-port destination-port ] [ long-link ]使用方法首先确定该五元组是否建会话,对于TCP/UDP/ICMP(ICMP只有echo request和echo reply建会话)/GRE/ESP/AH的报文防火墙会建会话,其它比如SCTP/OSPF/VRRP等报文防火墙不建会话。
如果会话已经建立,并且一直有后续报文命中刷新(有报文命中时,Left会被刷新成与TTL相同的值),基本可以排除防火墙的问题。
如果没有对应的五元组会话或者对于不建会话的报文,继续后续排查方法。
Global:表示在做NAT时转换后的IP;Inside:表示在做NAT时转换前的IP。

cpu占用率高的原因CPU占用率高的原因CPU(Central Processing Unit)是计算机的核心部件,负责处理计算机的所有指令和数据。
当计算机的CPU占用率过高时,系统的响应速度会变慢,甚至会出现卡顿、死机等问题。
那么,CPU占用率高的原因有哪些呢?1. 病毒或恶意软件病毒或恶意软件是导致CPU占用率高的主要原因之一。
这些软件会在后台运行,占用大量的CPU资源,导致系统变慢。
用户可以通过安装杀毒软件来检测和清除病毒或恶意软件。
2. 系统进程或服务系统进程或服务也可能导致CPU占用率高。
例如,Windows操作系统中的svchost.exe进程会在后台运行多个服务,如果其中某个服务出现问题,就会导致CPU占用率高。
此时,用户可以通过任务管理器来停止相关进程或服务。
3. 应用程序应用程序也是导致CPU占用率高的原因之一。
例如,视频播放器、图形处理软件等需要大量CPU资源来处理数据的应用程序,会导致CPU占用率高。
此时,用户可以尝试关闭其他应用程序,以减少CPU的负载。
4. 系统缺陷系统缺陷也可能导致CPU占用率高。
例如,操作系统中的BUG、驱动程序的问题等都可能导致CPU占用率过高。
此时,用户可以通过更新操作系统、驱动程序来解决问题。
5. 系统资源不足系统资源不足也是导致CPU占用率高的原因之一。
例如,内存不足、硬盘空间不足等都会导致CPU占用率高。
此时,用户可以通过清理垃圾文件、升级硬件等方式来解决问题。
CPU占用率高可能是因为病毒或恶意软件、系统进程或服务、应用程序、系统缺陷、系统资源不足等原因导致的。
为了避免CPU占用率高的问题,用户可以定期杀毒、清理垃圾文件、更新系统、驱动程序等。
同时,用户也可以通过关闭其他应用程序、升级硬件等方式来降低CPU的负载,提高系统的性能。
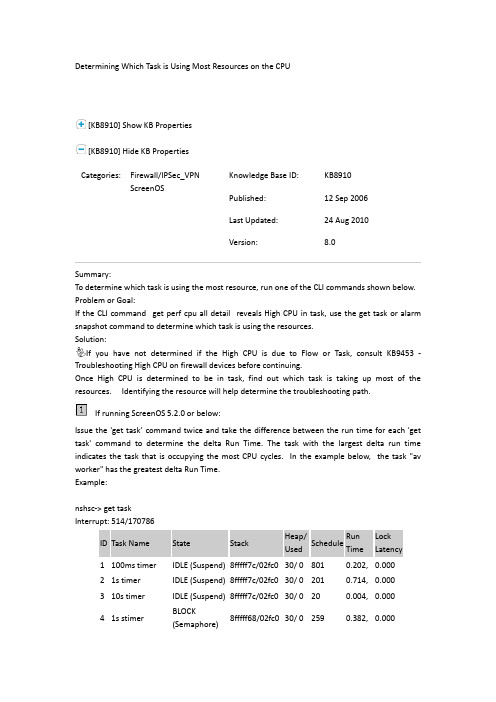
Determining Which Task is Using Most Resources on the CPU[KB8910] Show KB Properties[KB8910] Hide KB PropertiesCategories: Firewall/IPSec_VPNScreenOS Knowledge Base ID: KB8910 Published: 12 Sep 2006 Last Updated: 24 Aug 2010 Version: 8.0Summary:To determine which task is using the most resource, run one of the CLI commands shown below. Problem or Goal:If the CLI command get perf cpu all detail reveals High CPU in task, use the get task or alarm snapshot command to determine which task is using the resources.Solution:If you have not determined if the High CPU is due to Flow or Task, consult KB9453 - Troubleshooting High CPU on firewall devices before continuing.Once High CPU is determined to be in task, find out which task is taking up most of the resources. Identifying the resource will help determine the troubleshooting path.If running ScreenOS 5.2.0 or below:Issue the 'get task’ command twice and take the difference between the run time for each 'get task' command to determine the delta Run Time. The task with the largest delta run time indicates the task that is occupying the most CPU cycles. In the example below, the task "av worker" has the greatest delta Run Time.Example:nshsc-> get taskInterrupt: 514/1707861 100ms timer IDLE (Suspend) 8fffff7c/02fc0 30/ 0 801 0.202, 0.0002 1s timer IDLE (Suspend) 8fffff7c/02fc0 30/ 0 201 0.714, 0.0003 10s timer IDLE (Suspend) 8fffff7c/02fc0 30/ 0 20 0.004, 0.0004 1s stimer BLOCK(Semaphore)8fffff68/02fc0 30/ 0 259 0.382, 0.000(some tasks removed from sample output to shorten display)65 hdio IDLE (Suspend) 8fffff7c/02fc0 30/ 0 147 0.017, 0.00066 telnet NORM (YIELD) 8ffffdf0/04fc0 30/ 1 1074 0.477, 0.00067 http-fx BLOCK (Mail) 8fffff58/07fc0 30/ 0 1 0.001, 0.00068 web IDLE (Socket) 8ffffdc4/18fc0 30/ 0 99 0.050, 0.00069 vfs IDLE (Suspend) 8fffff80/04fc0 30/ 0 14 0.002, 0.00070 MDH IDLE (Suspend) 8fffff7c/06fc0 30/ 0 2 0.001, 0.00071 icap_server_poll IDLE (Suspend) 8fffff7c/04fc0 30/ 0 28 0.004, 0.00072 mgcp BLOCK(Semaphore)8fffff68/02fc0 30/ 0 132 0.018, 0.00073 sip-alg IDLE (Suspend) 8fffff78/06fc0 30/ 0 68 0.009, 0.00074 av worker HIGH (YIELD) 8fffdbac/10fc0 1066/64877916 33.526, 0.00075 aaa task IDLE (Socket) 8ffffdf0/04fc0 30/ 0 1 0.001, 0.00076 eap task IDLE (Suspend) 8fffff7c/04fc0 30/ 0 1 0.001, 0.000 Issue the get task command again1 100ms timer IDLE (Suspend) 8fffff7c/02fc0 30/ 0 864 0.218, 0.0002 1s timer IDLE (Suspend) 8fffff7c/02fc0 30/ 0 201 0.746, 0.0003 10s timer IDLE (Suspend) 8fffff7c/02fc0 30/ 0 20 0.004, 0.0004 1s stimer BLOCK(Semaphore)8fffff68/02fc0 30/ 0 272 0.403, 0.000(some tasks removed from sample output to shorten display)65 hdio IDLE (Suspend) 8fffff7c/02fc0 30/ 0 156 0.018, 0.00066 telnet NORM (YIELD) 8ffffdf0/04fc0 30/ 1 1197 0.530, 0.00067 http-fx BLOCK (Mail) 8fffff58/07fc0 30/ 0 1 0.001, 0.00068 web IDLE (Socket) 8ffffdc4/18fc0 30/ 0 99 0.050, 0.00069 vfs IDLE (Suspend) 8fffff80/04fc0 30/ 0 14 0.002, 0.00070 MDH IDLE (Suspend) 8fffff7c/06fc0 30/ 0 2 0.001, 0.00071 icap_server_poll IDLE (Suspend) 8fffff7c/04fc0 30/ 0 29 0.004, 0.00072 mgcp BLOCK(Semaphore)8fffff68/02fc0 30/ 0 139 0.019, 0.00073 sip-alg IDLE (Suspend) 8fffff78/06fc0 30/ 0 71 0.009, 0.00074 av worker HIGH (YIELD) 8fffdbac/10fc0 1066/49394727 37.667, 0.00075 aaa task IDLE (Socket) 8ffffdf0/04fc0 30/ 0 1 0.001, 0.00076 eap task IDLE (Suspend) 8fffff7c/04fc0 30/ 0 1 0.001, 0.000If running ScreenOS 5.3.0 or higher:Use the CPU alarm snapshot feature. To use this, issue the following commands:set alarm snapshot CPU onset alarm snapshot CPU trigger (repeat this 2-3 times in 10 second intervals)unset alarm snapshot CPU onget alarm snapshot CPU allThe output will indicate the amount of resources each task is using during the specified time interval.================= alarm snapshot ====================alarm_time: 9/13/2006 05:17:46cpu_utilization: 38============================================================== snapshot of task run time =======================time slot===================================================================== snapshot of count ==========================================================================You can see that AV Worker takes up the most resources in this output as well.Based on the resource identified, troubleshoot the related logs, counters, andresources. From the example above, the administrator would troubleshoot AV related logs, counters, and resources.If the resource is "NTP" consult: KB8843 - High (NTP) task CPU after upgrading to ScreenOS 5.4. If the resource is "session scan", investigate ARP, route, and policy additions/changes.If the resource is "session scan" and the ScreenOS version is 6.x, then run the following commands, which contains a new debug that gives an insight into why the 'session scan' task is busy. Also, consult KB11690 - How to debug "session scan" task causing High CPU.a. Set the 'task' debug:nsisg2000-> set task "session scan" debugb. Get the output of the "session scan" task. The Subtask with the highest RunTime and RunCnt fields should be the culprit.nsisg2000-> get task "session scan"id 16, name session scan, seq 16, state IDLEpriority IDLE, previous priority NORMstack size 12224, run time 0.579trace: 00093b4c 003fb440 00081bb4max scheduled interval: 290 msDebugged task id list: 16Task session scan debug time: 0 Hour 0 Minute 7 SecondsSubtask Name RunTime RunCnt Schedule LockLatencyScan session 0.550 2 6 0.000Route event 0.002 1 2 0.000ARP event 0.026 1 0 0.000NDP 0.000 0 0 0.000PMTU 0.000 0 0 0.000-------------------------------------------------------------------------------All subtasks used CPU time 0.578 lock latency 0.000Capture the output of the command get task <ID> ; where ID is the suspect tasknumber. In Step 1 example, the task ID for av worker is 74. Run this command multiple times to see if the trace is the same or changing differently each time. This trace data is useful for Technical Support.For additional Technical Support Assistance, consult: KB6987 - What data should I collect to troubleshoot High CPU issues on a Firewall device?Purpose:TroubleshootingRelated Links:Link Title:KB9453 - Troubleshooting High CPU on a firewall deviceLink URL:Link Title:KB12143 - How to trigger the CPU snapshot tool when a high CPU spike occurs by using thealarm thresholdLink URL: LOGGED IN:YuFei yangMy Account | Logout。

Juniper防火墙常见故障应急预案Juniper防火墙常见故障快速处理指南应急启动条件:故障一:CPU负载突发升高故障二:并发会话突发升高故障三:防火墙主备关系紊乱应急操作步骤:故障一:CPU负载突发升高如果CPU持续升高,并且影响了业务的正常通信,而在规定时间内无法找到原因(例如找不到突发数据源、因为软硬件故障造成的CPU升高),可在收集完信息后,通过三层交换机替代防火墙,进行防火墙旁路的应急操作。
(注意:在外联区与Internet 区等需要NAT的地方不能使用此替代方案)收集的信息至少包括如下内容:request support informationset cli timestampshow chassis routing-engineshow system processes extensiveshow security monitoring performance sessionshow security monitoring session fpc <number> pic <number>show security monitoring performance spu故障二:并发会话突发升高一般在会话总数升高时,可通过命令clear security flow session及时关闭无用的会话,此命令可以基于源/目标地址、源/目标端口、IP协议来关闭会话。
另外,可以通过命令delete security flow tcp-session no-syn-check 打开对建立会话的包头syn标志位检测,以避免有攻击流量(例如rst flood)在防火墙上建立无用会话。
同时,可通过以下命令,临时降低每个ip允许的会话,以保证大部分的业务通讯:set security screen ids-option <screen> limit-session source-ip-based <number> set security screen ids-option <screen> limit-session destination-ip-based <number>set security zones security-zone <zone> screen <screen>如果会话持续升高,并且影响了业务的正常通信,而在规定时间内无法找到原因(例如找不到突发数据源、因为软硬件故障造成的会话升高),可在收集完信息后,通过三层交换机替代防火墙,进行防火墙旁路的应急操作。

精品文档Juniper 防火墙维护手册(版本号: V1.0)运营部网络管理室目录一、 Juniper 防火墙介绍 (5)1.1、NS5000 系列 (5)1.1.1、 NS5400 (5)1.1.2、 NS5200 (5)1.2、ISG 系列 (6)1.2.1、 ISG2000 (6)1.2.2、 ISG1000 (6)1.3、SSG500 系列 (7)1.3.1 SSG550M (7)1.3.2 SSG520 (7)1.4、SSG300 系列 (8)1.4.1 SSG350M (8)1.4.2 SSG320M (8)1.5、SSG140 系列 (8)1.5.1 SSG140 (9)1.6、SSG5/20 系列 (9)1.6.1 SSG5 (9)1.6.2 SSG20 (9)二、防火墙常用配置 (10)2.1 Juniper防火墙初始化配置和操纵 (10)2.2 查看系统概要信息 (14)2.3 主菜单常用配置选项导航 (16)2.4 Configration 配置菜单 (17)2.5 Update更新系统镜像和配置文件 (18)2.5.1 更新 ScreenOS系统镜像 (18)2.5.2 更新 config file 配置文件 (19)2.6 Admin 管理 (20)2.7.1 Zone安全区227.2 Interfaces接口配置 (24)7.2.1 查看接口状态的概要信息247.2.2 设置 interface 接口的基本信息247.2.3 设置地址转换262.7.4 设置接口 Secondary IP地址342.7.5 Routing 路由设置342.8 Policy 策略设置 (37)2.8.1 查看目前策略设置372.9 创建策略 (38)2.10 对象 Object 设置 (40)2.11 策略 Policy 报告 Report (41)四、防火墙日常应用 (42)4.1、Netscreen 冗余协议( NSRP) (42)4.1.1、 NSRP 部署建议:434.1.2NSRP常用维护命令444.2、策略配置与优化( Policy ) (45)4.3、攻击防御( Screen) (46)4.4、特殊应用处理 (48)4.4.1、长连接应用处理484.4.2、不规范 TCP 应用处理494.4.3、 VOIP 应用处理49五、防火墙日常维护 (51)5.1、常规维护 (52)5.2、常规维护建议: (54)5.3 应急处理 (56)5.3.1 检查设备运行状态565.4、总结改进 (58)六、 Juniper 防火墙设备恢复处理方法 (70)6.1 设备重启动 (70)6.2 操作系统备份 (70)6.3 操作系统恢复 (70)6.4 配置文件备份 (71)6.5 配置文件恢复 (71)6.6 恢复出厂值 (72)6.7 硬件故障处理 (72)6.8 设备返修( RMA ) (72)一、 Juniper 防火墙介绍1.1 、NS5000 系列1.1.1、NS5400性能和处理能力30 Gbps 防火墙 (>12G 64byte小包) 18MPPS 2百万同时会话数15 Gbps 3DES VPN25,000 IPSec VPN 通道1.1.2、NS5200性能和处理能力10 Gbps 防火墙 (>4G 64byte小包)1百万同时会话数5 Gbps 3DES VPN25,000 IPSec VPN 通道1.2 、ISG 系列1.2.1、ISG2000性能和处理能力4 Gbps 状态监测防火墙任何大小的数据包2 Gbps 3DES和 AES IPSec VPN 任何大小数据包防火墙数据包转发性能:3 MPPS最大在线会话数: 100 万,每秒 23,000 个新会话1.2.2、ISG1000性能和处理能力2 Gbps 状态监测防火墙任何大小的数据包1 Gbps 3DES和 AES IPSec VPN 任何大小数据包防火墙数据包转发性能: 1.5 MPPS最大在线会话数: 50 万,每秒 20,000 个新会话1.3 、SSG500系列1.3.1 SSG 550M4Gbps 的 FW IMIX / 600K pps1Gbps 的 FW IMIX / 500 Mbps IPSec VPN6 个 I/O插槽–4个可插LAN口模块双电源, DC为选项, NEBS为选项12.8 万个会话, 1,000 条 VPN 隧道1.3.2 SSG 5202Gbps 的 FW / 300K pps600 Mbps 的 FW IMIX / 300 Mbps IPSEC VPN 6 个 I/O插槽–2个可插LAN口模块单一 AC或 DC电源6.4 万个会话, 500 条 VPN 隧道1.4 、SSG300系列1.4.1 SSG 350M1.2 Gbps 的 FW / 225K pps500 Mbps 的 FW IMIX / 225 Mbps IPSec VPN 5 个 I/O插槽9.6 万个会话,每秒 2.6 万会话1.4.2 SSG 320M1.2 Gbps 的 FW / 175K pps400 Mbps 的 FW IMIX / 175 Mbps IPSec VPN 3 个 I/O插槽6.4 万个会话,每秒 2 万会话1.5 、SSG140系列1.5.1 SSG 140950Mbps 的 FW/ 100K pps300 Mbps 的 Firewall IMIX / 100 Mbps IPSec VPN4 个 I/O插槽4.8 万个会话,每秒8k 会话1.6 、SSG5/20系列1.6.1 SSG 5SSG5 是一个固定规格的平台,提供160 Mbps 的状态防火墙流量和40 Mbps 的 IPSec VPN 吞吐量。
造成cpu占用率过高的原因很多人都问,为什么我的CPU占有率那么高的,都没有进行什么操作。
所以为了方便你们学习以下就由店铺给你介绍“造成cpu占用率过高的原因”相关的内容,谢谢观看!造成cpu占用率过高的原因的详细介绍CPU占用率高的九种可能:1、防杀毒软件造成故障由于新版的KV、金山、瑞星都加入了对网页、插件、邮件的随机监控,无疑增大了系统负担。
处理方式:基本上没有合理的处理方式,尽量使用最少的监控服务吧,或者,升级你的硬件配备。
2、驱动没有经过认证,造成CPU资源占用100%大量的测试版的驱动在网上泛滥,造成了难以发现的故障原因。
处理方式:尤其是显卡驱动特别要注意,建议使用微软认证的或由官方发布的驱动,并且严格核对型号、版本。
3、病毒、木马造成大量的蠕虫病毒在系统内部迅速复制,造成CPU占用资源率据高不下。
解决办法:用可靠的杀毒软件彻底清理系统内存和本地硬盘,并且打开系统设置软件,察看有无异常启动的程序。
经常性更新升级杀毒软件和防火墙,加强防毒意识,掌握正确的防杀毒知识。
4、系统服务控制面板—管理工具—服务—RISING REALTIME MONITOR SERVICE点鼠标右键,改为手动。
5、启动项开始->;运行->;msconfig->;启动,关闭不必要的启动项,重启。
6、查看“Svchost”进程Svchost.exe是Windows XP系统的一个核心进程。
svchost.exe 不单单只出现在Windows XP中,在使用NT内核的Windows系统中都会有svchost.exe的存在。
一般在Windows 2000中svchost.exe进程的数目为2个,而在Windows XP中svchost.exe进程的数目就上升到了4个及4个以上。
7、查看网络连接主要是网卡。
8、查看网络连接当安装了Windows XP的计算机做服务器的时候,收到端口 445 上的连接请求时,它将分配内存和少量地调配CPU资源来为这些连接提供服务。
cpu占用率过高原因CPU(中央处理器)是计算机的核心组件之一,负责执行计算机程序中的指令。
在使用计算机时,我们常常会遇到CPU占用率过高的情况,这不仅会影响计算机的性能和响应速度,还会导致系统崩溃或死机。
那么,CPU占用率过高的原因是什么呢?一个常见的原因是程序错误或异常。
当我们运行一个有bug的程序时,它可能会进入一个无限循环或者执行一些非常耗时的操作,导致CPU占用率飙升。
这种情况下,我们需要检查程序的代码,找出错误并进行修复。
病毒或恶意软件也是导致CPU占用率过高的常见原因之一。
恶意软件常常会在后台运行,并执行一些恶意操作,如数据窃取、网络攻击等。
这些恶意操作可能会消耗大量的CPU资源,导致CPU占用率飙升。
为了解决这个问题,我们需要安装并定期更新杀毒软件,及时发现并清除恶意软件。
过多的后台进程也可能导致CPU占用率过高。
在我们使用计算机的过程中,很多程序都会在后台运行,如系统更新、自动备份、即时通讯软件等。
当这些后台进程过多或者某个后台进程异常时,就会导致CPU占用率飙升。
为了解决这个问题,我们可以通过任务管理器或系统监视器来查看哪些进程占用了大量的CPU资源,并根据需要进行关闭或优化。
过多的同时运行程序也可能导致CPU占用率过高。
当我们同时运行多个程序时,CPU需要分配资源给每个程序,如果程序过多,CPU 资源就会分散,导致占用率上升。
为了解决这个问题,我们可以选择关闭一些不必要的程序,或者使用多线程技术来提高程序的并发性能。
硬件故障也可能导致CPU占用率过高。
例如,风扇故障会导致CPU过热,进而导致CPU降频或关闭保护机制,从而导致占用率飙升。
解决这个问题的方法是检查硬件设备是否正常工作,并及时更换故障部件。
系统资源不足也可能导致CPU占用率过高。
当我们使用计算机时,除了CPU外,还有内存、硬盘等资源。
当这些资源不足时,CPU 可能会被迫承担更多的工作,从而导致占用率上升。
为了解决这个问题,我们可以升级硬件设备,增加内存容量、使用更高性能的硬盘等。
防火墙cpu高的处理方法哪些流量使用cpu处理:1,tcp建立连接的三次握手:syn,syn+ack,ack2,tcp拆除连接的四次握手:fin+ack,ack,fin+ack,ack3,udp单向一次性数据包,例如dns查询的前两个包4,ip分片包5,icmp的前两个包当这些流量在短时间内大量发送到防火墙时,会造成cpu使用率升高。
通过以下方法可以找到发包源ip,采取处理措施。
建议在cpu高时采用的排查方法:一、抓包分析先进入到虚拟域root中config vdomedit root1,抓syn包,一般攻击主机都会发送大量的syn包dia sniffer packet any 'tcp[13] & 2 != 0' 4 1006.134908 port3 in 192.168.1.11.3989 -> 192.168.1.1.80: syn 18406305836.134939 port3 out 192.168.1.1.80 -> 192.168.1.11.3989: syn 2521620957 ack 18406305847.955959 port3 in 192.168.1.11.3990 -> 192.168.1.1.80: syn 26632686867.955987 port3 out 192.168.1.1.80 -> 192.168.1.11.3990: syn 721268136 ack 2663268687其中192.168.1.11向192.168.1.1的80端口发送了syn2,抓ip分片包,攻击主机可能会发送大量的分片包dia sniffer packet any '((ip[6:2] > 0) and (not ip[6] = 64))' 419.879229 port3 in 192.168.1.11 -> 10.1.1.1: icmp: echo request (frag 44051:1480@0+)19.879234 port3 in 192.168.1.11 -> 10.1.1.1: ip-proto-1 (frag 44051:228@1480)19.879265 port3 out 10.1.1.1 -> 192.168.1.11: icmp: echo reply (frag 64220:1480@0+)19.879267 port3 out 10.1.1.1 -> 192.168.1.11: ip-proto-1 (frag 64220:228@1480)分片包都带有frag标记3,抓udp包(非dns)dia sniffer packet any 'udp and port !53' 48.764876 wan1 in 10.20.1.2.4708 -> 58.251.148.134.8000: udp 718.764915 wan2 out 192.168.118.23.45792 -> 58.251.148.134.8000: udp 718.843119 wan2 in 58.251.148.134.8000 -> 192.168.118.23.45792: udp 1028.843164 wan1 out 58.251.148.134.8000 -> 10.20.1.2.4708: udp 102其中10.20.1.2向58.251.148.134的8000端口发送了udp包二、查看web页面中会话排行榜的前3名ip三、查看dia sys top 输出该命令是查看哪些进程占用cpu较高Run Time: 0 days, 4 hours and 4 minutes0U, 0S, 100I; 7967T, 7176F, 248KFproxyworker 92 S 0.0 1.0proxyworker 93 S 0.0 1.0ipsengine 84 S < 0.0 0.5ipsengine 83 S < 0.0 0.4ipsengine 88 S < 0.0 0.4ipsengine 89 S < 0.0 0.4ipsengine 90 S < 0.0 0.4ipsengine 100 S < 0.0 0.4pyfcgid 217 S 0.0 0.4pyfcgid 210 S 0.0 0.3httpsd 137 S 0.0 0.3httpsd 130 S 0.0 0.3pyfcgid 212 S 0.0 0.3pyfcgid 213 S 0.0 0.3cmdbsvr 53 S 0.0 0.3httpsd 228 S 0.0 0.2newcli 232 R 0.0 0.2newcli 225 S 0.0 0.2httpsd 73 S 0.0 0.2httpsd 129 S 0.0 0.2以第一行为例解释,proxyworker 92 S 0.0 1.0进程名进程id 进程状态(s表示休眠,r表示工作)cpu使用百分比内存使用百分比排错时的常用方法:1,通过ssh连接到防火墙,建议开至少3个ssh连接窗口,每个窗口输入不同的排查命令2,将抓包和其他排错命令的结果记录到文件中,方面分析3,Ping测试需要采取内网ping防火墙,外网ping防火墙和内网通过防火墙ping公网ip的方式判断问题出现在哪个方面4,测试业务访问是否正常,记录业务访问正常时的延时和状态,已对比cpu高时业务访问的情况。
系统进程可能导致CPU利用率变高一、Dllhost进程可能导致CPU利用率变高特征:服务器正常CPU消耗应该在75%以下,而且CPU消耗应该是上下起伏的,出现这种问题的服务器,CPU会突然一直处100%的水平,而且不会下降。
查看任务管理器,可以发现是DLLHOST.EXE消耗了所有的CPU空闲时间,管理员在这种情况下,只好重新启动IIS服务,奇怪的是,重新启动IIS服务后一切正常,但可能过了一段时间后,问题又再次出现了。
直接原因:有一个或多个ACCESS数据库在多次读写过程中损坏,微软的MDAC系统在写入这个损坏的ACCESS文件时,ASP线程处于BLOCK 状态,结果其它线程只能等待,IIS被死锁了,全部的CPU时间都消耗在DLLHOST中。
解决办法:安装“一流信息监控拦截系统”,使用其中的“首席文件检查官IIS健康检查官”软件,启用”查找死锁模块”,设置:–wblock=yes监控的目录,请指定您的主机的文件所在目录:–wblockdir=d:test,监控生成的日志的文件保存位置在安装目录的log 目录中,文件名为:logblock.htm停止IIS,再启动“首席文件检查官IIS健康检查官”,再启动IIS,“首席文件检查官IIS健康检查官”会在logblock.htm中记录下最后写入的ACCESS文件的。
过了一段时间后,当问题出来时,例如CPU会再次一直处100%的水平,可以停止IIS,检查logblock.htm所记录的最后的十个文件,注意,最有问题的往往是计数器类的ACCESS文件,例如:”COUNT.MDB”,”COUNT.ASP”,可以先把最后十个文件或有所怀疑的文件删除到回收站中,再启动IIS,看看问题是否再次出现。
我们相信,经过仔细的查找后,您肯定可以找到这个让您操心了一段时间的文件的。
找到这个文件后,可以删除它,或下载下来,用ACCESS2000修复它,问题就解决了。
二、CPU中央处理器64位技术1、AMD64位技术AMD64的位技术是在原始32位X86指令集的基础上加入了X86-64扩展64位X86指令集,使这款芯片在硬件上兼容原来的32位X86软件,并同时支持X86-64的扩展64位计算,使得这款芯片成为真正的64位X86芯片。
Determining Which Task is Using Most Resources on the CPU[KB8910] Show KB Properties[KB8910] Hide KB PropertiesCategories: Firewall/IPSec_VPNScreenOS Knowledge Base ID: KB8910 Published: 12 Sep 2006 Last Updated: 24 Aug 2010 Version: 8.0Summary:To determine which task is using the most resource, run one of the CLI commands shown below. Problem or Goal:If the CLI command get perf cpu all detail reveals High CPU in task, use the get task or alarm snapshot command to determine which task is using the resources.Solution:If you have not determined if the High CPU is due to Flow or Task, consult KB9453 - Troubleshooting High CPU on firewall devices before continuing.Once High CPU is determined to be in task, find out which task is taking up most of the resources. Identifying the resource will help determine the troubleshooting path.If running ScreenOS 5.2.0 or below:Issue the 'get task’ command twice and take the difference between the run time for each 'get task' command to determine the delta Run Time. The task with the largest delta run time indicates the task that is occupying the most CPU cycles. In the example below, the task "av worker" has the greatest delta Run Time.Example:nshsc-> get taskInterrupt: 514/1707861 100ms timer IDLE (Suspend) 8fffff7c/02fc0 30/ 0 801 0.202, 0.0002 1s timer IDLE (Suspend) 8fffff7c/02fc0 30/ 0 201 0.714, 0.0003 10s timer IDLE (Suspend) 8fffff7c/02fc0 30/ 0 20 0.004, 0.0004 1s stimer BLOCK(Semaphore)8fffff68/02fc0 30/ 0 259 0.382, 0.000(some tasks removed from sample output to shorten display)65 hdio IDLE (Suspend) 8fffff7c/02fc0 30/ 0 147 0.017, 0.00066 telnet NORM (YIELD) 8ffffdf0/04fc0 30/ 1 1074 0.477, 0.00067 http-fx BLOCK (Mail) 8fffff58/07fc0 30/ 0 1 0.001, 0.00068 web IDLE (Socket) 8ffffdc4/18fc0 30/ 0 99 0.050, 0.00069 vfs IDLE (Suspend) 8fffff80/04fc0 30/ 0 14 0.002, 0.00070 MDH IDLE (Suspend) 8fffff7c/06fc0 30/ 0 2 0.001, 0.00071 icap_server_poll IDLE (Suspend) 8fffff7c/04fc0 30/ 0 28 0.004, 0.00072 mgcp BLOCK(Semaphore)8fffff68/02fc0 30/ 0 132 0.018, 0.00073 sip-alg IDLE (Suspend) 8fffff78/06fc0 30/ 0 68 0.009, 0.00074 av worker HIGH (YIELD) 8fffdbac/10fc0 1066/64877916 33.526, 0.00075 aaa task IDLE (Socket) 8ffffdf0/04fc0 30/ 0 1 0.001, 0.00076 eap task IDLE (Suspend) 8fffff7c/04fc0 30/ 0 1 0.001, 0.000 Issue the get task command again1 100ms timer IDLE (Suspend) 8fffff7c/02fc0 30/ 0 864 0.218, 0.0002 1s timer IDLE (Suspend) 8fffff7c/02fc0 30/ 0 201 0.746, 0.0003 10s timer IDLE (Suspend) 8fffff7c/02fc0 30/ 0 20 0.004, 0.0004 1s stimer BLOCK(Semaphore)8fffff68/02fc0 30/ 0 272 0.403, 0.000(some tasks removed from sample output to shorten display)65 hdio IDLE (Suspend) 8fffff7c/02fc0 30/ 0 156 0.018, 0.00066 telnet NORM (YIELD) 8ffffdf0/04fc0 30/ 1 1197 0.530, 0.00067 http-fx BLOCK (Mail) 8fffff58/07fc0 30/ 0 1 0.001, 0.00068 web IDLE (Socket) 8ffffdc4/18fc0 30/ 0 99 0.050, 0.00069 vfs IDLE (Suspend) 8fffff80/04fc0 30/ 0 14 0.002, 0.00070 MDH IDLE (Suspend) 8fffff7c/06fc0 30/ 0 2 0.001, 0.00071 icap_server_poll IDLE (Suspend) 8fffff7c/04fc0 30/ 0 29 0.004, 0.00072 mgcp BLOCK(Semaphore)8fffff68/02fc0 30/ 0 139 0.019, 0.00073 sip-alg IDLE (Suspend) 8fffff78/06fc0 30/ 0 71 0.009, 0.00074 av worker HIGH (YIELD) 8fffdbac/10fc0 1066/49394727 37.667, 0.00075 aaa task IDLE (Socket) 8ffffdf0/04fc0 30/ 0 1 0.001, 0.00076 eap task IDLE (Suspend) 8fffff7c/04fc0 30/ 0 1 0.001, 0.000If running ScreenOS 5.3.0 or higher:Use the CPU alarm snapshot feature. To use this, issue the following commands:set alarm snapshot CPU onset alarm snapshot CPU trigger (repeat this 2-3 times in 10 second intervals)unset alarm snapshot CPU onget alarm snapshot CPU allThe output will indicate the amount of resources each task is using during the specified time interval.================= alarm snapshot ====================alarm_time: 9/13/2006 05:17:46cpu_utilization: 38============================================================== snapshot of task run time =======================time slot===================================================================== snapshot of count ==========================================================================You can see that AV Worker takes up the most resources in this output as well.Based on the resource identified, troubleshoot the related logs, counters, andresources. From the example above, the administrator would troubleshoot AV related logs, counters, and resources.If the resource is "NTP" consult: KB8843 - High (NTP) task CPU after upgrading to ScreenOS 5.4. If the resource is "session scan", investigate ARP, route, and policy additions/changes.If the resource is "session scan" and the ScreenOS version is 6.x, then run the following commands, which contains a new debug that gives an insight into why the 'session scan' task is busy. Also, consult KB11690 - How to debug "session scan" task causing High CPU.a. Set the 'task' debug:nsisg2000-> set task "session scan" debugb. Get the output of the "session scan" task. The Subtask with the highest RunTime and RunCnt fields should be the culprit.nsisg2000-> get task "session scan"id 16, name session scan, seq 16, state IDLEpriority IDLE, previous priority NORMstack size 12224, run time 0.579trace: 00093b4c 003fb440 00081bb4max scheduled interval: 290 msDebugged task id list: 16Task session scan debug time: 0 Hour 0 Minute 7 SecondsSubtask Name RunTime RunCnt Schedule LockLatencyScan session 0.550 2 6 0.000Route event 0.002 1 2 0.000ARP event 0.026 1 0 0.000NDP 0.000 0 0 0.000PMTU 0.000 0 0 0.000-------------------------------------------------------------------------------All subtasks used CPU time 0.578 lock latency 0.000Capture the output of the command get task <ID> ; where ID is the suspect tasknumber. In Step 1 example, the task ID for av worker is 74. Run this command multiple times to see if the trace is the same or changing differently each time. This trace data is useful for Technical Support.For additional Technical Support Assistance, consult: KB6987 - What data should I collect to troubleshoot High CPU issues on a Firewall device?Purpose:TroubleshootingRelated Links:Link Title:KB9453 - Troubleshooting High CPU on a firewall deviceLink URL:Link Title:KB12143 - How to trigger the CPU snapshot tool when a high CPU spike occurs by using thealarm thresholdLink URL: LOGGED IN:YuFei yangMy Account | Logout。