原创国际学术会议海报(poster)模板(英文)
- 格式:ppt
- 大小:596.00 KB
- 文档页数:1


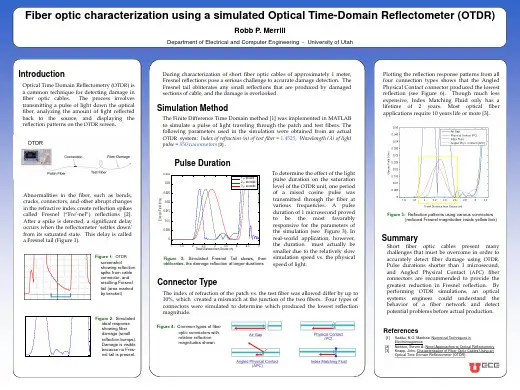
原创国际学术会议海报(poster)模板(英文)原创国际学术会议海报(poster)模板(英文)Fiber optic characterization using a simulated Optical TimeDomain Reflectometer (OTDR)Robb P. MerrillDepartment of Electrical and Computer Engineering - University of Utah IntroductionOptical Time Domain Reflectometry (OTDR) is a common technique for detecting damage in fiber optic cables. The process involves transmitting a pulse of light down the optical fiber, analyzing the amount of light reflected back to the source, and displaying the reflection patterns on the OTDR screen.During characterization of short fiber optic cables of approximately 1 meter, Fresnel reflections pose a serious challenge to accurate damage detection. The Fresnel tail obliterates any small reflections that are produced by damaged sections of cable, and the damage is overlooked.Simulation MethodThe Finite Difference Time Domain method [1] was implemented in MATLAB to simulate a pulse of light traveling through the patch and test fibers. The following parameters used in the simulation were obtained from an actual OTDR system: Index of refraction (n) of test fiber = 1.4525, Wavelength (λ) of light pulse = 850 nanometers [3] .Plotting the reflection response patterns from all four connection types shows that the Angled Physical Contact connector produced the lowest reflection (see Figure 6). Though much less expensive, Index Matching Fluid only has a lifetime of 2 years. Most optical fiber applications require 10 years life or more [3].Pulse DurationT o determine the effect of the light pulse duration on the saturation level of the OTDR unit, one period ofa raised cosine pulse was transmitted through the fiber at various frequencies. A pulse duration of 1 microsecond proved to be the most favorably responsive for the parameters of the simulation (see Figure 3). In realworld application, however, the duration must actually be smaller due to the relatively slow simulation speed vs. the physical speed of light.OTDR Saturation at Increased Pulse Durations 0.035 1 second 0.03 2 seconds 3 secondsAbnormalities in the fiber, such as bends, cracks, connectors, and other abrupt changes in the refractive index create reflection spikes called Fresnel ( Fre'-nel ) reflections [2]. After a spike is detected, a significant delay occurs when the reflectometer ‘settles down’ from its saturated state. This delay is called a Fresnel tail (Figure 1).Figure 1: OTDR screenshot showing reflection spike from cable connector, and resulting Fresnel tail (area marked by bracket)0.025Electric Field (V/m)0.020.01510.01Figure 5: Reflection patterns using various connectors (reduced Fresnel magnitudes inside yellow box)0.0050 1 1.5 2 2.5 3 3.5 4 Travel Distance from Source (m) 4.5 5SummaryShort fiber optic cables present many challenges that must be overcome in order to accurately detect fiber damage using OTDR. Pulse durations shorter than 1 microsecond, and Angled Physical Contact (APC) fiber connectors are recommended to provide the greatestreduction in Fresnel reflection. By performing OTDRsimulations, an optical systems engineer could understand the behavior of a fiber network and detect potential problems before actual production.Figure 3: Simulated Fresnel Tail skews, then obliterates, the damage reflection at larger durationsConnector TypeThe index of refraction of the patch vs. the test fiber was allowed differ by up to 10%, which created a mismatch at the junction of the two fibers. Four types of connectors were simulated to determine which produced the lowest reflection magnitude.15x 10-3Ideal Reflection Characteristics (No OTDR Saturation)105Figure 2: Simulated ideal response showing fiber damage (small reflection bumps). Damage is visible because no Fres-nel tail is present.Electric Field (V/m)Figure 4: Common types of fiber optic connectors with relative reflection magnitudes shownReferences[1] Sadiku, N.O. Matthew. Numerical Techniques in Electromagnetics [2] Newton, Steven A. Novel Approaches to Optical Reflectometry [3] Knapp, John. Characterization of FiberOptic Cables Using an Optical Time Domain Reflectometer (OTDR)0 2 2.5 3 Travel Distance from Source (m) 3.5Fiber optic characterization using a simulated Optical TimeDomain Reflectometer (OTDR)Robb P. MerrillDepartment ofElectrical and Computer Engineering - University of UtahIntroductionOptical Time Domain Reflectometry (OTDR) is a common technique for detecting damage in fiber optic cables. The process involves transmitting a pulse of light down the optical fiber, analyzing the amount of light reflected back to the source, and displaying the reflection patterns on the OTDR screen.During characterization of short fiber optic cables of approximately 1 meter, Fresnel reflections pose a serious challenge to accurate damage detection. The Fresnel tail obliterates any small reflections that are produced by damaged sections of cable, and the damage is overlooked.Simulation MethodThe Finite Difference Time Domain method [1] was implemented in MATLAB to simulate a pulse of light traveling through the patch and test fibers. The following parameters used in the simulation were obtained from an actual OTDR system: Index of refraction (n) of test fiber = 1.4525, Wavelength (λ) of light pulse = 850 nanometers [3] .Plotting the reflection response patterns from all four connection types shows that the Angled Physical Contact connector produced the lowest reflection (see Figure 6). Though much less expensive, Index Matching Fluid only has a lifetime of 2 years. Most optical fiber applications require 10 years life or more [3].Pulse DurationTo determine the effect of the light pulse duration on the saturation level of the OTDR unit, one period of a raised cosine pulse was transmitted through the fiber at various frequencies. A pulse duration of 1 microsecond proved to be the most favorably responsive for the parameters of the simulation (see Figure 3). In realworld application, however, the duration must actually be smaller due to the relatively slow simulation speed vs. the physical speed of light.OTDR Saturation at Increased Pulse Durations 0.035 1 second 0.03 2 seconds 3secondsAbnormalities in the fiber, such as bends, cracks, connectors, and other abrupt changes in the refractive index create reflection spikes called Fresnel ( Fre'-nel ) reflections [2]. After a spike is detected, a significant delay occurs when the reflectometer ‘settles down’ from its saturated state. This delay is called a Fresnel tail (Figure 1).Figure 1: OTDR screenshot showing reflection spike from cable connector, and resulting Fresnel tail (area marked by bracket)0.025Electric Field (V/m)0.020.01510.01Figure 5: Reflection patterns using various connectors (reduced Fresnel magnitudes inside yellow box)0.0050 1 1.5 2 2.5 3 3.5 4 Travel Distance from Source (m) 4.5 5SummaryShort fiber optic cables present many challenges that must be overcome in order to accurately detect fiber damage using OTDR. Pulse durations shorter than 1 microsecond, and Angled Physical Contact (APC) fiber connectors are recommended to provide the greatest。


英文学术poster模板Title: Academic Poster Template for English Presentations.Introduction.Creating an academic poster for an English presentation can be a daunting task, especially for those who are not familiar with the format and requirements. However, with the right template and guidance, the process can become much smoother. In this article, we will provide you with a comprehensive template for an English academic poster, along with tips and best practices for creating aneffective and impactful presentation.Template Overview.1. Poster Size and Layout.Standard poster sizes include A0, A1, A2, and A3.Choose the size based on the space available and the amount of information you need to present.Use a clean and professional layout that is easy to read and navigate. Avoid overcrowding the poster with too much text or images.2. Title and Authors.Place the title at the top of the poster in bold and prominent font size. Make sure it is concise and catches the attention of the viewer.Include the names and affiliations of the authors below the title. If there are multiple authors, list them in alphabetical order.3. Abstract.Provide a brief overview of your research in the abstract section. This should include the purpose, methods, main findings, and conclusions of your study.Keep the abstract concise and to the point, as it serves as a teaser for your research.4. Main Sections.Divide your poster into several main sections based on the content of your research. Common sections include Introduction, Methods, Results, Discussion, and Conclusion.Each section should have a clear heading and be organized in a logical flow.5. Visual Elements.Use images, charts, and graphs to complement the text and enhance the visual appeal of your poster.Make sure the visual elements are clear, easy to understand, and support the information presented in the text.6. References.Include a list of references at the end of your poster to acknowledge the sources of information and research.Follow the appropriate citation style (e.g., APA, MLA, Chicago) based on the requirements of your academic institution or conference.Best Practices for Creating an Effective Poster.1. Keep it Simple and Clear.Avoid using too many colors, fonts, and graphics that may distract the viewer. Stick to a consistent color scheme and font style throughout the poster.Use bullet points and tables to condense information and make it easier to read.2. Highlight Key Points.Use bold, italic, or underlined text to emphasize key points or important information.Consider using different colors or shapes to highlight important data or findings.3. Engage the Viewer.Use eye-catching images and graphics to draw the viewer's attention.Include interactive elements like QR codes or weblinks to provide additional information or resources.4. Practice and Revise.Create a draft of your poster and practice presenting it to a friend or colleague. Get feedback on the layout, content, and clarity of your poster.Revise your poster based on the feedback received and make improvements accordingly.Conclusion.Creating an effective English academic poster requires careful planning and attention to detail. By following the template and best practices outlined in this article, you can create a professional and impactful presentation that will engage your audience and communicate your research effectively. Remember to practice and revise your poster to ensure it is ready for your next academic presentation.。