Ch1 (1.3 信号的运算)
- 格式:pdf
- 大小:790.61 KB
- 文档页数:3

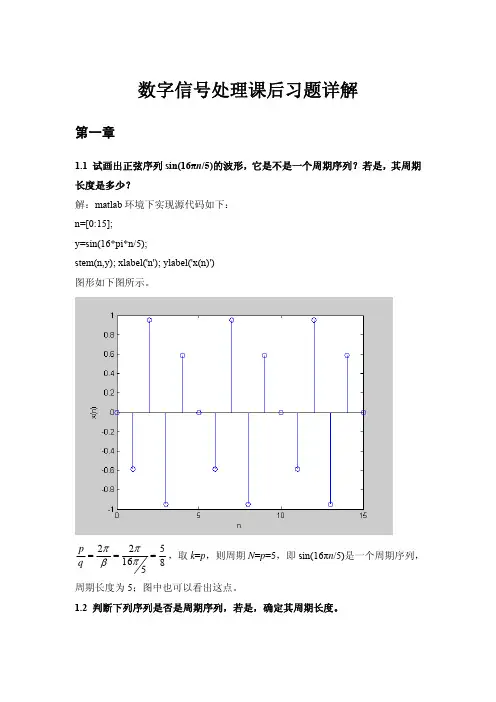
数字信号处理课后习题详解第一章1.1 试画出正弦序列sin(16πn /5)的波形,它是不是一个周期序列?若是,其周期长度是多少?解:matlab 环境下实现源代码如下: n=[0:15]; y=sin(16*pi*n/5);stem(n,y); xlabel('n'); ylabel('x(n)') 图形如下图所示。
2251685p q πππβ===,取k =p ,则周期N =p =5,即sin(16πn /5)是一个周期序列,周期长度为5;图中也可以看出这点。
1.2 判断下列序列是否是周期序列,若是,确定其周期长度。
(1) 3()cos(74x n n ππ=−解:2214337p q πππβ===∵ p ,q 是互为质数的整数,取k =q 则周期N =p =14∴周期长度为14 (2) 7cos()4sin()(nnn x ππ−=解:1284N ππ== 22147N ππ==∵N 1,N 2最小公倍数为56 ∴其周期长度为561.3 试画出如下序列的波形(1) x(n)=3δ(n+3)+2δ(n+1)-4δ(n-1)+2δ(n-2) (2)x(n)= 0.5n R 5(n)解:(1)(2)1.4 今对三个正弦信号)2cos()(1t t x a π=、)6cos()(2t t x a π−=、)10cos()(3t t x a π=进行理想采样,采样频率为π8=Ωs ,求这三个采样输出序列,比较其结果。
画出x a 1(t )、x a 2(t )、x a 3(t )的波形及采样点位置并解释频谱混叠现象。
解:matlab 环境下实现源代码如下:t=-1:0.01:1; x1=cos(2*pi*t); x2=-cos(6*pi*t); x3=cos(10*pi*t); t2=-1:0.25:1; y1=cos(2*pi* t2);y2=-cos(6*pi* t2);y3=cos(10*pi* t2);subplot(311)plot(t,x1);xlabel('t');ylabel('Xa1(t)') holdstem(t2, y1)subplot(312)plot(t,x2);xlabel('t');ylabel('Xa2(t)') holdstem(t2, y2)subplot(313)holdstem(t2, y3)plot(t,x3);xlabel('t');ylabel('Xa3(t)') 三个信号波形已知πω8=,则4182,42===πππωs T 。