聚类分析外文文献及翻译
- 格式:doc
- 大小:738.50 KB
- 文档页数:15

聚类分析外文文献及翻译本科毕业论文外文文献及译文文献、资料题目:Cluster Analysis—Basic Concepts and Algorithms 文献、资料来源:文献、资料发表(出版)日期:院(部):土木工程学院专业:土木工程班级:姓名:学号:指导教师:翻译日期:外文文献:Cluster Analysis—Basic Concepts and AlgorithmsCluster analysis divides data into groups (clusters) that are meaningful, useful,or both. If meaningful groups are the goal, then the clusters should capture the natural structure of the data. In some cases, however, cluster analysis is only a useful starting point for other purposes, such as data summarization. Whether for understanding or utility, cluster analysis has long played an important role in a wide variety of fields: psychology and other social sciences, biology,sta tistics, pattern recognition, information retrieval, machine learning, and data mining.There have been many applications of cluster analysis to practical problems. We provide some specific examples, organized by whether the purpose of the clustering is understanding or utility.Clustering for Understanding Classes, or conceptually meaningful groups of objects that share common characteristics, play an important role in how people analyze and describe the world. Indeed, human beings are skilled at dividing objects into groups (clustering) and assigning particular objects to these groups (classification). For example, even relatively young children can quickly label the objects in a photograph as buildings, vehicles, people, animals, plants, etc. In the context of understanding data, clusters are potential classes and cluster analysis is the study of techniques for automatically finding classes. The following are some examples:Biology. Biologists have spent many years creating a taxonomy (hierarchical classifica tion) of all living things: kingdom, phylum, class,order, family, genus, and species. Thus, it is perhaps not surprising that much of the early work in cluster analys is sought to create a discipline of mathematical taxonomy that could automatically find such classification structures. More recently, biologists have applied clustering to analyze the large amounts of genetic information that are now available. For example, clustering has been used to find groups of genes that havesimilar functions.• Informati on Retrieval. The World Wide Web consists of billions of Web pages, and the results of a query to a search engine can return thousands of pages. Clustering can be used to group these search results into a small number of clusters, each of which captures a particular aspect of the query. For instance, a query of “movie” might return Web pages grouped into categories such as reviews, trailers, stars, and theaters. Each category (cluster) can be broken into subcategories (sub-clusters), producing a hierarchica l structure that further assists a user’s exploration of the query results.• Climate.Understanding the Earth’s climate requires finding patternsin the atmosphere and ocean. To that end, cluster analysis has been applied to find patterns in the atmospheric pressure of polar regions and areas of the ocean that have a significant impact on land climate.• Psychology and Medicine. An illness or condition frequently has a number of variations, and cluster analysis can be used to identify these different subcategories. For example, clustering has been used to identify different types of depression. Cluster analysis can also be used to detect patterns in the spatial or temporal distribution of a disease.• Business.Businesses collect large amounts of information on current and potential customers. Clustering can be used to segment customers into a small number of groups for additional analysis and marketing activities.Clustering for Utility:Cluster analysis provides an abstraction from individual data objects to the clusters in which those data objects reside. Additionally, some clustering techniques characterize each cluster in terms of a cluster prototype; i.e., a data object that is representative of the other objects in the cluster. These cluster prototypes can be used as the basis for a number of data analysis or data processing techniques. Therefore, in the context of utility, cluster analysis is the study of techniques for finding the most representative cluster prototypes.• Summarization. Many data analysis techniques, such as regression or PCA, have a time or space complexity of O(m2) or higher (where m is the number ofobjects), and thus, are not practical for large data sets. However, instead of applying the algorithm to the entire data set, it can be applied to a reduced data set consisting only of cluster prototypes. Depending on the type of analysis, the number of prototypes, and the accuracy with which the prototypes represent the data, the results can be comparable to those that would have been obtained if all the data could have been used.• Compression. Cluster prototypes can also be used for data compres-sion. In particular, a table is created that consists of the prototypes for each cluster; i.e., each prototype is assigned an integer value that is its position (index) in the table. Each object is represented by the index of the prototype associated with its cluster. This type of compression is known as vector quantization and is often applied to image, sound, and video data, where (1) many of the data objects are highly similar to one another, (2) some loss of information is acceptable, and (3) a substantial reduction in the data size is desired• E ffciently Finding Nearest Neighbors. Finding nearest neighbors can require computing the pairwise distance between all points. Often clusters and their cluster prototypes can be found much more effciently. If objects are relatively close to the prototype of their cluster, then we can use the prototypes to reduce the number of distance computations that are n ecessary to find the nearest neighbors of an object. Intuitively, if two cluster prototypes are far apart, then the objects in the corresponding clusters cannot be nearest neighbors of each other. Consequently, to find an object’s nearest neighbors it is onl y necessary to compute the distance to objects in nearby clusters, where the nearness of two clusters is measured by the distance between their prototypes.This chapter provides an introduction to cluster analysis. We begin with a high-level overview of clustering, including a discussion of the various ap- proaches to dividing objects into sets of clusters and the different types of clusters. We then describe three specific clustering techniques that represent broad categories of algorithms and illustrate a variety of concepts: K-means, agglomerative hierarchical clustering, and DBSCAN. The final section of this chapter is devoted tocluster validity—methods for evaluating the goodness of the clusters produced by a clustering algorithm. More advanced clusteringconcepts and algorithms will be discussed in Chapter 9. Whenever possible,we discuss the strengths and weaknesses of different schemes. In addition,the bibliographic notes provide references to relevant books and papers that explore cluster analysis in greater depth.1.1OverviewBefore discussing specific clustering techniques, we provide some necessary background. First, we further define cluster ana lysis, illustrating why it isdiffcult and explaining its relationship to other techniques that group data.Then we explore two important topics: (1) different ways to group a set ofobjects into a set of clusters, and (2) types of clusters.1.1.1What Is Cluster Analysis?Cluster analysis groups data objects based only on information found in thedata that describes the objects and their relationships. The goal is that theobjects within a group be similar (or related) to one another and different from(or unrelated to) the objects in other groups. The greater the similarity (orhomogeneity) within a group and the greater the difference between groups,the better or more distinct the clustering.Cluster analysis is related to other techniques that are used to divide data objects into groups. For instance, clustering can be regarded as a form of classification in that it cr eates a labeling of objects with class (cluster) labels.However, it derives these labels only from the data. In contrast, classificationn the sense of Chapter 4 is supervised classification; i.e., new, unlabeled objects are assigned a class label using a model developed from objects with known class labels.For this reason, cluster analysis is sometimes referred to as unsupervised classification. When the term classification is used without any qualification within data mining, it typically refers to supervised classification.Also, while the terms segmentation and partitioning are sometimesused as synonyms for clustering, these terms are frequently used for approaches outside thetraditional bounds of cluster analysis. For example, the termpartitioning is often used in connection with techniques that divide graphs into subgraphs and that are not strongly connected to clustering. Segmentation often refers to the division of data into groups using simple techniques; e.g.,an image can be split into segments based only on pixel intensity and color, orpeople can be divided into groups based on their income. Nonetheless, somework in graph partitioning and in image and market segmentation is relatedto cluster analysis.1.1.2 Different Types of ClusteringsAn entire collection of clusters is commonly referred to as a clustering, and in this section, we distinguish various types of clusterings: hierarchical (nested) versus partitional (unnested), exclusive versus overlapping versus fuzzy, and complete versus partial.Hierarchical versus Partitional The most commonly discussed distinc- tion among different types of clusterings is whether the set of clusters is nested or unnested, or in more traditional terminology, hierarchical or partitional. Apartitional clustering is simply a division of the set of data objects into non-overlapping subsets (clusters) such that each data object is in exactly onesubset.If we permit clusters to have subclusters, then we obtain a hierarchical clustering, which is a set of nested clusters that are organized as a tree. Each node (cluster) in the tree (except for the leaf nodes) is the union of its children (subclusters), and the root of the tree is the cluster containing all the objects.Often, but not always, the leaves of the tree are singleton clusters of individual data objects. If we allow clusters to be nested, then one interpretation of Figure 8.1(a) is that it has two subclusters (Figure 8.1(b)), each of which, inturn, has three subclusters (Figure 8.1(d)). The clusters shown in Figures 8.1(a–d), when taken in that order, also form a hierarchical (nested) clusteringwith, respectively, 1, 2, 4, and 6 clusters on each level. Finally, note that a hierarchical clustering can be viewed as a sequence of partitional clusterings and a partitional clustering can be obtained by taking any member of that sequence; i.e., by cutting the hierarchical tree at aparticular level.Exclusive versus Overlapping versus Fuzzy The clusterings shown in Figure 8.1 are all exclusive, as they assign each object to a single cluster.There are many situations in which a point could reasonably be placed in more than one cluster, and these situations are better addressed by non-exclusiveclustering. In the most general sense, an overlapping or non-exclusiveclustering is use d to reflect the fact that an object can simultaneously belong to more than one group (class). For instance, a person at a university can be both an enrolled student and an employee of the university. A non-exclusiveclustering is also often used when, for example, an object is “between” two or more clusters and could reasonably be assigned to any of these clusters.Imagine a point halfway between two of the clusters of Figure 8.1. Rather than make a somewhat arbitrary assignment of the object to a single cluster,it is placed in all of the “equally good” clusters.In a fuzzy clustering, every object belongs to every cluster with a membership weight that is between 0 (absolutely doesn’t belong) and 1 (absolutelybelongs). In other words, clusters are treated as fuzzy sets. (Mathematically,a fuzzy set is one in which an object belongs to any set with a weight thatis between 0 and 1. In fuzzy clustering, we often impose the additional constraint that the sum of the weights for each object must equal 1.) Similarly,probabilistic clustering techniques compute the probability with which each point belongs to each cluster, and these probabilities must also sum to 1. Because the membership weights or probabilities for any object sum to 1, a fuzzyor probabilistic clustering does not address true multiclass situations, such as the case of a student employee, where an object belongs to multiple classes .Instead, these approaches are most appropriate for avoiding the arbitrariness of assigning an object to only one cluster when it may be close to several. Inpractice, a fuzzy or probabilistic clustering is often converted to an exclusiveclustering by assigning each object to the cluster in which its membership weight or probability is highest.Complete versus Partial A complete clustering assigns every object to a cluster, whereas a partial clustering does not. The motivation for a partial clustering is thatsome objects in a data set may not belong to well-defined groups. Many times objects in the data set may represent noise, out liers, or“uninteresting background.” For example, some newspaper stories may share a common theme, such as global warming, while other stories are more genericor one-of-a-kind. Thus, to find the important topics in last month’s stories, we may want to searc h only for clusters of documents that are tightly related by a common theme. In other cases, a complete clustering of the objects is desired.For example, an application that uses clustering to organize documents forbrowsing needs to guarantee that all documents can be browsed.1.1.3Different Types of ClustersClustering aims to find useful groups of objects (clusters), where usefulness is defined by the goals of the data analysis. Not sur prisingly, there are several different notions of a cluster that prove useful in practice. In order to visually illustrate the differences among these types of clusters, we use two-dimensional points, as shown in Figure 8.2, as our data objects. We stress, however, thatthe types of clusters described here are equally valid for other kinds of data.Well-Separated A cluster is a set of objects in which each object is closer (or more similar) to every other object in the cluster than to any object notin the cluster. Sometimes a threshold is used to specify that all the objects in a cluster must be sufficiently close (or similar) to one another. This ideal istic definition of a cluster is satisfied only when the data contains natural clusters that are quite far from each other. Figure 8.2(a) gives an example of well-separated clusters that consists of two groups of points in a two-dimensional space. The distance between any two points in different groups is larger than he distance between any two points within a group. Well-separated clusters do not need to be globular, but can have any shape.Prototype-Based A cluster is a set of objects in which each object is closer(more similar) to the prototype that defines the cluster than to the prototype of any other cluster. For data with continuous attributes, the prototype of a cluster is often a centroid, i.e., the average (mean) of all the points in the cluster. When a centroid isnot meaningful, such as when the data has categorical attributes, the prototype is often a medoid, i.e., the most representative pointof a cluster. For many types of data, the prototype can be regarded as the most central point, and in such instances, we commonly refer to prototype-based clusters as center-based clusters. Not surprisingly, such clusters tend to be globular. Figure 8.2(b) shows an example of center-based clusters.Graph-Based If the data is represented as a graph, where the nodes are objects and the links represent connections among objects (see Section ),then a cluster can be defined as a connected component; i.e., a group of objects that are connected to one another, but that have no connection to objects outside the group. An important example of graph-based clusters are contiguity-based clusters, where two objects are connected only if they are within a specified distance of each other. This implies that each object in a contiguity-based cluster is closer to some other object in the cluster than to any point in a different cluster. Figure 8.2(c) shows an example of such clusters for two-dimensional points. This definition of a cluster is useful when clusters are irregular or intertwined, but can have trouble when noise is present since, as illustrated by the two spherical clusters of Figure 8.2(c), a small bridge of points can merge two distinct clusters.Other types of graph-based clusters are also possible. One such approach (Section ) defines a cluster as a clique; i.e., a set of nodes in a graph that are completely connected to each other. Specifically, if we add connections between objects in the order of their distance from one another, a cluster is formed when a set of objects forms a clique. Like prototype-based clusters, such clusters tend to be globular.Density-Based A cluster is a dense region of objects that is surrounded bya region of low density. Figure 8.2(d) shows some density-based clusters for data created by adding noise to the data of Figure 8.2(c). The two circular clusters are not merged, as in Figure 8.2(c), because the bridge between them fades into the noise. Likewise, the curve that is present in Figure 8.2(c) also fades into the noise and does not form a cluster in Figure 8.2(d). A density-based definition of a cluster isoften employed when the clusters are irregular or intertwined, and when noise and outliers are present. By contrast, a contiguity- based definition of a cluster wou ld not work well for the data of Figure 8.2(d)since the noise would tend to form bridges between clusters.Shared-Property (Conceptual Clusters) More generally, we can define a cluster as a set of objects that share some property. This definition encom passes all the previous definitions of a cluster; e.g., objects in a center-based cluster share the property that they are all closest to the same centroid or medoid. However, the shared-property approach also includes new types of clusters. Consider the clusters shown in Figure 8.2(e). A triangular area (cluster) is adjacent to a rectangular one, and there are two intertwined circles (clusters). In both cases, a clustering algorithm would need a very specific concept of a cluster to successfully detect these clust ers. The process of find- ing such clusters is called conceptual clustering. However, too sophisticated a notion of a cluster would take us into the area of pattern recognition, and thus, we only consider simpler types of clusters in this book.Road MapIn this chapter, we use the following three simple, but important techniques to introduce many of the concepts involved in cluster analysis.• K-means. This is a prototype-based, partitional clustering technique that attempts to find a user-specified number o f clusters (K ), which are represented by their centroids.• Agglomerative Hierarchical Clustering. This clustering approach refers to a collection of closely related clustering techniques that produce a hierarchical clustering by starting with each point as a singleton cluster and then repeatedly merging the two closest clusters until a single, all- encompassing cluster remains. Some of these techniques have a natural interpretation in terms of graph-based clustering, while others have an interpretation in terms of a prototype-based approach.• DBSCAN. This is a density-based clustering algorithm that producesa partitional clustering, in which the number of clusters is automatically determinedby the algorithm. Points in low-density regions are classified as noise and omitted;thus, DBSCAN does not produce a complete lustering.中文译文:聚类分析—基本概念及算法聚类分析将数据分为有意义的,有用的,或两者兼而有之的组(集群)。
聚类分析在外国语言学研究中的应用孙仕光;张萍【摘要】A survey indicates that most foreign language researchers across China lack an understanding of cluster analysis and cannot apply it in linguistic studies .Based on the analysis of corpus data , the authors of this paper hold that cluster analysis can be used in the following areas : lexical semantics , syntactic pattern studies , dialectology , stylistic , social and functional variation of language . Besides being a statisticaltechnique ,cluster analysis also has methodological implications : it can help researchers systematically discover variables relevant for subject matter ; and it is a tool of generating high quality hypotheses in a data - driven way . It is also pointed out that cluster analysis can serve as an important quantitative research tool for systemic functional linguistics .%调查显示,我国大部分外国语言学研究者对聚类分析既缺乏了解也不会应用。
kmeans文献Kmeans,又称为k均值聚类,是一种常用的聚类算法。
其主要思想是通过不断迭代,将数据分成k个簇,使得同一簇的数据更相似,而不同簇的数据更不相似。
Kmeans算法的两个特点是:1)它非常适合解决大规模数据集上的聚类问题;2)它采用了贪心策略,即在每一步都选择当前最优的解。
因此,在实际应用中,Kmeans是一个常用的聚类算法。
Kmeans算法的核心步骤包括初始化、聚类和更新。
在初始化阶段,我们首先随机选择k个中心点;在聚类阶段,我们将每个数据点与最近的中心点匹配,并将它们放在同一簇中;在更新阶段,我们需要重新计算每个簇的中心点并将其作为下一轮迭代的中心点。
在实现Kmeans算法时,有一些关键的参数需要调整。
其中最重要的参数是k值,即簇的数量。
通常情况下,我们需要使用一些方法来确定合适的k值,例如手肘法和轮廓系数。
此外,还需要使用一些距离度量方法来计算簇之间的相似度,例如欧几里得距离、曼哈顿距离和余弦相似度。
在实际应用中,Kmeans算法被广泛应用于在生物信息学和市场营销等领域中进行聚类分析,以及将图像、文本和语音等数据类型聚类。
在这些应用中,Kmeans算法可以帮助提高数据分析的效率,从而更好地理解数据。
虽然Kmeans算法在实际应用中已经被证明是一种非常有效的聚类算法,但其仍然存在一些挑战和限制。
其中一些主要的问题包括选择合适的k值、提高簇之间的相似性、处理噪声数据和处理高维数据。
为了解决这些问题,研究人员已经提出了很多改进的Kmeans算法,例如Kmeans++、Bisecting Kmeans、Spectral Clustering和Fuzzy C-means等算法。
这些算法不仅可以提高Kmeans算法的延伸性和性能,而且可以在更广泛的应用和数据领域中获得更好的表现。
总的来说,Kmeans算法是一种非常有用的聚类算法,在数据科学和机器学习领域中已经广泛应用。
在实现Kmeans算法时,需要注意选择合适的参数和距离度量方法,并针对实际应用中的挑战和限制进行改进。
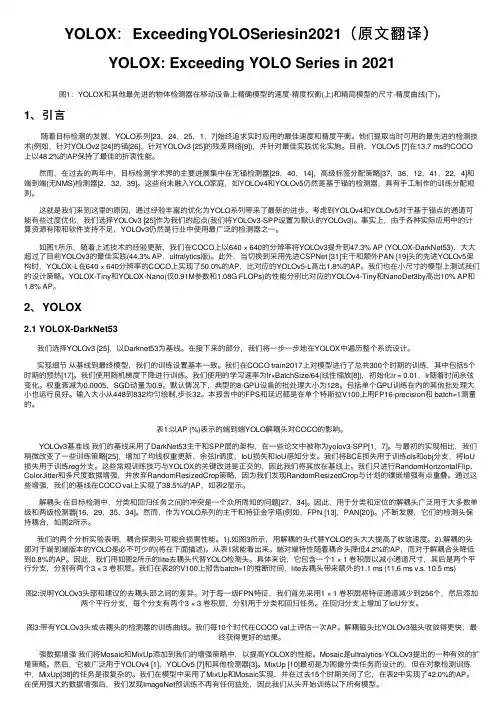
YOLOX:ExceedingYOLOSeriesin2021(原⽂翻译)YOLOX: Exceeding YOLO Series in 2021图1:YOLOX和其他最先进的物体检测器在移动设备上精确模型的速度-精度权衡(上)和精简模型的尺⼨-精度曲线(下)。
1、引⾔随着⽬标检测的发展,YOLO系列[23,24,25,1,7]始终追求实时应⽤的最佳速度和精度平衡。
他们提取当时可⽤的最先进的检测技术(例如,针对YOLOv2 [24]的锚[26]、针对YOLOv3 [25]的残差⽹络[9]),并针对最佳实践优化实施。
⽬前,YOLOv5 [7]在13.7 ms的COCO 上以48.2%的AP保持了最佳的折衷性能。
然⽽,在过去的两年中,⽬标检测学术界的主要进展集中在⽆锚检测器[29,40,14],⾼级标签分配策略[37,36,12,41,22,4]和端到端(⽆NMS)检测器[2,32,39]。
这些尚未融⼊YOLO家庭,如YOLOv4和YOLOv5仍然是基于锚的检测器,具有⼿⼯制作的训练分配规则。
这就是我们来到这⾥的原因,通过经验丰富的优化为YOLO系列带来了最新的进步。
考虑到YOLOv4和YOLOv5对于基于锚点的通道可能有些过度优化,我们选择YOLOv3 [25]作为我们的起点(我们将YOLOv3-SPP设置为默认的YOLOv3)。
事实上,由于各种实际应⽤中的计算资源有限和软件⽀持不⾜,YOLOv3仍然是⾏业中使⽤最⼴泛的检测器之⼀。
如图1所⽰,随着上述技术的经验更新,我们在COCO上以640 × 640的分辨率将YOLOv3提升到47.3% AP (YOLOX-DarkNet53),⼤⼤超过了⽬前YOLOv3的最佳实践(44.3% AP,ultralytics版)。
此外,当切换到采⽤先进CSPNet [31]主⼲和额外PAN [19]头的先进YOLOv5架构时,YOLOX-L在640 × 640分辨率的COCO上实现了50.0%的AP,⽐对应的YOLOv5-L⾼出1.8%的AP。
聚类分析论文简介聚类分析是一种常用的数据分析技术,它将数据集中的对象划分为具有相似特征的群组。
这些群组通常称为“簇”,聚类分析可以帮助我们发现数据中的共性和相似性,从而提取有意义的信息和洞见。
本文将介绍聚类分析的基本概念、算法原理以及在实际应用中的一些案例。
聚类分析的基本原理聚类分析的目标是将数据集中的对象划分为若干个“紧密”群组,使得同一群组内的对象之间具有较高的相似性,而不同群组之间的对象相似度较低。
常用的聚类分析算法有层次聚类、K均值聚类和DBSCAN等。
层次聚类层次聚类是一种自底向上的聚类方法,它从每个对象作为一个单独的群组开始,然后将对象逐步合并,直到所有对象都属于同一个群组。
层次聚类可分为凝聚(自底向上)和分裂(自顶向下)两种类型。
凝聚层次聚类从单个对象开始,然后将最相似的对象合并为一个群组,直到所有对象都合并在一起。
分裂层次聚类则从所有对象开始,然后逐步分裂为多个子群组,直到每个对象都成为一个单独的群组。
K均值聚类K均值聚类是一种迭代的聚类算法,它将数据集划分为K个不重叠的群组,其中K是用户指定的参数。
算法的基本思想是通过迭代计算,将每个对象分配给其最接近的质心,然后根据分配结果更新质心的位置,直到达到一定的收敛条件。
DBSCANDBSCAN是一种基于密度的聚类算法,它将数据集划分为具有相似密度的群组。
算法的基本思想是通过定义领域半径和邻近点数量的方式,将对象分为核心对象、边界对象和噪声对象。
DBSCAN算法具有自动确定群组数量的优点,并且对数据中的噪声相对稳健。
聚类分析的应用案例客户分群聚类分析在市场营销领域广泛应用,特别是在客户分析和客户细分方面。
通过对市场数据进行聚类分析,可以将客户划分为不同的群组,从而更好地理解和满足客户的需求。
例如,一家电商公司可以根据购买行为、兴趣爱好和消费水平等指标将用户分为高价值客户、潜在客户和低价值客户,以针对性地提供个性化的服务和推荐。
社交网络分析聚类分析可以应用于社交网络中的节点(如用户或组织)分析,帮助揭示社交网络中的社群结构和节点之间的相互关系。
K-means后数据聚类的50年发展Anil K.Jain 密歇根州立大学计算机科学与工程系高丽大学大脑与认知工程系翻译人徐天宇专业班级自动化1104 .摘要:数据进行合理的聚群是理解和学习最基本的模式之一。
例如,一个常见的科学分类将生物归类为如下的类别体系:域、界、门、纲、目等。
聚类分析是根据对象的可测得的或可感知的本质特征或相似度来对其进行聚群或聚类的方法和算法的正式研究。
聚类分析并不使用种类标签,即通过如类标这样已有的标示符来标识对象。
类别信息的缺失将数据聚类(无监督学习)和分类或判别分析(有监督学习)。
聚类的目标是寻找数据的结构,因此是对自然的一种探索。
聚类在不同的科学领域里面都有着悠久而丰富的历史。
1955年第一次发表的K-means算法是最受欢迎的简单聚类算法之一。
事实上,尽管K-means算法已经提出了50多年,而且从那时起发表了数以千计的其它聚类算法,K-means仍然有着广泛的运用。
这说明设计一个有广泛适用性的聚类算法的困难以及聚类本身是一个病态问题。
我们对聚类进行了简要的综述,总结了有名的聚类方法,讨论了设计聚类算法主要挑战和核心问题,指出了部分新兴和有用的研究方向包括半监督聚类、集成聚类、在数据聚类时同时进行特征选择以及大规模数据聚类。
关键词:数据聚类、用户困境、历史发展、聚类的前景、傅京孙奖1. 引言传感和存储技术的进步以及像互联网搜索、数字成像、视频监控等技术应用的迅猛发展产生了大量的高维数据集。
据估计2007年数据全球数据使用量为281艾字节,预计2011年这个数字将增长10倍(1艾大约是1018B或1,000,000TB)。
大部分的数据数字化的存储在电子介质中,因此给自动化数据分析、分类和检索技术的发展提供了巨大的可能。
可利用的数据除了量的增长,类型也增多了(文本、图像、视频)。
并不昂贵的数字摄影机产生了大量的图像和视频。
由于无线射频识别标签和收发机低价和小尺寸,它们得以普及并导致了成千上万的能有规律传输数据的传感器的部署。
聚类分析在外国语言学研究中的应用作者:穆晓岩来源:《课程教育研究·学法教法研究》2018年第04期【摘要】聚类分析,还可以被称为是数值分类学,这属于一种多元统计的分类技术。
该技术主要运用在商业和生物与工程以及人类学,还有社会学等多种领域中。
语言学中的研究存在很多分类问题,然而学者们选择定性法分类的非常多,计量手段的分类法非常罕见。
鉴于此,本文将对聚类分析在外国语言学研究中的应用进行分析。
【关键词】聚类分析外国语言研究应用【中图分类号】H087 【文献标识码】A 【文章编号】2095-3089(2018)04-0003-01现阶段在聚类分析中的新方法非常多,对聚类算法来说,其使用的技术并不一样,在理论背景上彼此交叉和重叠,并不能容易地归类一个比较统一的标准,聚类分析法能够被分为层次聚类方法和基于划分下的聚类方法与图论聚类方法以及密度下与网格基础下的方法等多种。
上述方法尽管从不同角度方面多运用的理论方法也不同,然而对存在差异的实际问题来说,聚类分析当中的基本内容一直是人们研究的重点。
一、聚类方法浅析(一)层次聚类方法分析就层次聚类算法来说,其主要优点是指,不需要实现知晓用户指定的聚类数目,能够灵活地对不同层次聚类粒度进行控制,同时,还可以比较清晰地对簇之间所具备的层次关系进行表达。
然而,层次聚类算法在运用中的缺点也是非常明显的,主要有,层次聚类时,不能追溯已有的簇结构处理;上一层次簇形成之后,一般是不能在之后的执行过程中进行调整的。
现阶段,很多层次聚类算法在计算过程中都有一定的复杂度,这一过程中,0是数据集中数据点的数量。
计算开销是非常大的,已经是促进层次聚类算法中性能提高的一个瓶颈,导致其不能适用于规模较大的数据集。
(二)划分聚类方法的分析这一聚类方法早已在模式识别和数据挖掘等不同领域有了广泛的应用,截至目前为止,还是多个研究工作中的思想源头。
如果目标函数具有可微性,就要对数据集进行初始划分,再将其作为起点,并对样本点的归属进行调整,进而让目标函数实现最优。

中英文对照外文翻译(文档含英文原文和中文翻译)译文:并非所有的社交媒体都是一样的:分析机构的社交媒体使用模式摘要:本研究探讨了组织如何使用消费者关系管理的各种社会媒体应用。
基于聚类分析,317组织的社会化媒体的使用模式进行了分析。
六组的组织是按照主要用于各组织的社交媒体应用程序鉴定网络版。
在第一个三组主要采用了单一的社会媒体应用(博客,社交网站,或者部件)与客户沟通,而第二三组采用多种社会化媒体应用中,常与可视化,虚拟化,或交互式协作的重点。
此外,该研究发现,企业倾向于使用具有双向通信能力社交媒体应用。
这些发现的理论和实际意义将在本文讨论。
1.引言随着业务的新媒体技术的日益显着性,企业现在正在使用新媒体工具战略性地以满足其不同客户的需求。
越来越多的新媒体技术提供能力,使企业能够为他们的客户提供了许多新的服务。
认识到使用新媒体技术的优势,大多数企业已经开始在诸如内部结构,管理系统,以及广告和公共关系(帕夫利克,2007)地区实施新的媒体技术。
特别是,组织已经以惊人的速度(巴恩斯,2008年)通过社交媒体,因为社交媒体使客户能够轻松地与组织沟通回来,来回跟上最新在它的新闻,使投诉和查询,访问聊天功能。
针对这一行业发展趋势的研究人员进行了有关社交媒体应用的研究。
首先,研究一个流(例如,格鲁尼格,2009年,卡普兰和Haenlein,2010; Lietsala和Sirkkunen,2008年,菲利普斯,2009年)已要求基于其独特的特点脱科幻NE 的应用是什么样的社会媒体和分类类型的社交媒体应用。
另一个研究流(例如,布里奥内斯等,2011; Rybalko和塞尔策,2010;沃特斯等人,2009年)取得了相当大的努力,以确定哪些类型的社交媒体应用组织正在使用以及如何特定网络C型社会媒体有助于创造和维护组织与顾客之间的关系。
但是,因为它不能提供企业的整体社交媒体使用率巳燕鸥的图片该项研究的限制范围内,特别是企业如何采用以组合的方式不同的社交媒体应用程序,以最大限度的协同效应。
spss聚类分析与商业计划书英文回答:Clustering analysis in SPSS can be a valuable tool for businesses when developing a business plan. By using clustering analysis, businesses can identify different customer segments based on their purchasing behavior, demographic characteristics, or other relevant variables. This can help businesses tailor their marketing strategies, product offerings, and pricing to better meet the needs and preferences of different customer segments.One way that clustering analysis can be used in a business plan is to identify target markets. By clustering customers based on their similarities, businesses can identify which segments are most profitable or have the highest growth potential. This information can then be used to focus marketing efforts and resources on these target segments, leading to more effective and efficient marketing strategies.Additionally, clustering analysis can also be used to identify product preferences and trends within different customer segments. By understanding the preferences and behaviors of different customer segments, businesses can develop and market products that are more likely to resonate with their target customers. This can lead to higher customer satisfaction and loyalty, as well as increased sales and profitability.In a business plan, the results of clustering analysis can be used to inform marketing strategies, product development, and overall business strategies. By incorporating the insights gained from clustering analysis into the business plan, businesses can create more targeted and effective strategies that are more likely to lead to success.中文回答:在商业计划书中,SPSS中的聚类分析可以成为一个有价值的工具。
Pubmedplus---PubMed分面检索与聚类分析系统北京唯博赛科技有限公司 郑友红什么是分面检索与聚类分析分面检索(Faceted Search):是指通过事物的属性不 断筛选、过滤搜索结果,让搜索结果更精确。
例如 文献包括年代、出版语言、学科分类等分面。
聚类分析(Cluster Analysis)是根据“物以类聚”的 道理,对大量的样品进行分类,没有任何模式可供 参考或依循,即是在没有先验知识的情况下进行的。
对文献进行聚类分析,可以拓展读者的思路,揭示 概念与概念之间的关系。
PubMed分面检索与聚类分析的意义PubMed是世界公认的权威数据库,也是 生物医学工作者使用最广泛的数据库。
对Pubmed进行分面检索可以使检索结果 更精确,更符合读者的要求;对Pubmed 进行聚类分析可以发现概念之间的关系, 帮助研究人员寻找新的研究方向和创新点。
Pubmedplus与Pubmed相同点PubMed支持限定检索,自由词自动转换主题词等功能;Pubmed认 可的检索式都可以在系统检索,检索结果也与Pubmed完全一致。
系统使用Pubmed官方授权的接口,两者检索方式与检索结果完全 一致;Pubmedplus与Pubmed相同点系统与Pubmed的不同点增加了Pubmed没有的分面:如循证医 学过滤,学科过滤等。
增加了Pubmed没有的聚类分析。
增加了资源揭示,投稿指南、引文及参 考文献。
读者使用Pubmedplus检索,比直接使用 Pubmed检索更快。
Pubmedplus对读者的用途一:本机构及关注机构发表在Pubmed上的文献“时 时在线分析”,可以按学科及年份对本机构和关 注机构发文量作对比。
本机构科室、重要作者均 翻译为中文,文献数量则动态显示。
医疗机构排名分析及时时在线跟踪对医院在PubMed发表论文情况进行统计分析, 能为机构领导者适时调整科研策略、发展政策 等提供参考和依据, 也有助于对各学科发表论 文的情况进行管理和评价。
Cluster andTreeView中文翻译版LindaHarbin medical university2010-10-3介绍:Cluster和TreeView是分析并可视化DNA芯片数据或是其它基因组数据集的软件程序,Cluster (很快就有一个新的名字)用多种不同的方式组织分析数据,TreeView则将这些组织好的数据可视化,这个软件的下一个版本会将这两个软件合成为一个应用程序。
这个说明书是使用这个软件的一个参考,而不是对软件中所用方法的全面分析。
很多方法都是从标准的统计聚类中得到的,对于聚类分析的那些非常好的教科书,我们会在最后的参考书目中给列出,参考书目中还包括最新的生物科学的论文,尤其是那些所用的方法与我们的非常相似的论文。
Cluster导入数据:用Cluster的第一步就是导入数据,当前版本的Cluster只接受以tab键为分隔符的数据格式,比如Excel,通过点File Format Help可以得到输入格式的说明。
依照惯例,在输入表格中,行代表基因,列代表样本或是不同的观察,下面的例子就是一个时间过程的输入文件:第一列中的每一行(基因)一般都代表标识符(绿色的字符),第一行中每一列代表样本的标签(蓝色的字符),此时的标签表示时间进程,红色字符代表的是每一行基因的种类是什么,本文件的YORF代表酵母开放阅读框,这个地方可以是任意的字母或数字的值,在TreeView中,应用它可以将每一行的基因连接到外部的网站中。
剩下的数据就是每个基因在不同样本中的表达值,2行4列的“5.8”表示基因YAL001C在2小时观察到的数据为5.8。
空数据是允许的,就用空值表示(里面什么都没有),如,YAL005C 在2小时的数据就是空的。
我们很可能要对输入数据额外的添加一些信息,最大的Cluster的输入文件如下所示:黄色的区域是可有可无的,默认情况下,TreeView用第一列的ID号作为每个基因的标签,NAME那一列是对每个基因的进一步描述性标签,从而与第一列的标签相区别,关于GWEIGHT和GORDER这两列和EWEIGHT和EORDER这两行的内容会晚一些再解释。
聚类分析文献英文翻译电气信息工程学院英文名称: Data mining-clustering 译文名称: 数据挖掘—聚类分析专业: 自动化姓名: **** 班级学号: **** 指导教师: ****** 译文出处: Data mining:Ian H.Witten, EibeFrank 著Clustering5.1 INTRODUCTIONClustering is similar to classification in that data are grouped. However, unlike classification, the groups are not predefined. Instead, the grouping is accomplished by finding similarities between data according to characteristics found in the actual data. The groups are called clusters. Some authors view clustering as a special type of classification. In this text, however, we follow a more conventional view in that the two are different. Many definitions for clusters have been proposed:, Set of like elements. Elements from different clusters are not alike., The distance between points in a cluster is less than the distance betweena point in the cluster and any point outside it.A term similar to clustering is database segmentation, where like tuple (record) in a database are grouped together. This is done topartition or segment the database into components that then give the user a more general view of the data. In this case text, we do not differentiate between segmentation and clustering. A simple example of clustering is found in Example 5.1. This example illustrates the fact that that determining how to do the clustering is not straightforward.As illustrated in Figure 5.1, a given set of data may be clusteredon different attributes. Here a group of homes in a geographic area is shown. The first floor type of clustering is based on the location of the home. Homes that are geographically close to each other are clustered together. In the second clustering, homes are grouped based on the size of the house.Clustering has been used in many application domains, including biology, medicine, anthropology, marketing, and economics. Clustering applications include plant and animal classification, disease classification, image processing, pattern recognition, and document retrieval. One of the first domains in which clustering was used was biological taxonomy. Recent uses include examining Web log data to detect usage patterns.When clustering is applied to a real-world database, manyinteresting problems occur:, Outlier handling is difficult. Here the elements do not naturally fallinto any cluster. They can be viewed as solitary clusters. However, if aclustering algorithm attempts to find larger clusters, theseoutliers will beforced to be placed in some cluster. This process may result in the creationof poor clusters by combining two existing clusters and leaving the outlier in its own cluster., Dynamic data in the database implies that cluster membership may change over time., Interpreting the semantic meaning of each cluster may be difficult. With classification, the labeling of the classes is known ahead of time. However, with clustering, this may not be the case. Thus, when the clustering process finishes creating a set of clusters, the exact meaning of each cluster may not be obvious. Here is where a domainexpert is needed to assign a label or interpretation for each cluster., There is no one correct answer to a clustering problem. In fact, many answers may be found. The exact number of clusters required is not easy to determine. Again, a domain expert may be required. For example, suppose we have a set of data about plants that have been collected during a field trip. Without any prior knowledge of plant classification, if we attempt to divide this set of data into similar groupings, itwould not be clear how many groups should be created., Another related issue is what data should be used of clustering. Unlike learning during a classification process, where there is some a priori knowledge concerning what the attributes of each classificationshould be, in clustering we have no supervised learning to aid the process. Indeed, clustering can be viewed as similar to unsupervised learning. We can then summarize some basic features of clustering (as opposed toclassification):, The (best) number of clusters is not known., There may not be any a priori knowledge concerning the clusters., Cluster results are dynamic.The clustering problem is stated as shown in Definition 5.1. Here we assume that the number of clusters to be created is an input value, k. Thek1,,jkactual content (and interpretation) of each cluster,,, is determined jas a result of the function definition. Without loss of generality, we will view that the result of solving a clustering problem is that a set of clusters iskkk,,...,created: K={}. 12kttt,,...,DEFINITION 5.1.Given a database D={} of tuples and an 12n integer value k, the clustering problem is to define a mapping f: Kt where each is assigned to one cluster ,. A Dk,{1,...,}1,,jkji Kcluster, contains precisely those tuples mapped to it; that is, j tftKin|(),1,,,,KtD,={and }. jiijiA classification of the different types of clustering algorithms is shown in Figure 5.2. Clustering algorithms themselves may be viewed ashierarchical or partitional. With hierarchical clustering, a nested set of clusters is created. Each level in the hierarchy has a separate setof clusters. At the lowest level, each item is in its own unique cluster. At the highest level, all items belong to the same cluster. With hierarchical clustering, the desired number of clusters is not input. With partitional clustering, the algorithm creates only one set of clusters. These approaches use the desired number of clusters to drive how the final set is created. Traditional clustering algorithms tend to be targeted to small numeric database that fit into memory .There are, however, more recent clustering algorithms that look at categorical data and are targeted to larger, perhaps dynamic, databases. Algorithms targeted to larger databases may adapt to memory constraints by either sampling the database or using data structures, which can be compressed or pruned to fit into memory regardless of the size of the database. Clustering algorithms may also differ based on whether they produce overlapping or nonoverlapping clusters. Even though we consider only nonoverlapping clusters, it is possible to place an item in multiple clusters. In turn, nonoverlapping clusters can be viewed as extrinsic or intrinsic. Extrinsic techniques use labeling of the items to assist in the classification process. These algorithms are the traditional classification supervised learning algorithms in which a special input training set is used. Intrinsic algorithms do not use any a priori category labels, but depend only on the adjacency matrix containing thedistance between objects. All algorithms we examine in this chapter fall into the intrinsic class.The types of clustering algorithms can be furthered classified based on the implementation technique used. Hierarchical algorithms can be categorized as agglomerative or divisive. ”Agglomerative” implies that theclusters are created in a bottom-up fashion, while divisive algorithms work in a top-down fashion. Although both hierarchical and partitional algorithms could be described using the agglomerative vs. divisive label, it typically is more associated with hierarchical algorithms. Another descriptive tag indicates whether each individual element is handled one by one, serial (sometimes called incremental), or whether all items are examined together, simultaneous. If a specific tuple is viewed as having attribute values for all attributes in the schema, then clustering algorithms could differ as to how the attribute values are examined. As is usually done with decision treeclassification techniques, some algorithms examine attribute values one at a time, monothetic. Polythetic algorithms consider all attribute values at one time. Finally, clustering algorithms can be labeled base on the mathematical formulation given to the algorithm: graph theoretic or matrix algebra. In this chapter we generally use the graph approach and describe the input to the clustering algorithm as an adjacency matrix labeled with distance measure.We discuss many clustering algorithms in the following sections. This is only a representative subset of the many algorithms that have been proposed in the literature. Before looking at these algorithms, we first examine possible similarity measures and examine the impact of outliers. 5.2 SIMILARITY AND DISTANCE MEASURESThere are many desirable properties for the clusters created by a solution to a specific clustering problem. The most important one is that a tuple within one cluster is more like tuples within that cluster than it is similar to tuples outside it. As with classification, then, we assume thett,definition of a similarity measure, sim(), defined between any two tuples, ilttD,,. This provides a more strict and alternative clustering definition, as ilfound in Definition 5.2. Unless otherwise stated, we use the first definition rather than the second. Keep in mind that the similarity relationship stated within the second definition is a desirable, although not always obtainable, property.tt,A distance measure, dis(), as opposed to similarity, is often used in ijclustering. The clustering problem then has the desirable property that giventKsimttdistt,,,(,)(,)K,,ttK,a cluster,, and . jjljmjijjljmjliSome clustering algorithms look only at numeric data, usually assuming metric data points. Metric attributes satisfy the triangular inequality. The cluster can then be described by using several characteristicKttt,,...,values. Given a cluster, of N points { }, we make the mmmmN12following definitions [ZRL96]:Here the centroid is the “middle” of the cluste r; it need not bean actualpoint in the cluster. Some clustering algorithms alternatively assume that the cluster is represented by one centrally located object in the cluster called a medoid. The radius is the square root of the average mean squared distance from any point in the cluster to the centroid, and of points in the cluster. WeKMuse the notation to indicate the medoid for cluster. mmMany clustering algorithms require that the distance betweenclusters (rather than elements) be determined. This is not an easy task given that there are many interpretations for distance between clusters. Given clustersKKand, there are several standard alternatives to calculate the distance jibetween clusters. A representative list is:, Single link: Smallest distance between an element in onecluster and an element in the other. We thus havemin((,))distttKK,,,,,,tKKKK,dis()=and. ijiljmilijjmji, Complete link: Largest distance between an element in onecluster and an element in the other. We thus havemax((,))distttKK,,,,,,tKKKK,dis()=and. ijiljmilijjmji, Average: Average distance between an element in onecluster and an element in the other. We thus havemeandistttKK((,)),,,,,,tKKKK,dis()=and. ijiljmilijjmji, Centroid: If cluster have a representative centroid, then thecentroid distance is defined as the distance between the centroids.KK,CC,CWe thus have dis()=dis(), whereis the centroid ijijiCKforand similarly for . ji, Medoid: Using a medoid to represent each cluster, thedistance between the clusters can be defined by the distancedisMM(,)KK,between the medoids: dis()= ijij5.3 OUTLIERSAs mentioned earlier, outliers are sample points with values much different from those of the remaining set of data. Outliers may represent errors in the data (perhaps a malfunctioning sensor recorded an incorrect data value) or could be correct data values that are simply much different from the remaining data. A person who is 2.5 meters tall is much taller than most people. In analyzing the height of individuals, this value probably would be viewed as an outlier.Some clustering techniques do not perform well with the presence of outliers. This problem is illustrated in Figure 5.3. Here if threeclusters are found (solid line), the outlier will occur in a cluster by itself. However, if two clusters are found (dashed line), the two (obviously) different sets of data will be placed in one cluster because they are closer together than the outlier. This problem is complicated by the fact that many clustering algorithms actually have as input the number of desired clusters to be found.Clustering algorithms may actually find and remove outliers to ensure that they perform better. However, care must be taken in actually removing outliers. For example, suppose that the data mining problem is to predict flooding. Extremely high water level values occur very infrequently, and when compared with the normal water level values may seem to be outliers. However, removing these values may not allow the data mining algorithms to work effectively because there would be no data that showed that floods ever actually occurred.Outlier detection, or outlier mining, is the process of identifying outliers in a set of data. Clustering, or other data mining, algorithms may then choose to remove or treat these values differently. Someoutlier detection techniques are based on statistical techniques. These usually assume that the set of data follows a known distribution andthat outliers can be detected by well-known tests such as discordancy tests. However, thesetests are not very realistic for real-world data because real-world data values may not follow well-defined data distributions. Also, most of these tests assume single attribute value, and many attributes areinvolved in real-world datasets. Alternative detection techniques may be based on distance measures.聚类分析5.1简介聚类分析与分类数据分组类似。
中文译文(四号、黑体、加黑、居中)聚类分析0.1什么是聚类分析?聚类分析是基于几个不同的标准把相似的事物分组。
其主要的思想是确定将被用于分析目的的分类对象。
这一想法已应用在许多领域,包括天文,考古,医学,化学,教育,心理学,语言学和社会学。
例如,生物科学领域已经广泛的应用类和子类去组编物种。
在化学上运用聚类思想的一个惊人的成功是Mendelev 的元素周期表。
在市场营销和政治预测方面,用美国邮政编码为社区分类已经成功的被用于根据生活习惯去集合社区. Claritas是一家公司,它首先通过聚类这一途径把社区用不同标准的消费支出和人口统计数据分为40类。
审查分类使Claritas能够为一些代表占统治地位社区生活方式的群体提出一些令人回味的名字,如“波西米亚混合” “皮草和旅行车” ,“金钱和大脑” 。
关于生活方式的知识可用来估计潜在需求的产品,如运动型多功能工具和服务,如娱乐巡航。
本章的目的是依据最常用的聚类分析技术和正确评价它的长处和短处来帮助你理解聚类分析的主要思想。
我们不能追求全面,因为有数以千计的方法(甚至有杂志专用的聚类想法:“分类杂志” !)。
一般来说,用于组成群的基本的数据是一个关于几个变量的测量数据的表,表的每一栏代表一个变量并且每一行代表一个目标,经常通过查阅统计数据作为一个例子。
这样行的集合被集合在一起为了使相似的例子在同一个群里。
群的数量可以是确定的或者由数据本身来确定。
0.2示例1 :公用数据.下表1.1给出了22个公司的数据关于美国公共事业。
我们感兴趣的是组成群体的相似公用工程。
被分类的对象是公用工程。
在表1.2中对每一个公用事业的描述有8个标准。
聚类对于一个例子是有用的,是一个研究去预测放松管制对成本价格的影响。
要做必要的分析,经济学家需要建立一个详细的各种公用工程的成本模型。
这将节省相当多的时间和精力,如果我们能够分类相似样式。
0.3聚类算法公用设施和建立详细的成本模型为一个集群里仅仅一个典型的公用设施,并按比例扩大从这些模型中来为所有的公共工程估算结果。
Cluster andTreeView中文翻译版LindaHarbin medical university2010-10-3介绍:Cluster和TreeView是分析并可视化DNA芯片数据或是其它基因组数据集的软件程序,Cluster (很快就有一个新的名字)用多种不同的方式组织分析数据,TreeView则将这些组织好的数据可视化,这个软件的下一个版本会将这两个软件合成为一个应用程序。
这个说明书是使用这个软件的一个参考,而不是对软件中所用方法的全面分析。
很多方法都是从标准的统计聚类中得到的,对于聚类分析的那些非常好的教科书,我们会在最后的参考书目中给列出,参考书目中还包括最新的生物科学的论文,尤其是那些所用的方法与我们的非常相似的论文。
Cluster导入数据:用Cluster的第一步就是导入数据,当前版本的Cluster只接受以tab键为分隔符的数据格式,比如Excel,通过点File Format Help可以得到输入格式的说明。
依照惯例,在输入表格中,行代表基因,列代表样本或是不同的观察,下面的例子就是一个时间过程的输入文件:第一列中的每一行(基因)一般都代表标识符(绿色的字符),第一行中每一列代表样本的标签(蓝色的字符),此时的标签表示时间进程,红色字符代表的是每一行基因的种类是什么,本文件的YORF代表酵母开放阅读框,这个地方可以是任意的字母或数字的值,在TreeView中,应用它可以将每一行的基因连接到外部的网站中。
剩下的数据就是每个基因在不同样本中的表达值,2行4列的“5.8”表示基因YAL001C在2小时观察到的数据为5.8。
空数据是允许的,就用空值表示(里面什么都没有),如,YAL005C 在2小时的数据就是空的。
我们很可能要对输入数据额外的添加一些信息,最大的Cluster的输入文件如下所示:黄色的区域是可有可无的,默认情况下,TreeView用第一列的ID号作为每个基因的标签,NAME那一列是对每个基因的进一步描述性标签,从而与第一列的标签相区别,关于GWEIGHT和GORDER这两列和EWEIGHT和EORDER这两行的内容会晚一些再解释。
国内图书分类号:O229 密级:公开西南交通大学研究生学位基于聚类分析的潜在语义文献检索申请学位级别理学硕士专业应用数学Southwest Jiaotong UniversityMaster Degree ThesisLATENT SEMANTIC RETRIEVAL BASED ON DOCUMENT CLUSTERING ANALYSISGrade: 20XXCandidate: Chunjiang WuAcademic Degree Applied for : Master’s DegreeSpeciality: Applied MathematicsSupervisor: Hailiang Zhao(Prof.)May.20XX西南交通大学学位版权使用授权书本学位作者完全了解学校有关保留、使用学位的规定,同意学校保留并向国家有关部门或机构送交的复印件和电子版,允许被查阅和借阅。
本人授权西南交通大学可以将本的全部或部分内容编入有关数据库进行检索,可以采用影印、缩印或扫描等复印手段保存和汇编本学位。
本学位属于1.保密□,在年解密后适用本授权书;2.不保密□,使用本授权书。
(请在以上方框内打“√”)学位作者签名:指导老师签名:日期:日期:西南交通大学硕士学位主要工作(贡献)声明本人郑重声明:所呈交的学位,是在导师指导下独立进行研究工作所得的成果。
除文中已经注明引用的内容外,本不包含任何其他个人或集体已经发表或撰写过的研究成果。
对本文的研究做出贡献的个人和集体,均已在文中作了明确说明。
本人完全了解违反上述声明所引起的一切法律责任将由本人承担。
本人在学位中所做的主要创新点如下:1. 词频矩阵的建立。
利用从查询关键词出发,获取相关文献,同时从相关文献中获取高质量扩展关键词,不断迭代搜索,获得更多的链式文献以及扩展关键词汇,建立词频矩阵。
这步仅解决因数据更新造成词频矩阵更换不便等问题,也能够不借用所有原始数据库进行语义分解,提高检索效率2.在奇异值降维分解中,对截取矩阵K的选择。
本科毕业论文外文文献及译文文献、资料题目:Cluster Analysis—Basic Concepts and Algorithms 文献、资料来源:文献、资料发表(出版)日期:院(部):土木工程学院专业:土木工程班级:姓名:学号:指导教师:翻译日期:外文文献:Cluster Analysis—Basic Concepts and AlgorithmsCluster analysis divides data into groups (clusters) that are meaningful, useful,or both. If meaningful groups are the goal, then the clusters should capture the natural structure of the data. In some cases, however, cluster analysis is only a useful starting point for other purposes, such as data summarization. Whether for understanding or utility, cluster analysis has long played an important role in a wide variety of fields: psychology and other social sciences, biology,statistics, pattern recognition, information retrieval, machine learning, and data mining.There have been many applications of cluster analysis to practical problems. We provid e some specific examples, organized by whether the purpose of the clustering is understanding or utility.Clustering for Understanding Classes, or conceptually meaningful groups of objects that share common characteristics, play an important role in how people analyze and describe the world. Indeed, human beings are skilled at dividing objects into groups (clustering) and assigning particular objects to these groups (classification). For example, even relatively young children can quickly label the objects in a photograph as buildings, vehicles, people, animals, plants, etc. In the context of understanding data, clusters are potential classes and cluster analysis is the study of techniques for automatically finding classes. The following are some examples:Biology.Biologists have spent many years creating a taxonomy (hierarchical classification) of all living things: kingdom, phylum, class,order, family, genus, and species. Thus, it is perhaps not surprising that much of the early work in cluster analys is sought to create a discipline of mathematical taxonomy that could automatically find such classification structures. More recently, biologists have applied clustering to analyze the large amounts of genetic information that are now available. For example, clustering has been used to find groups of genes that have similar functions.• Information Retrieval. The World Wide Web consists of billions of Web pages, andthe results of a query to a search engine can return thousands of pages. Clustering can be used to group these search results into a small number of clusters, each of which captures a particular aspect of the query. For instance, a query of “movie” might return Web pages grouped into categories such as reviews, trailers, stars, and theaters. Each category (cluster) can be broken into subcategories (sub-clusters), producing a hierarchical structure that further assists a user’s exploration of the query results.• Climate.Understanding the Earth’s climate requires finding patternsin the atmosphere and ocean. To that end, cluster analysis has been applied to find patterns in the atmospheric pressure of polar regions and areas of the ocean that have a significant impact on land climate.• Psychology and Medicine.An illness or condition frequently has a number of variations, and cluster analysis can be used to identify these different subcategories. For example, clustering has been used to identify different types of depression. Cluster analysis can also be used to detect patterns in the spatial or temporal distribution of a disease.• Business. Businesses collect large amounts of information on current and potential customers. Clustering can be used to segment customers into a small number of groups for additional analysis and marketing activities.Clustering for Utility:Cluster analysis provides an abstraction from individual data objects to the clusters in which those data objects reside. Additionally, some clustering techniques characterize each cluster in terms of a cluster prototype; i.e., a data object that is representative of the other objects in the cluster. These cluster prototypes can be used as the basis for a number of data analysis or data processing techniques. Therefore, in the context of utility, cluster analysis is the study of techn iques for finding the most representative cluster prototypes.• Summarization. Many data analysis techniques, such as regression or PCA, have a time or space complexity of O(m2) or higher (where m is the number of objects), and thus, are not practical for large data sets. However, instead of applying the algorithm to the entire data set, it can be applied to a reduced data set consisting only of cluster prototypes. Depending on the type of analysis, the number of prototypes, and the accuracy with which the prototypes represent the data, the results can be comparable to those that would havebeen obtained if all the data could have been used.• Compression. Cluster prototypes can also be used for data compres-sion. In particular, a table is created that consists of the prototypes for each cluster; i.e., each prototype is assigned an integer value that is its position (index) in the table. Each object is represented by the index of the prototype associated with its cluster. This type of compression is known as vector quantization and is often applied to image, sound, and video data, where (1) many of the data objects are highly similar to one another, (2) some loss of information is acceptable, and (3) a substantial reduction in the data size is desired • E ffciently Finding Nearest Neighbors.Finding nearest neighbors can require computing the pairwise distance between all points. Often clusters and their cluster prototypes can be found much more effciently. If objects are relatively close to the prototype of their cluster, then we can use the prototypes to reduce the number of distance computations that are necessary to find the nearest neighbors of an object. Intuitively, if two cluster prototypes are far apart, then the objects in the corresponding clusters cannot be nearest neighbo rs of each other. Consequently, to find an object’s nearest neighbors it is only necessary to compute the distance to objects in nearby clusters, where the nearness of two clusters is measured by the distance between their prototypes.This chapter provides an introduction to cluster analysis. We begin with a high-level overview of clustering, including a discussion of the various ap- proaches to dividing objects into sets of clusters and the different types of clusters. We then describe three specific cluste ring techniques that represent broad categories of algorithms and illustrate a variety of concepts: K-means, agglomerative hierarchical clustering, and DBSCAN. The final section of this chapter is devoted to cluster validity—methods for evaluating the goodness of the clusters produced by a clustering algorithm. More advanced clusteringconcepts and algorithms will be discussed in Chapter 9. Whenever possible,we discuss the strengths and weaknesses of different schemes. In addition,the bibliographic notes provide references to relevant books and papers that explore cluster analysis in greater depth.1.1OverviewBefore discussing specific clustering techniques, we provide some necessary background. First, we further define cluster ana lysis, illustrating why it isdiffcult and explaining its relationship to other techniques that group data.Then we explore two important topics: (1) different ways to group a set ofobjects into a set of clusters, and (2) types of clusters.1.1.1What Is Cluster Analysis?Cluster analysis groups data objects based only on information found in thedata that describes the objects and their relationships. The goal is that theobjects within a group be similar (or related) to one another and different from(or unrelated to) the objects in other groups. The greater the similarity (orhomogeneity) within a group and the greater the difference between groups,the better or more distinct the clustering.Cluster analysis is related to other techniques that are used to divide data objects into groups. For instance, clustering can be regarded as a form of classification in that it creates a labeling of objects with class (cluster) labels.However, it derives these labels only from the data. In contrast, classificationn the sense of Chapter 4 is supervised classification; i.e., new, unlabeled objects are assigned a class label using a model developed from objects with known class labels. For this reason, cluster analysis is sometimes referred to as unsupervised classification. When the term classification is used without any qualification within data mining, it typically refers to supervised classification.Also, while the terms segmentation and partitioning are sometimesused as synonyms for clustering, these terms are frequently used for approaches outside the traditional bounds of cluster analysis. For example, the termpartitioning is often used in connection with techniques that divide graphs into subgraphs and that are not strongly connected to clustering. Segmentation often refers to the division of data into groups using simple techniques; e.g.,an image can be split into segments based only on pixel intensity and color, orpeople can be divided into groups based on their income. Nonetheless, somework in graph partitioning and in image and market segmentation is relatedto cluster analysis.1.1.2 Different Types of ClusteringsAn entire collection of clusters is commonly referred to as a clustering, and in thissection, we distinguish various types of clusterings: hierarchical (nested) versus partitional (unnested), exclusive versus overlapping versus fuzzy, and complete versus partial.Hierarchical versus Partitional The most commonly discussed distinc- tion among different types of clusterings is whether the set of clusters is nested or unnested, or in more traditional terminology, hierarchical or partitional. Apartitional clustering is simply a division of the set of data objects into non-overlapping subsets (clusters) such that each data object is in exactly onesubset.If we permit clusters to have subclusters, then we obtain a hierarchical clustering, which is a set of nested clusters that are organized as a tree. Each node (cluster) in the tree (except for the leaf nodes) is the union of its children (subclusters), and the root of the tree is the cluster containing all the objects.Often, but not always, the leaves of the tree are singleton clusters of individual data objects. If we allow clusters to be nested, then one interpretation of Figure 8.1(a) is that it has two subclusters (Figure 8.1(b)), each of which, inturn, has three subclusters (Figure 8.1(d)). The clusters shown in Figures 8.1(a–d), when taken in that order, also form a hierarchical (nested) clusteringwith, respectively, 1, 2, 4, and 6 clusters on each level. Finally, note that a hierarchical clustering can be viewed as a sequence of partitional clusterings and a partitional clustering can be obtained by taking any member of that sequence; i.e., by cutting the hierarchical tree at a particular level.Exclusive versus Overlapping versus Fuzzy The clusterings shown in Figure 8.1 are all exclusive, as they assign each object to a single cluster.There are many situations in which a point could reasonably be placed in more than one cluster, and these situations are better addressed by non-exclusiveclustering. In the most general sense, an overlapping or non-exclusiveclustering is used to reflect the fact that an object can simul taneously belong to more than one group (class). For instance, a person at a university can be both an enrolled student and an employee of the university. A non-exclusiveclustering is also often used when, for example, an object is “between” two or more clusters and could reasonably be assigned to any of these clusters.Imagine a point halfway between two of the clusters of Figure 8.1. Rather than make a somewhat arbitrary assignment of the object to a single cluster,it is placed in all of the “equally good” clusters.In a fuzzy clustering, every object belongs to every cluster with a membership weightthat is between 0 (absolutely doesn’t belong) and 1 (absolutelybelongs). In other words, clusters are treated as fuzzy sets. (Mathematically,a fuzzy set is one in which an object belongs to any set with a weight thatis between 0 and 1. In fuzzy clustering, we often impose the additional constraint that the sum of the weights for each object must equal 1.) Similarly,probabilistic clustering techniques compute the probability with which each point belongs to each cluster, and these probabilities must also sum to 1. Because the membership weights or probabilities for any object sum to 1, a fuzzyor probabilistic clustering does not address true multiclass situations, such as the case of a student employee, where an object belongs to multiple classes .Instead, these approaches are most appropriate for avoiding the arbitrariness of assigning an object to only one cluster when it may be close to several. Inpractice, a fuzzy or probabilistic clustering is often converted to an exclusiveclustering by assigning each object to the cluster in which its membership weight or probability is highest.Complete versus Partial A complete clustering assigns every object to a cluster, whereas a partial clustering does not. The motivation for a partial clustering is that some objects in a data set may not belong to well-defined groups. Many times objects in the data set may represent noise, outliers, or“uninteresting background.” For example, some newspaper stories may share a common theme, such as global warming, while other stories are more genericor one-of-a-kind. Thus, to find the important topics in last month’s stories, we may want to search only for clusters of documents that are tightly related by a common theme. In other cases, a complete clustering of the objects is desired.For example, an application that uses clustering to organize documents forbrowsing needs to guarantee that all documents can be browsed.1.1.3Different Types of ClustersClustering aims to find useful groups of objects (cluster s), where usefulness is defined by the goals of the data analysis. Not sur prisingly, there are several different notions of a cluster that prove useful in practice. In order to visually illustrate the differences among these types of clusters, we use two-dimensional points, as shown in Figure 8.2, as our data objects. We stress, however, thatthe types of clusters described here are equally valid forother kinds of data.Well-Separated A cluster is a set of objects in which each object is closer (or more similar) to every other object in the cluster than to any object notin the cluster. Sometimes a threshold is used to specify that all the objects in a cluster must be sufficiently close (or similar) to one another. This ideal istic definition of a cluster is satisfied only when the data contains natural clusters that are quite far from each other. Figure 8.2(a) gives an example of well-separated clusters that consists of two groups of points in a two-dimensional space. The distance between any two points in different groups is larger than he distance between any two points within a group. Well-separated clusters do not need to be globular, but can have any shape.Prototype-Based A cluster is a set of objects in which each object is closer(more similar) to the prototype that defines the cluster than to the prototype of any other cluster. For data with continuous attributes, the prototype of a cluster is often a centroid, i.e., the average (mean) of all the points in the cluster. When a centroid is not meaningful, such as when the data has categorical attributes, the prototype is often a medoid, i.e., the most representative pointof a cluster. For many types of data, the prototype can be regarded as the most central point, and in such instances, we commonly refer to prototype-based clusters as center-based clusters. Not surprisingly, such clusters tend to be globular. Figure 8.2(b) shows an example of center-based clusters.Graph-Based If the data is represented as a graph, where the nodes are objects and the links represent connections among objects (see Section 2.1.2),then a cluster can be defined as a connected component; i.e., a group of objects that are connected to one another, but that have no connection to objects outside the group. An important example of graph-based clusters are contiguity-based clusters, where two objects are connected only if they are within a specified distance of each other. This implies that each object in a contiguity-based cluster is closer to some other object in the cluster than to any point in a different cluster. Figure 8.2(c) shows an example of such clusters for two-dimensional points. This definition of a cluster is useful when clusters are irregular or intertwined, but can have trouble when noise is present since, as illustrated by the two spherical clusters of Figure 8.2(c), a small bridge of points can merge two distinct clusters.Other types of graph-based clusters are also possible. One such approach (Section 8.3.2) defines a cluster as a clique; i.e., a set of nodes in a graph that are completely connected to each other. Specifically, if we add connections between objects in the ord er of their distance from one another, a cluster is formed when a set of objects forms a clique. Like prototype-based clusters, such clusters tend to be globular.Density-Based A cluster is a dense region of objects that is surrounded bya region of low density. Figure 8.2(d) shows some density-based clusters for data created by adding noise to the data of Figure 8.2(c). The two circular clusters are not merged, as in Figure 8.2(c), because the bridge between them fades into the noise. Likewise, the curve that is present in Figure 8.2(c) also fades into the noise and does not form a cluster in Figure 8.2(d). A density-based definition of a cluster is often employed when the clusters are irregular or intertwined, and when noise and outliers are present. By contrast, a contiguity- based definition of a cluster would not work well for the data of Figure 8.2(d)since the noise would tend to form bridges between clusters.Shared-Property (Conceptual Clusters)More generally, we can define a cluster as a set of objects that share some property. This definition encom passes all the previous definitions of a cluster; e.g., objects in a center-based cluster share the property that they are all closest to the same centroid or medoid. However, the shared-property approach also includes new types of clusters. Consider the clusters shown in Figure 8.2(e). A triangular area (cluster) is adjacent to a rectangular one, and there are two intertwined circles (clusters). In both cases, a clustering algorithm would need a very specific con cept of a cluster to successfully detect these clusters. The process of find- ing such clusters is called conceptual clustering. However, too sophisticated a notion of a cluster would take us into the area of pattern recognition, and thus, we only consider simpler types of clusters in this book.Road MapIn this chapter, we use the following three simple, but important techniques to introduce many of the concepts involved in cluster analysis.• K-means. This is a prototype-based, partitional clustering technique that attempts to find a user-specified number of clusters (K ), which are represented by their centroids.• Agglomerative Hierarchical Clustering.This clustering approach refers to a collection of closely related clustering techniques that produce a hierarchical clustering by starting with each point as a singleton cluster and then repeatedly merging the two closest clusters until a single, all- encompassing cluster remains. Some of these techniques have a natural interpretation in terms of graph-based clustering, while others have an interpretation in terms of a prototype-based approach.• DBSCAN. This is a density-based clustering algorithm that producesa partitional clustering, in which the number of clusters is automatically determined by the algorithm. Points in low-density regions are classified as noise and omitted; thus, DBSCAN does not produce a complete lustering.中文译文:聚类分析—基本概念及算法聚类分析将数据分为有意义的,有用的,或两者兼而有之的组(集群)。