SPC过程能力培训教材(English)
- 格式:pdf
- 大小:1.09 MB
- 文档页数:73

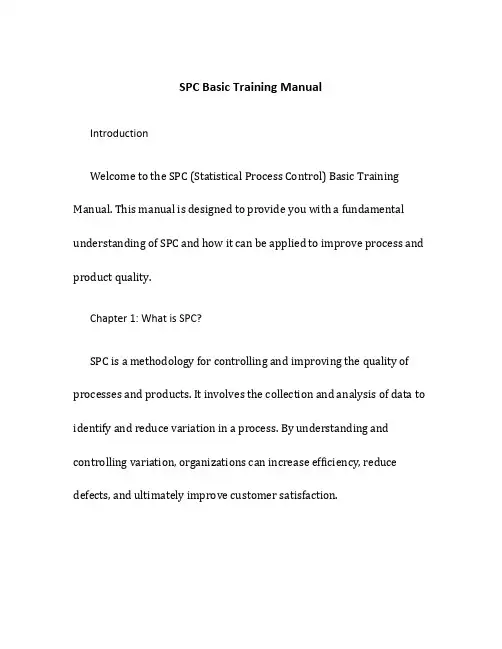
SPC Basic Training ManualIntroductionWelcome to the SPC (Statistical Process Control) Basic Training Manual. This manual is designed to provide you with a fundamental understanding of SPC and how it can be applied to improve process and product quality.Chapter 1: What is SPC?SPC is a methodology for controlling and improving the quality of processes and products. It involves the collection and analysis of data to identify and reduce variation in a process. By understanding and controlling variation, organizations can increase efficiency, reduce defects, and ultimately improve customer satisfaction.Chapter 2: Key SPC ConceptsIn this chapter, we will introduce you to the key concepts of SPC. These concepts include: - Variation: Understanding the different types of variation in a process. - Control charts: Learning how to create and interpret control charts to monitor process performance. - Process capability: Assessing the capability of a process to meet customer requirements. - Sampling: Understanding the importance of sampling techniques in data collection.Chapter 3: Tools and TechniquesIn this chapter, we will explore the various tools and techniques used in SPC. These include: - Pareto analysis: Identifying and prioritizing the most significant contributors to process variation. - Cause and effect diagrams: Investigating and understanding the root causes of process problems. - Histograms and scatter plots: Analyzingdata distributions and relationships. - Six Sigma: Applying the principles and methods of Six Sigma to improve process performance.Chapter 4: Implementing SPCIn this chapter, we will discuss the steps involved in implementing SPC in an organization. These steps include: 1. Define the process: Clearly define the process to be monitored and improved. 2. Collect data: Identify the appropriate data points and collect data over a period of time. 3. Analyze the data: Use statistical analysis techniques to identify patterns and trends in the data. 4. Implement control charts: Create control charts to monitor the process and identify out-of-control conditions. 5. Take corrective actions: When an out-of-control condition is detected, take appropriate corrective actions to bring the process back into control. 6. Continuously improve: Use the information gathered from SPC to make continuous improvements to the process.Chapter 5: SPC Case StudiesIn this final chapter, we will present real-life case studies that demonstrate the successful implementation of SPC in various industries. These case studies will highlight the benefits and the practical applications of SPC.ConclusionIn conclusion, SPC is a powerful methodology for improving process and product quality. By implementing SPC techniques, organizations can reduce defects, increase efficiency, and enhance customer satisfaction. This training manual serves as a foundation for your understanding of SPC and its applications. We encourage you to apply the knowledge gained from this manual to your own processes and make continuous improvements. Good luck on your SPC journey!。


(SPC基础知识培训教材)一、教学内容本节课的教学内容来自于SPC基础知识培训教材,主要涵盖第二章“SPC基本概念与原理”。
该章节主要介绍了SPC(Statistical Process Control,统计过程控制)的定义、目的、基本原理和方法。
具体内容包括:SPC的起源与发展、SPC的基本概念、控制图的原理与类型、过程能力的评估、不合格品的控制等。
二、教学目标1. 让学生了解和掌握SPC的基本概念和原理,理解SPC在生产过程中的重要作用。
2. 培养学生运用SPC方法分析和解决实际问题的能力。
3. 帮助学生掌握控制图的绘制和解读方法,提高产品质量控制水平。
三、教学难点与重点重点:SPC的基本概念、控制图的原理与类型、过程能力的评估、不合格品的控制。
难点:控制图的绘制和解读方法,过程能力的计算。
四、教具与学具准备教具:多媒体教学设备、黑板、粉笔。
学具:教材、笔记本、彩色笔。
五、教学过程1. 实践情景引入:以一个生产线的质量问题为背景,引导学生思考如何通过SPC方法解决此类问题。
2. 知识讲解:详细讲解SPC的基本概念、目的、原理和方法,以及控制图的类型和作用。
3. 例题讲解:选取具有代表性的例题,讲解控制图的绘制方法和步骤,以及如何通过控制图分析生产过程的质量状况。
4. 随堂练习:让学生分组绘制控制图,并分析给定的生产数据,判断过程是否稳定。
5. 过程能力评估:讲解过程能力的概念和计算方法,让学生学会如何评估和改进生产过程。
6. 不合格品控制:介绍不合格品的定义、分类和控制方法,强调不合格品对产品质量的影响。
六、板书设计板书内容主要包括:SPC的基本概念、控制图的类型、过程能力的计算、不合格品控制。
七、作业设计1. 作业题目:请根据给定的生产数据,绘制控制图,并分析过程是否稳定。
2. 作业答案:(待学生完成作业后,教师提供答案进行讲解和反馈)八、课后反思及拓展延伸1. 课后反思:本节课的教学效果如何,学生是否掌握了SPC的基本概念和方法,有哪些需要改进的地方。
SPC培训教材引言SPC(StatisticalProcessControl,统计过程控制)是一种以统计方法为基础的过程控制技术。
它通过对生产过程中收集的数据进行分析,实现对过程稳定性和产品质量的有效监控和控制。
本教材旨在为读者提供SPC的基本概念、原理、方法和应用技巧,帮助读者掌握SPC的实施步骤和技巧,提高生产过程的质量管理水平。
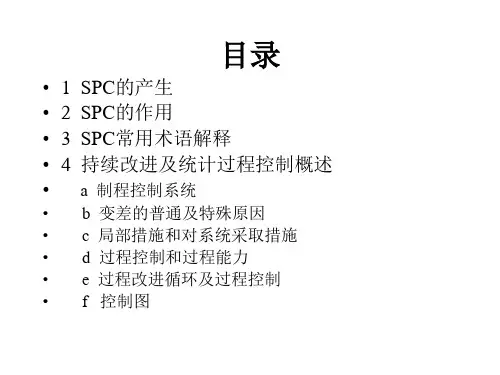
第一章:SPC基本概念1.1质量管理的发展1.2SPC的定义和作用1.3SPC的基本原理1.4SPC与全面质量管理的关系第二章:SPC的基本工具2.1控制图2.1.1控制图的类型和用途2.1.2控制图的绘制方法2.1.3控制图的判读规则2.2直方图2.2.1直方图的绘制方法2.2.2直方图的分析和应用2.3过程能力指数2.3.1过程能力指数的定义和计算方法2.3.2过程能力指数的应用和分析第三章:SPC的实施步骤3.1数据收集和整理3.1.1数据的类型和来源3.1.2数据的收集方法3.1.3数据的整理和表示3.2控制图的绘制和应用3.2.1控制图的绘制步骤3.2.2控制图的判读和应用3.3过程分析和改进3.3.1过程分析的方法和工具3.3.2过程改进的策略和实施第四章:SPC的应用案例4.1制造业中的应用案例4.2服务行业中的应用案例4.3公共事业中的应用案例第五章:SPC的推广和持续改进5.1SPC的推广策略5.2SPC的培训和效果评估5.3SPC的持续改进和优化结论通过对本教材的学习,读者应该能够掌握SPC的基本概念、原理、方法和应用技巧。
然而,SPC的实施需要结合实际情况进行具体的分析和应用,因此读者需要在实践中不断探索和总结,不断提高自己的质量管理水平。
希望本教材能够为读者提供有用的指导和帮助,促进SPC在各个领域的应用和发展。
重点关注的细节:控制图的绘制和应用控制图是SPC(统计过程控制)中最重要的工具之一。
它通过图形化的方式,直观地展示了生产过程中的数据变化,帮助工作人员及时发现问题,采取相应的措施,从而实现对生产过程的有效控制。
Process Capability (Cp / Cpk / Pp / Ppk)Global Training MaterialCreator Function Approver Document ID Version / Status Location : Global Mechanics Process Manager : Mechanics : Jukka Mehtonen / Global Process Team : DMT00018-EN : V.2.0 / Approved : Notes : \\…\ NMP \ DOCMANR4 \ PCP \ PC Process Library DocManChange History : Issue Date1.0 2.0 21st Dec’01 17th Jun’05Handled ByCommentsJim Christy & Søren Lundsfryd Approved for Global Use Yrjo Saastamoinen Approved for Global UseNOTE – All comments and improvements should be addressed to the creator of this document.1 © NOKIA 2005 T0001802.PPT/ 17-Jun-2005 / Yrjo SaastamoinenCompany ConfidentialContentsSection 1 2 3 4 5 6 7 Heading / Description Page Variation, Tolerances and Dimensional Control 4 Population, Sample and Normal Distribution 15 Cp and Cpk Concept 28 Confidence Interval 37 Process Capability Analysis 47 Mini Cpk Cpk Data Collection Spreadsheet DMM00024 60532© NOKIA 2005 T0001802.PPT/ 17-Jun-2005 / Yrjo SaastamoinenCompany ConfidentialTool Verification ProcessMeasurement System Analysis• Calibration • Variable Gauge R&R •DMY00019, DMT00017, DMM00210Tool Approval – at Tool Maker / Supplier• FAI (DMY00019, DMT00014, DMM00061) • Precontrol: Set-up Rules5 Min Variation Short TermMachine Approval – process capability• 3-10hr Run • Process Capability: Cpk, Ppk •DMY00019, DMT00018, DMM0002410 Hr Variation Long TermProcess Performance• Ongoing production • Process Stability • Process Capability: Cpk, Ppk3 © NOKIA 2005 T0001802.PPT/ 17-Jun-2005 / Yrjo Saastamoinen6 Mo Variation PerformanceCompany ConfidentialProcess Capability - Evaluating Manufacturing Variation4© NOKIA 2005 T0001802.PPT/ 17-Jun-2005 / Yrjo SaastamoinenCompany ConfidentialSection 1 Variation, Tolerances and Dimensional Control5© NOKIA 2005 T0001802.PPT/ 17-Jun-2005 / Yrjo SaastamoinenCompany ConfidentialTwo Types of Product CharacteristicsVariable: A characteristic measured in physical units, e.g. millimetres, volts, amps, decibel and seconds. ly s on le ariab v with deal e i ng w in s tra i In t h Attribute: A characteristic that by comparison to some standard is judged “good” or “bad”, e.g. free from scratches (visual quality).ONOFF6© NOKIA 2005 T0001802.PPT/ 17-Jun-2005 / Yrjo SaastamoinenCompany ConfidentialThe Sources of Process/System VariationEquipment MethodsEnvironment ProcessCustomer SatisfactionOperatorsMaterial7© NOKIA 2005 T0001802.PPT/ 17-Jun-2005 / Yrjo SaastamoinenCompany ConfidentialTwo Types of Processes• All processes have: –Natural (random) variability => due to common causes–Unnatural variability=> due to special causes• Stable Process: A process in which variation in outcomes arises “only" from common causesUSL• Unstable Process: A process in which variation is a result of both common and special causesUSLDefectnominal value nominal valueLSLLSL8© NOKIA 2005 T0001802.PPT/ 17-Jun-2005 / Yrjo SaastamoinenCompany ConfidentialThe Two Causes of VariationUSLNominal value LSL• Common Causes: –Causes that are implemented in the process due to the design of the process, and affect all outcomes of the process –Identifying these types of causes requires methods such as Design of Experiment (DOE), etc.DefectUSLnominal valueLSL• Special Causes: –Causes that are not present in the process all the time and do not affect all outcomes, but arise because of specific circumstances –Special causes can be identified using Statistical Process Control (SPC)Shewhart (1931)9© NOKIA 2005 T0001802.PPT/ 17-Jun-2005 / Yrjo SaastamoinenCompany ConfidentialTolerancesA tolerance is a allowed maximum variation of a dimension.Rejected Part Rejected ProductAcceptable partRejected PartLSL (lower specification limit) 10,7Nominal 10,8±0,1USL (upper specification limit) 10,910© NOKIA 2005 T0001802.PPT/ 17-Jun-2005 / Yrjo SaastamoinenCompany ConfidentialExample of Capability Analysis Data•For some critical dimensions we need to measure more than 1 part•For capability data we usually measure 5 pcs 2times/hour=100 pcs(but sampling plan needs to be made on the basis of production quantity, run duration and cycle time) 1st S u b g ro u p2n d S u b g ro u p3rd S u b g ro u p4th S u b g ro u p118.53118.52118.54118.56118.54118.54118.52118.55118.51118.51118.50118.55118.53118.51118.52118.55118.51118.54118.54118.555th S u b g ro u p6th S u b g ro u p7th S u b g ro u p8th S u b g ro u p118.55118.54118.57118.60118.54118.56118.56118.57118.55118.55118.57118.55118.54118.54118.55118.56118.56118.53118.54118.559th S u b g ro u p10th S u b g ro u p11th S u b g ro u p12th S u b g ro u p118.60118.61118.58118.60118.59118.60118.60118.63118.58118.61118.61118.63118.60118.59118.60118.61118.59118.59118.59118.64Process Capability -What is it?•Process Capability is a measure of the inherent capability of a manufacturing process to be able to consistently produce components that meet therequired design specifications•Process Capability is designated by C p and C pk•Process Performance is a measure of the performance of a process to be able to consistently produce components that meet the required design specifications. Process Performance includes special causes of variation not present in Process Capability•Process Performance is designated P p and P pkSection 2.Population, Sample and Normal Distribution),...,,min(),...,,max(2121N N x x x x x x R −=Example: x 1= 5x 2= 7x 3= 4x 4= 2x 5= 6527)6,2,4,7,5min()6,2,4,7,5max(=−=−=R •The most simple measure of variability is the range . The range of a sample is defined by as the difference between the largest and the smallest observation from samples in a sub-group, e.g. 5 consecutive parts from the manufacturing process.Describe Process variation?DE N T RThe difference between sST and sLT•The difference between sLT and sSTis only in the way that thestandard deviation is calculated•sLT is always the same or larger than sST•If sLT equals sST, then the process control over the longer-term isthe same as the short-term, and the process would not benefit from SPC•If sLT is larger than sST, then the process has lost control over thelonger-term, and the process would benefit from SPC•The reliability of sLT is improved if the data is taken over a longerperiod of time. Alternatively sLT can be calculated on severaloccasions separated by time and the results compared to see whether sLTis stableSection 3.Cp and Cpk ConceptWhat is the Difference Between Cp and Cpk?• The Cp index only accounts for process variability • The Cpk Index accounts for process variability and centering of the process mean to the design nominal • Therefore, Cp ≥ Cpk • NOTE: Same applies also for Pp and PpkNominal Mean Mean = Nominal Reject parts Reject parts Reject partsLSLUSLCp = Cpk (both low)LSLUSLCp high, Cpk low Process should be optimized!Company Confidential31© NOKIA 2005 T0001802.PPT/ 17-Jun-2005 / Yrjo SaastamoinenWhat Do These Indexes Tell Us ??• Simple numerical values to describe the quality of the process >> Thehigher the number the better• Requirement for Cp and Cpk is 1.67 min. • Recommendation for Pp and Ppk is 1.33 min.• •This leaves us some space for the variation, i.e. a safety margin Are we able to improve our process by using SPC?• If index is low, following things should be given a thought: • Is the product design OK? • Are tolerance limits set correctly? • •32Is the process capable of producing good quality products? Process variation? DOE required? Is the measuring system capable? (See Gage R&R)Company Confidential© NOKIA 2005 T0001802.PPT/ 17-Jun-2005 / Yrjo SaastamoinenCpk - With a 2-sigma safety margin• Requirement for Cp and Cpk is 1.67 min.of = 5/3 or 10/6.LSL1.67 is a ratioUSL10 * standard deviation 6 * standard deviation LCL UCL2 * standard deviation2 * standard deviation- 3 sSTMean value = Nominal value or Target+ 3 sST33© NOKIA 2005 T0001802.PPT/ 17-Jun-2005 / Yrjo SaastamoinenCompany ConfidentialAcceptability of Cpk Index•Cpk < 1.67the process NOT CAPABLE•Cpk >= 1.67 •Cpk >= 2.0the process is CAPABLEthe process has reached Six Sigma level34© NOKIA 2005 T0001802.PPT/ 17-Jun-2005 / Yrjo SaastamoinenCompany ConfidentialWhat Do These Indexes Tell Us ??• If Cp = Cpk, • If Pp = Ppk, • If Cpk < Cp, • If Ppk < Pp, • If Cp = Pp, • If Cpk = Ppk, • If Pp < Cp, • If Ppk < Cpk,35… then process perfectly centred… then process not centred (check process mean against design nominal)… then process is not affected by special causes during the study run. SPC would not be effective in this case … then process is affected by special causes. Investigate X-bar/R-chart for out-of-control conditions. SPC may be effectiveCompany Confidential© NOKIA 2005 T0001802.PPT/ 17-Jun-2005 / Yrjo SaastamoinenCp and Cpk Indices and Defects(both tails of the normal distribution)Cpk /Ppk 0.1 0.1 0.2 0.3 0.4 0.5 0.6 0.7 0.8 0.9 1.0 1.1 1.2 1.33 1.4 1.5 1.67 2.0 2.5 3.0 4.0 0.2 0.3 0.4 0.5 0.6 0.7 0.8 0.9 Cp/Pp 1.0 1.1 1.2 1.33 1.4 1.5 1.67 2.0 2.5 3.0 4.0 % / PPM % % % % % % % % % PPM PPM PPM PPM PPM PPM PPM PPM PPM PPM PPM 76.42 56.61 44.89 40.00 38.56 38.26 38.21 38.21 38.21 38.21 38.21 38.21 38.21 38.21 38.21 38.21 38.21 38.21 38.21 38.21 54.86 38.93 31.02 28.25 27.56 27.44 27.43 27.43 27.43 27.43 27.43 27.43 27.43 27.43 27.43 27.43 27.43 27.43 27.43 36.81 25.09 20.19 18.75 18.45 18.41 18.41 18.41 18.41 18.41 18.41 18.41 18.41 18.41 18.41 18.41 18.41 18.41 23.01 15.10 12.33 11.64 11.52 11.51 11.51 11.51 11.51 11.51 11.51 11.51 11.51 11.51 11.51 11.51 11.51 13.36 8.47 7.19 7.03 4.41 3.57 6.73 3.73 2.13 1.64 6.69 3.61 1.83 0.95 0.69 6.68 3.59 1.79 0.84 0.40 2700 6.68 3.59 1.79 0.82 0.35 1509 967 6.68 3.59 1.79 0.82 0.35 1363 532 318 6.68 3.59 1.79 0.82 0.35 1350 485 165 63 6.68 3.59 1.79 0.82 0.35 1350 484 160 38 27 6.68 3.59 1.79 0.82 0.35 1350 483 159 33 14 7 6.68 3.59 1.79 0.82 0.35 1350 483 159 33 13 3 0.6 6.68 3.59 1.79 0.82 0.35 1350 483 159 32 13 3 0.3 0.0 6.68 3.59 1.79 0.82 0.35 1350 483 159 32 13 3 0.3 0.0 0.0 6.68 3.59 1.79 0.82 0.35 1350 483 159 32 13 3 0.3 0.0 0.0 0.0 6.68 3.59 1.79 0.82 0.35 1350 483 159 32 13 3 0.3 0.0 0.0 0.0 0.0Pp=Ppk=1,33 63 ppm defects = 0,006%Cp=Cpk=1,67 0,6 ppm defects = 0,00006% Note: Ppm reject rates calculated from Cp & Cpk are based on the short term variation which may not represent the long term reject rate36 © NOKIA 2005 T0001802.PPT/ 17-Jun-2005 / Yrjo SaastamoinenCompany ConfidentialThe Effects of Cpk and Cp on FFRCpk Cp Ppm defects Total number of defects for 50,000,000 parts 410,000 67,500 3,150 1,650 350 30 0 Total number of defects if phone has 10 of these parts 4,100,000 675,000 31,500 16,500 3,500 300 10.8 1 1.331.33 1.33 1.331.33 1.50 1.67 2.001.67 1.50 1.67 2.008,200 1,350 63 33 7 1 037© NOKIA 2005 T0001802.PPT/ 17-Jun-2005 / Yrjo SaastamoinenCompany ConfidentialSection 4. Confidence Intervals38© NOKIA 2005 T0001802.PPT/ 17-Jun-2005 / Yrjo SaastamoinenCompany ConfidentialConfidence of Cpk• Cpk values are not definite numbers as they are based on relatively small samples of a population. • The 95% confidence interval determines the interval which includes the true Cpk value with a probability of 95%, i.e. "there is a probability of 5% that Cpk is either lower or higher" than this confidence interval.Cpk lower confidence limit Calculated cpk Cpk upper confidence limit95% confidence interval39© NOKIA 2005 T0001802.PPT/ 17-Jun-2005 / Yrjo SaastamoinenCompany ConfidentialConfidence Intervals95% Confidence Interval on a Cpk of 1.67Cpk.L 3.500 3.000 2.500 Cpk 2.000 1.500 1.000 0.500 0.000 0 50 100 150 200 250 Sam ple Size Cpk.USmall sample sizes gives wide confidence intervalsCompany Confidential40© NOKIA 2005 T0001802.PPT/ 17-Jun-2005 / Yrjo SaastamoinenCpk Confidence Limits with a sample size of 100 and a nominal Cpk of 1.6741© NOKIA 2005 T0001802.PPT/ 17-Jun-2005 / Yrjo SaastamoinenCompany ConfidentialExercise : Cp and Cpk• Determine the approximate Cp and Cpk for the 4 sample populations on the following page • Should actions be made to improve these processes. If yes, which?42© NOKIA 2005 T0001802.PPT/ 17-Jun-2005 / Yrjo SaastamoinenCompany ConfidentialEstimate Cp and Cpk?The width of the normal distributions shown include ±3*sA)B)LSLUSLLSLUSLC)D)LSL43USLLSLUSLCompany Confidential© NOKIA 2005 T0001802.PPT/ 17-Jun-2005 / Yrjo SaastamoinenEstimate Cp and Cpk? - A)Mean and nominalA)LSLUSL - LSL 6*s Mean - LSL USL - MeanUSL3*s44 © NOKIA 2005 T0001802.PPT/ 17-Jun-2005 / Yrjo SaastamoinenCompany ConfidentialEstimate Cp and Cpk? - B)Mean NominalB)LSLUSL - LSL 6*s Mean - LSLUSLUSL - Mean 3*sCompany Confidential45© NOKIA 2005 T0001802.PPT/ 17-Jun-2005 / Yrjo SaastamoinenEstimate Cp and Cpk? - C)Mean NominalC)LSLUSLUSL - LSL 6*s Mean - LSL USL - Mean 3*s46© NOKIA 2005 T0001802.PPT/ 17-Jun-2005 / Yrjo SaastamoinenCompany ConfidentialEstimate Cp and Cpk? - DMean NominalD)LSLUSL - LSL 6*s Mean - LSL 3*s47 © NOKIA 2005 T0001802.PPT/ 17-Jun-2005 / Yrjo SaastamoinenUSLUSL - MeanCompany ConfidentialSection 5. Process Capability Analysis48© NOKIA 2005 T0001802.PPT/ 17-Jun-2005 / Yrjo SaastamoinenCompany ConfidentialProcess Capability Analysis–Used to determine the capability of both the tool and the manufacturing – – – – –process to produce parts consistently to specification. White (and black) diamonds indicate the dimensions used for Cpk analysis Nokia has a standard Data Collection spreadsheet which must be used for ALL White (& black) Diamonds marked on the drawing. Any out of specification data or control conditions need to be investigated and explained. Any Process Capability indices (Cp or Cpk) which are less than 1.67 need to be investigated and explained. Any Process Capability indices (Pp or Ppk) which are less than 1.33 need to be investigated and explained–NMP’s quality requirements must be met PRIOR to Mass Productionrelease (E3 Milestone). ** CONFIDENCE in both the Tool, Process and Supplier **49© NOKIA 2005 T0001802.PPT/ 17-Jun-2005 / Yrjo SaastamoinenCompany Confidential1. Agree how long trial run lasts (3-10hrs) 2. Stabilise process and visual qualityProcess Capability Analysis TrialDepends on program, technology used and needed volumesRequired time depends on part and technology usedRequired time depends on part and technology used Se ion sificat al 6. Fill measurement data into Cpk Data Collection s ction Cla Spreadsheet of Fun teristics Dimension c 9-30 min between samples taken Chara 7. Analyse data3. Note the main parameters for reference 4. Collect and mark (eg. time, date and cavity) 5 consecutive parts out from each cavity at regular intervals for the duration of the trial. (The interval length will be the production run time divided by 20). Total 20 sets of 5 parts from each cavity must be made 5. Collected parts need to stabilize before measurements -EN may begin 00019 d Marking e DMY an8. Send samples and data to Nokia Note: For clarity, only 6 subgroups are shownNumber of subgroups N = 20 Subgroup size n = 5 Time50 © NOKIA 2005 T0001802.PPT/ 17-Jun-2005 / Yrjo SaastamoinenCompany Confidential。