ORACLE 报表制作步骤
- 格式:doc
- 大小:318.00 KB
- 文档页数:4

oracle创建⽤户、创建表空间、授权、建表的完整过程1.⾸先以sysdba的⾝份登录oracle conn /as sysdba 查询⽤户: select username from dba_users; 查询表空间 select username, default_tablespace from dba_users where username='⽤户名‘; 查询数据⽂件 select file_name, tablespace_name from dba_data_files;2.然后就可以来创建⽤户. create user ⽤户名 identified by 密码;3.修改⽤户的密码 alter user ⽤户名 identified by 新密码;4.创建⼀个表空间 create tablespace 表空间名 datafile '空间物理存储路径(f:\ts_zzg\zzg_data.dbf后缀随意)' size ⼤⼩(200M);5.将表空间分配给⽤户 alter user ⽤户名 default tablespace 表空间名;6.为⽤户分配权限 grant create session,create table,create view,create sequence,unlimited tablespace to ⽤户名; grant all privileges to ⽤户名;(全部权限)7.查看所有⽤户所在的表空间 select username,default_tablespace from dba_users;8.查询⽤户所具有的权限 select *from session_privs;9.删除⽤户及其相关对象 drop user ⽤户名;。
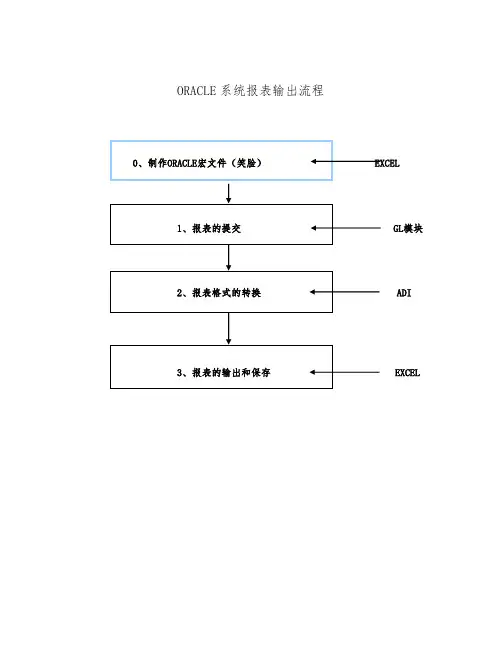
ORACLE系统报表输出流程GL模块ADIEXCEL0、制作ORACLE宏文件(笑脸)a. 首先根据需要拷贝BOOK1_国.xls(BOOK1_国际.xls)文档或从“财会家园”中下载该文档。
(有时需要解压缩)将其拷贝到其他文件夹,并将文件改为BOOK1.xlsb. 打开BOOK1.xls ,弹出“安全警告”窗口,选择启用宏按钮选择“工具”菜单中的“自定义……”选项。
将类别是“宏”中自定义按钮,拖至菜单栏如下图:关闭“自定义”窗口。
单击笑脸按钮,跳出如下窗口:选择宏名是“ meus ”的宏然后确定。
最后,退出EXCEL1、报表集方式提交:GL 模块提供了按报表集提交报表的功能,所谓报表集即事先定义的多个集合,报表运行时可按报表集提交运行。
1、操作路经:报告/请求/财务/单个报表集2、选择需运行的报表集及会计周期3、点击“应用”,则报表集中所用报表全部改为所选周期。
4、选择:提交,系统、产生一组后台进程,进程完毕后即生成所定义的报表。
2、报表格式的转换a.登陆ADI系统打开ADI 进入登陆窗口,输入用户名、密码(同ORACLE系统)b.查询、添加请求标识选择任务栏中的“请求中心”窗口,单击此按钮,跳出“选择请求监视器”窗口,选中“完成”选项然后单击查询按钮。
单击查询按钮后,出现在ORACLE系统中提交的请求,选择需要的报表,单击添加按钮单击添加按钮后,关闭“选择请求监视器”窗口。
c、报表的发布回到“请求中心”窗口,选择“已完成”选项卡,如下图:单击发布按钮,等待片刻后,跳出如下窗口:注意:当有多个报表需要输出时,只能一个一个的发布注意:输出类型选择:电子表格电子表格选项:发布至:空新工作簿请求中心消息显示,我们提交的报表请求已经成功完成。
如果没有出现“报表格式转换”菜单,单击“笑脸”按钮,弹出如下窗口:选择启用宏按钮“报表格式转换”菜单会自动跳出。
选择“报表格式转换”菜单中的需要转换得表格,比如:资产负债表;系统会运行宏程序,最后形成最终的报表格式。

FSG报表创建日期: 2007.9.19确认日期:控制编码:当前版本: 1.0FSG报表概念:财务报表生成器(FSG) 是Oracle 总帐管理系统的一个强有力的报表建立工具。
使用FSG,可以实现以下功能:1.依据总帐中的数据生成财务报表,例如损益表和资产负债表。
注:如果在帐套中启用了平均余额处理,则可以报告本位币、输入的外币或已折算外币平均余额。
2.应用安全规则,可以控制在使用FSG 运行任何报表时可以按特定用户和责任打印的财务信息。
3.定义报表具有可重新使用的报表对象,简化从已定义的报表组件中创建新报表的过程。
4.设计自定义财务报表以满足特定业务需要。
5.根据需要,可以同时打印多个报表。
6.在同一报表请求中,可以为多个公司、成本中心、部门或帐户结构的任何其它段打印相同的报表。
7.计划报表自动运行。
8.在需要时生成即席报表。
9.打印报表为制表位分隔文件,以导入基于客户的电子表格程序。
另外,也可以使用“GL 桌面集成器”的“报表向导”功能来设计和提交财务报表,以及直接从电子表格查看结果。
FSG可以通过指定报表对象来定义报表。
最简单的报表是通过行集和标准栏集来定义的。
以资产负债表为例,其栏集包括可以指定自定义栏集,可以添加目录集、行顺序和(或)显示集以增强报表或改进报表中的信息,也可以指定报表要包含的预算、保留类型和币种。
一旦定义并保存报表以后,可以随时用报表 - 运行报表、定义报表集或复制它并将其另保存为一个新报表。
FSG表的定义流程定义行集:1、(N)报表>定义>行集,进入“行集”窗口2、输入行集的名称和说明。
名称:资产负债表(行集)说明:资产负债表(行集)3、选择“定义行”4.为行集中的每行输入一个行号。
行号可以控制行在报表中的显示顺序。
也可以在创建行计算时使用此行号。
设置行号为“10”。
输入行号(整数),报表将根据行号的大小来决定每行的显示顺序,小号行在报表的前面显示。
为考虑以后报表的维护,如在相邻两行之间可能加一行等,建议相邻行的行号之间留有空号。

oracle apex 开发报表的技巧Oracle APEX是一款强大的低代码开发工具,可以帮助开发人员快速构建报表。
在开发报表的过程中,有一些技巧可以帮助开发人员更高效地完成工作。
一、使用合适的SQL查询在开发报表时,SQL查询是获取数据的关键。
为了提高查询效率,开发人员可以使用合适的SQL语句。
首先,要确保查询语句是正确的,可以通过在数据库工具中运行查询来验证。
其次,可以使用连接查询来获取更多相关的数据。
此外,还可以使用聚合函数和子查询来计算汇总数据。
二、使用适当的布局和样式报表的布局和样式对用户体验至关重要。
在Oracle APEX中,可以使用报表模板来定义报表的整体样式。
此外,还可以使用CSS来自定义报表的样式。
开发人员可以根据需求选择合适的布局和样式,以提高报表的可读性和美观性。
三、添加过滤器和排序功能为了方便用户查找和分析数据,报表中通常需要添加过滤器和排序功能。
在Oracle APEX中,可以使用Interactive Report组件来实现这些功能。
通过配置过滤器和排序选项,用户可以根据自己的需求对报表数据进行筛选和排序。
四、使用条件格式化条件格式化是一种在报表中根据特定条件对数据进行格式化的功能。
在Oracle APEX中,可以使用条件格式化功能来实现这一点。
开发人员可以根据需要设置条件,例如根据数值大小、日期范围或文本内容等条件来格式化报表数据,从而提供更直观和易于理解的信息。
五、添加交互功能为了增强报表的交互性,开发人员可以添加一些交互功能。
例如,可以添加链接到其他报表或页面的超链接,以方便用户导航和浏览数据。
此外,还可以添加弹出窗口或模态框来显示详细信息或执行其他操作。
这些交互功能可以提高用户体验并使报表更加灵活和易于使用。
六、使用动态SQL语句动态SQL是一种根据运行时条件生成SQL语句的方法。
在Oracle APEX中,可以使用动态SQL来实现报表的动态生成。
开发人员可以根据用户的选择或输入来生成不同的SQL语句,从而动态地生成报表数据。
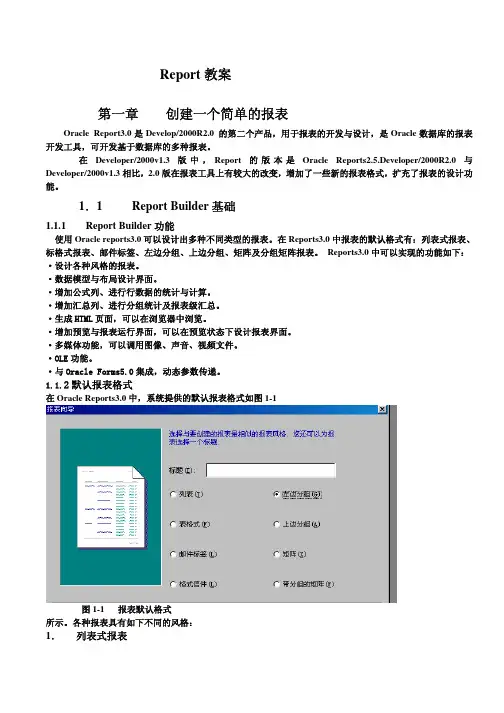
Report教案第一章 创建一个简单的报表Oracle Report3.0是Develop/2000R2.0 的第二个产品,用于报表的开发与设计,是Oracle数据库的报表开发工具,可开发基于数据库的多种报表。
在Developer/2000v1.3版中,Report的版本是Oracle Reports2.5.Developer/2000R2.0与Developer/2000v1.3相比,2.0版在报表工具上有较大的改变,增加了一些新的报表格式,扩充了报表的设计功能。
1.1 ReportBuilder基础Builder功能1.1.1 Report使用Oracle reports3.0可以设计出多种不同类型的报表。
在Reports3.0中报表的默认格式有:列表式报表、标格式报表、邮件标签、左边分组、上边分组、矩阵及分组矩阵报表。
Reports3.0中可以实现的功能如下:·设计各种风格的报表。
·数据模型与布局设计界面。
·增加公式列、进行行数据的统计与计算。
·增加汇总列、进行分组统计及报表级汇总。
·生成HTML页面,可以在浏览器中浏览。
·增加预览与报表运行界面,可以在预览状态下设计报表界面。
·多媒体功能,可以调用图像、声音、视频文件。
·OLE功能。
·与Oracle Forms5.0集成,动态参数传递。
1.1.2默认报表格式在Oracle Reports3.0中,系统提供的默认报表格式如图1-1图1-1 报表默认格式所示。
各种报表具有如下不同的风格:1.列表式报表列表示报表是普通的报表形式,也是最常用的一种报表。
这种报表的特点是各列的列名显示在域的上面。
列的数据从上向下打印输出。
如图1-2所示。
图1-2 列表式报表风格2.表格式报表表格式报表的显示方式是每页显示一个记录,打印完一条记录即换页。
如图1-3所示。
图1-3 表格式报表风格3.邮电标签报表这种报表主要用于打印信封封面。

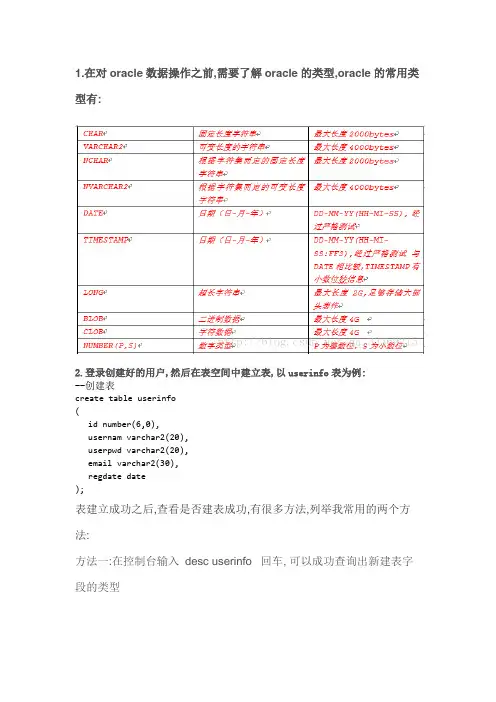
1.在对oracle数据操作之前,需要了解oracle的类型,oracle的常用类型有:2.登录创建好的用户,然后在表空间中建立表,以userinfo表为例:--创建表create table userinfo(id number(6,0),usernam varchar2(20),userpwd varchar2(20),email varchar2(30),regdate date);表建立成功之后,查看是否建表成功,有很多方法,列举我常用的两个方法:方法一:在控制台输入desc userinfo 回车, 可以成功查询出新建表字段的类型方法二:使用图形化工具直接查询表select * from userinfo;3.添加字段alter table table_nameadd column_name datatype;table_name是表名称, column_name是列名称, datatype是数据类型eg:添加一个字段remark字段,是varchar2类型,长度为100alter table userinfoadd remarks varchar2(100);查看表结构:给字段添加注释comment on column 表.列 is '列注释';eg:comment on column new_uesrinfo.remarks is '注释';在plsql上面的运行结果:4.修改表字段名称和表名--给字段改名alter table table_namerename column column_name To new_column_name; --修改表的名字rename table_name to new_table_name;5.删除字段alter table table_namedrop column column_name;6.更改字段长度,类型eg:修改remarks字段修改字段的长度alter table userinfomodify remarks varchar2(150);eg:修改字段类型a.如果表中没有数据alter table 表名 modify(字段名1 类型,字段名2 类型,字段名3 类型.....)b.如果表中有数据(分为四步)--修改原字段名ALTER TABLE 表名 RENAME COLUMN 字段名A TO 字段名B;--添加一个和原字段同名的字段"字段名A",添加的字段ALTER TABLE 表名 ADD 字段名目标类型;--将"字段名B"的数据更新到新建字段"字段名A"中UPDATE 表名 SET 字段名A = TIRM(字段名B);--更新完成后,删除原备份字段"字段名B"ALTER TABLE 表名 DROP COLUMN 字段名Beg:例如将上表的remarks字段修改为number(32,2)alter table userinfo rename column remarks to remarks_tmp;alter table userinfo add remarks number(32,2);update userinfo set remarks = trim(remarks_tmp);alter table userinfo drop column remarks_tmp;7.删除数据,删除表--删除表数据truncate table table_name;delete from table_name这里truncate和delete的区别是,truncate是截断了表,它的效率比delete要快--删除表的结构drop table table_name;。
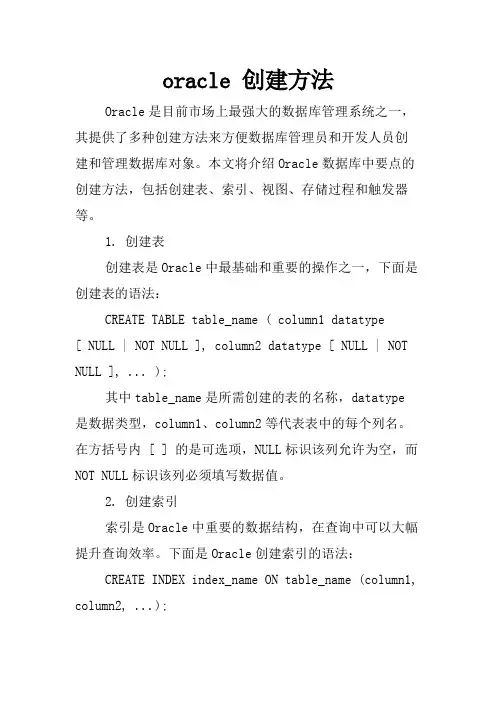
oracle 创建方法Oracle是目前市场上最强大的数据库管理系统之一,其提供了多种创建方法来方便数据库管理员和开发人员创建和管理数据库对象。
本文将介绍Oracle数据库中要点的创建方法,包括创建表、索引、视图、存储过程和触发器等。
1. 创建表创建表是Oracle中最基础和重要的操作之一,下面是创建表的语法:CREATE TABLE table_name ( column1 datatype[ NULL | NOT NULL ], column2 datatype [ NULL | NOT NULL ], ... );其中table_name是所需创建的表的名称,datatype是数据类型,column1、column2等代表表中的每个列名。
在方括号内 [ ] 的是可选项,NULL标识该列允许为空,而NOT NULL标识该列必须填写数据值。
2. 创建索引索引是Oracle中重要的数据结构,在查询中可以大幅提升查询效率。
下面是Oracle创建索引的语法:CREATE INDEX index_name ON table_name (column1, column2, ...);其中index_name是所创建的索引名称,table_name 是索引建立的表名称,(column1, column2, ...)指所索引的列名称,多个列之间用逗号分隔。
3. 创建视图视图是数据库中一种虚拟表格,不是实际存在于数据库中的表,其目的是为了简化数据查询操作,特别是在复杂的查询时。
下面是Oracle创建视图的语法:CREATE VIEW view_name AS SELECT column1, column2, ... FROM table_name WHERE condition;其中view_name是创建的视图名称,SELECT语句是视图显示的列和所需的表名,WHERE语句是视图条件过滤设置。
4. 创建存储过程存储过程是一段提前定义好的SQL语句集合,可重复执行。

报表制作:framework manager:1。
组织元数据2。
设置参数注意:时间参数的格式report studio:1。
表头制作【列表,交叉表】2。
汇总行【列表,交叉表】3。
查询计算-》设置报表日期;截取字符3。
布局计算使用-》取单元格值5。
聚合使用-》单元格使用布局计算后,不能使用汇总,必须用聚合4。
增加列,其单元格值依赖其他字段值。
6。
取单元格的最大值。
1.FrameWork中组织报表所需要的数据FrameWork用来组织报表所需要的元数据。
1.1 新建一个工程并导入原始数据打开Framework,从菜单“File”中选择“new project”,输入工程名字和保存路径:点击“ok“,弹出界面选择”中文“:点击“ok“,选择”data source”:点击“next“,选择我们建立的数据源:点击“next”,这时候要稍微等一会,选择我们要的原始数据表或者视图[本例使用视图]:点击“next”-> “import”->“finish”.目标界面如图:到此,我们已经导入了我们所有需要的原始数据。
1.2 组织元数据举例:设定取数范围。
说明:本小节可以直接跳过而不会影响其他章节阅读。
假设我们报表是要显示视图V_PDT_MERCH_SUM中的一个日期范围的数据。
我们设定两个参数来指定这个起止的日期。
步骤如下:单击包下面的V_PDT_MERCH_SUM,右键中选择“Edit Definition”:选择“filter”页,点击右下角“add”来添加filter:添加一个参数,并添加其表达式。
我们在这里设置一个起始时间参数“startDate”:同理再设置一个结束时间参数“endDate”:点击“ok”返回。
设置参数完毕界面如图:我们可以测试结果数据了:选择“TEST”页,点击“Test Example”如果设置有参数则会有弹出页面要求输入参数值,注意日期输入格式,如图:点击“ok“可以查看结果数据。
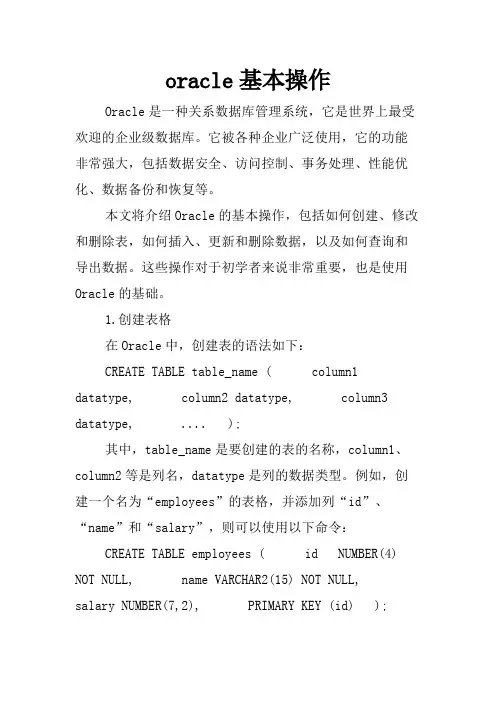
oracle基本操作Oracle是一种关系数据库管理系统,它是世界上最受欢迎的企业级数据库。
它被各种企业广泛使用,它的功能非常强大,包括数据安全、访问控制、事务处理、性能优化、数据备份和恢复等。
本文将介绍Oracle的基本操作,包括如何创建、修改和删除表,如何插入、更新和删除数据,以及如何查询和导出数据。
这些操作对于初学者来说非常重要,也是使用Oracle的基础。
1.创建表格在Oracle中,创建表的语法如下:CREATE TABLE table_name ( column1 datatype, column2 datatype, column3 datatype, .... );其中,table_name是要创建的表的名称,column1、column2等是列名,datatype是列的数据类型。
例如,创建一个名为“employees”的表格,并添加列“id”、“name”和“salary”,则可以使用以下命令:CREATE TABLE employees ( id NUMBER(4) NOT NULL, name VARCHAR2(15) NOT NULL, salary NUMBER(7,2), PRIMARY KEY (id) );注意,id和name列设置为NOT NULL,这表示这两列不能为空。
salary列的数据类型为NUMBER,并设置了精度和小数位数。
2.修改表格如果需要修改表格,可以使用ALTER TABLE命令。
例如,如果想向employees表格添加新的列“address”,可以使用以下命令:ALTER TABLE employees ADD address VARCHAR2(50);如果需要删除表格中的列,可以使用以下命令:ALTER TABLE employees DROP COLUMN address;3.删除表格如果需要删除一个表格,可以使用以下命令:DROP TABLE table_name;例如,删除名为“employees”的表格:DROP TABLE employees;如果不小心使用了错误的命令或者删除的表格不是自己想要的,则可以使用RECOVER命令来找回删除的表格。
Creating a Graph Using the Graph WizardPurposeIn this tutorial, you learn how to create and customize a graph using the Graph Wizard.Time to CompleteApproximately one hourTopicsThis tutorial covers the following topics:OverviewScenarioPrerequisitesDefining the Data ModelCreating a Graph in the Paper Layout ViewCustomizing a GraphGenerating Report Output to a PDF FileSummaryRelated informationViewing ScreenshotsNote: Alternatively, you can place the cursor over each individual icon in the following steps to load andview only the screenshot associated with that step.OverviewYou can add a variety of charts and graphs, including true three-dimensional graphs, to a report using the Graph Wizard.In this tutorial, you will create a report that contains just a graph ? a pictorial representation of data. You will begin by defining the data model for the graph, and then creating the graph in the Paper Layout view of the Report Editor using the Graph Wizard. You will learn how to customize the look and feel of the graph and finally, generate PDF output for your report.ScenarioThe graph that you create in this tutorial displays the average price and quantity for orders that are ready for shipment. The graph is based on the Order Entry data model.PrerequisitesBefore starting this tutorial, you should:1.Have access to or have installed Oracle Reports Developer .2.Have access to or installed the sample schema. This tutorial uses the OE schema included in the Oracle10gdatabase.3.Download reportsOBE.zip and unzip into your working directory.Defining the Data ModelBefore you can create a graph, you need to identify the data that the graph will display. Begin by creating anew report.1.If it is not already open, start Oracle Reports by clicking the Reports Builder icon on your desktop. The welcomescreen displays. Select the option Build a new report manually. Click OK.If Reports Builder is already open, create a new report by selecting File > New > Report from the menu.Select the option Build a new report manually. Click OK.In both cases, the Data Model view of the Report Editor displays.2.The Data Model view is a work area in which you create, define, and modify data model objects to be used in yourreport. Data model objects include queries, groups, columns, parameters, and links. Reports Builder uses the data model to determine what data to retrieve for the report.For this lesson, you will define a SQL query. Locate the SQL Query icon in the tool palette. Select the tool by clicking it, and then click the Data Model canvas. This action invokes the SQL Query Statement dialog box.3.Click Connect to connect to the database.In the Connect dialog box, enter OE for the User Name, OE for the Password, and the name of your database for the Database field.Click Connect.Note: If you were previously working in this Reports Builder session using a different schema, you will have to connect to the OE schema in order to complete this tutorial.4.You can now type in a SQL statement, define a query visually using Query Builder, or import an existing file. For yourconvenience, a SQL query is provided for you. Click Import Query.In the file import dialog box, click Simple_Graph.sql located in the your working directory. Click Open.The contents of the query are pasted into the Query dialog box.This query uses group functions to retrieve the average price and quantity of items in a number of customer orders.Click OK.Note that Reports Builder symbolically represents the query in the Data Model view.Creating a Graph in the Paper Layout ViewNow you will switch to the Paper Layout view of the Report Editor to create the graph. The Paper Layout view is a work area in which you can modify the format of your paper report. The default format for your report is defined by the information you specify in the Report Wizard. You can modify the format by working with layout objects, such as frames, repeating frames, fields, boilerplate, anchors, and graph objects. In this view, objects and their property settings are represented symbolically to highlight their types and relationships.You will add a graph object to the paper layout and use the Graph Wizard to define your graph.1.Locate and click the Paper Layout icon on the toolbar across the top of the Report Editor window.The Paper Layout view of the Report Editor displays.Notice that the view is empty, as you did not use the Report Wizard to create this report.2.Next, you will add a graph to the paper layout.Select Insert > Graph from the Menu. The Welcome page of the Graph Wizard displays.Click Next.3.Choose the type of graph you want to create. The Graph Wizard offers several primary graph types with which torepresent data, such as bar, line, and pie graphs. In addition, the wizard provides special usage graphs that are associated with particular data types or ways to display unique cases of data. These types include scatter, bubble, and stock graphs.For this tutorial, use the default graph type, a Bar graph, to represent your data.Click Next.4. Choose the placement of the graph in your report. Select at the beginning of the report and click Next .5.Now select the category column(s) for the X-axis of your graph. The X-axis is the horizontal axis and can containgroups as well as items.For this tutorial, select ORDER_ID as the X-axis. Use the arrow button [>] to move ORDER_ID to the X-Axis Categories list.Click Next.6.On the next panel of the wizard, you specify options for the data axis of your graph. The Y-axis is the vertical axis andcontains data columns. The data columns must contain numeric data.Select both the AVG_UNIT_PRICE and AVG_QUANTITY columns and move them to the Y-Axis Categories list by using the arrow button [>].Click Next.7.You are now viewing the Layout panel of the Graph Wizard. Here, you can rearrange the data in your graph tocontrol the way the data will be displayed. Ensure that ORDER_ID is in the Groups field. The Groups field specifies the data items for the groups of the graph. On a bar graph, a group is a cluster of bars.Click Next.8.On the Title panel of the wizard, you can specify text and font attributes for the title, subtitle, and footnote of yourgraph.Enter the text string Orders in the Title field for this graph.Include a footnote for your graph by entering the text string Source: Order Company, Inc. in the Footnote field.Click Next to advance to the Legend panel of the Graph Wizard.9.You use the Legend panel to select display options for the legend of your graph. The legend area is a place on thegraph that provides a key to the information that is shown in the graph.For this tutorial, keep the default settings and click Next .10.You can now select options for the X-axis of your graph.Specify a title of Order ID for the X-axis.Select the radio button Show labels for all tick marks on the X-axis.Click Next.11.Similarly, you can specify options for the Y-axis of your graph.Specify a title of Average Price and Quantity for the Y-axis and click Next.12.You can use the Plot Area panel of the Graph Wizard to specify how the plot area of your graph should be displayed.Options include grid lines, line color and style for grid lines, data tables, and data tips. Data tips are tooltips that display when the mouse is moved over a bar, pie slice, and so forth.For this tutorial, keep the default options and click Next.13.The final panel of the Graph Wizard allows you to specify a hyperlink value to enable you to link areas of the graphwith specific destinations. Leave the hyperlink value field blank for this tutorial and click Finish to complete the definition of your graph.Your graph is represented by a graph object in the Paper Layout view of the Report Editor. Using the rulers in the Paper Layout, resize the graph object to an approximate width of 6 inches, and a height of 4 inches. To do this, select one of the object handles and drag it horizontally, or vertically, until the object is sized appropriately.14.View the paper layout of your report by clicking the Run Paper Layout icon on the toolbar, or by selectingProgram > Run Paper Layout from the menu. Your output displays in the Paper Design view of the Report Editor.15. Save your report as OrdersGraph_< your_initials >.jsp.To save a report definition, click the Save icon in the toolbar , or select File > Save from the menu. The first time you save your report definition, the Save dialog box displays, giving you the opportunity to enter a meaningful name for your report.Click Save.Customizing a GraphThe wizards in Reports Builder are reentrant. Once you have defined a graph, you can reenter the GraphWizard to modify the graph settings and customize the graph to your requirements. In this section of thetutorial, you will customize the look and feel of the graph in your Orders Report.1.With your graph displayed in the Paper Design view, right-mouse-click on the graph and select Graph Wizard fromthe menu.2.Notice that each panel in the Graph Wizard is displayed on a tab. This enables you to navigate directly to the panelyou want to modify by simply selecting the corresponding tab, rather than having to click ?Next' to move through each panel in turn.Modify the graph type. Select the Type tab. Note that the Bar type has several subtypes. Select the Dual-Y Bar subtype. In addition, select the 3D effect check box.3.Next, select the Legend tab. Choose a Border color for the legend in your graph.4.Select the Plot Area tab. Eliminate the vertical grid lines in your graph by clearing the Show Vertical Grid linescheck box.5.Choose a color for the horizontal grid lines.6.Optionally, you can modify the color of the bars in the Series field.7.When you are done customizing the Plot Area, click OK .Your customized graph displays in the Paper Design view of the Report Editor.Generating Report Output to a PDF FileReports Builder can generate report output to a PDF file, containing the formatted data and all objects. When you generate your report output to a PDF file, you can distribute the output to any PDF destination, including e-mail, printer, OracleAS Portal, and Web browser.1.Select the report in the Object Navigator.2.Select File > Generate to File > PDF from the menu. Save your report output as OrdersGraph_<your initials>.pdf ,such as OrdersGraph_eg.pdf.SummaryIn this lesson, you've learned how to:Define a data modelCreate and customize a graph using the Graph WizardGenerate report output to a PDF fileRelated InformationTo learn more about Oracle Reports 10g, refer to the additional Reports OBEs.Visit the OTN Web site for technical papers, presentations, frequently asked questions, demonstrations, and more.。
PLSQL报表开发步骤1.PLSQL创建package1.1在PL/SQL Developer中创建一个package。
➢此时会生成一个包头和包体。
➢包头部分定义一个过程:➢包体部分定义具体的格式控制及输出数据。
➢在print函数中进行输出(输出到控制台和报表)。
➢cursor的定义放在包体的最前面。
➢main函数为该函数的入口地址。
入口函数的特点为:前两个的定义必须为errbuf out varchar2,retcode out number,否则报错。
使用errbuf 返回任何错误消息和retcode 返回完成状态。
参数retcode 返回0 表示成功、警告,成功为1 和2 的错误。
在并行程序运行后,并发管理器会将errbuf 和retcode 的内容写入与您的并发请求相关联的日志文件。
➢屏蔽不在包体外调用的函数声明。
➢创建的package可不必上传到应用。
在数据库中编译后即可。
参考文件:plsql形式报表开发及html输出格式.pdf参考代码:Rz_Gl_Period_Charge_Pkg最后.pck(在PLSQL中打开)2.定义并发可执行➢在EBS中注册挂载:登录oracle EBS R12系统。
选择应用开发员--》并发--》可执行。
➢填入如下信息。
3.定义并发程序●应用开发员--》并发--》程序参数设置:Notes:关于值集的定义,参见附件。
Parameter顺序、名称与Procedure 参数一致(Errbuf 与Retcode 不用设定) 4.添加并发程序到请求组4.1 请求组分配给责任,责任分配给用户。
首先要查找职责和请求组➢查找职责:系统管理员》安全性》职责》定义➢查找请求组:如果没有自己的请求组,可以自己新建一个。
切换责任到系统管理员>安全性>责任>请求,系统管理员》安全性》职责》请求查找出请求组后,在上述请求组中加入刚才定义好的并发请求程序。
➢提交请求,查看结果。
oracle 创建表方式Oracle是业界最受欢迎的企业级关系数据库管理系统之一,它提供了多种创建表的方式,本文将从两个方面介绍Oracle创建表的方式:1. 使用SQL语句创建表使用SQL语句创建表是Oracle中最基本和常用的方法。
SQL语句中的CREATE TABLE语句用于在Oracle数据库中创建新表。
这个语句包括表名称、字段名和数据类型的定义,如下所示:CREATE TABLE 表名称 (字段名1 数据类型1,字段名2 数据类型2,...字段名n 数据类型n);例如,创建一个名为employees的表,包含员工ID、姓名、工作位置和工资等字段,可以使用以下SQL语句:CREATE TABLE employees (emp_id INT PRIMARY KEY,emp_name VARCHAR(20) NOT NULL,emp_job VARCHAR(30),emp_sal DECIMAL(8,2) NOT NULL);其中,INT和DECIMAL是数值类型,VARCHAR是字符串类型,NOT NULL表示该字段不能为空,PRIMARY KEY表示该字段是主键。
2. 使用Oracle表设计工具创建表Oracle表设计工具(Oracle SQL Developer Data Modeler)是一个功能强大的可视化设计工具,它提供了直观、可视化的界面来创建表和修改表。
使用该工具创建表需要按照以下步骤进行:(1)打开Oracle SQL Developer Data Modeler。
(2)在“浏览器”面板中右键单击“逻辑模型”文件夹,选择“新建逻辑模型”选项。
(3)在“新建逻辑模型”对话框中,填写逻辑模型名称和描述信息,然后单击“创建”。
(4)在新建的逻辑模型中,右键单击“表”文件夹,并选择“新建表”选项。
(5)在“新建表”对话框中,设置表名称、列名称、数据类型、约束等信息。
(6)单击“确认”按钮创建表。
Oracle财务报表生成器(FSG)使用手册目录译者按 (3)第一部分:报表的组件 (4)第二部分:行集 (5)定义行集 (5)定义行 (6)行: (6)行集帐户分配 (6)行集计算 (7)第三部分:列集 (8)定义列集 (8)建立列集: (8)定义列 (9)列集的帐户分配和计算 (10)列例外 (12)第四部分:行和列的联合和高级选项 (12)显示选项 (12)第五部分:行顺序 (14)定义行顺序 (14)第六部分:内容集 (15)定义内容集 (15)第七部分:显示集 (16)定义显示组 (16)定义显示集 (16)第八部分:定义和运行FSG报表 (18)定义财务报表 (18)控制值 (19)定义报表集 (20)运行FSG 报表 (21)定义临时报表 (22)第九部分:自动复制组件 (22)从其他的数据库传送组件 (23)第十部分:优化FSG报表程序性能 (23)实例 (24)A:行集-显示类型-汇总 (24)B:行顺序-显示类型-汇总2 (25)C:行顺序-显示类型-展开1 (25)D:行顺序-显示类型-展开2 (26)E:行顺序-显示类型-两者都 (26)F:行顺序-父值 (27)G:行顺序-汇总帐户 (27)H:行集-计算 (29)I:列集-数字格式 (30)J:列集-数字格式 (30)K:列集-期间的影响(Period of Interest) (31)L:列集-帐户分配 (31)M:列集-活动 (32)N:列集-例外1 (32)O:列集-例外2 (33)P:显示类型-明细层 (34)Q:行顺序-默认 (35)Q:行顺序-例1 (36)S:行顺序-例2 (37)T:行顺序-例3 (38)U:行顺序-按照列排序 (39)V:行顺序-按照列排序 (40)W:内容集-PE举例 (41)X:内容集-多个范围 (42)Y:内容集-RE和RB (43)Z:内容集-PT的例子 (43)AA:显示集 (44)AB:行百分比 (45)译者按财务报表生成器(FSG) 是Oracle General Ledger 的一个功能强大的报表建立工具。
Power-BI For ORACLE使用说明目录§1ORACLE客户端安装 (4)§2登陆系统 (5)§2.1登陆系统 (5)§2.2修改密码 (6)§3报表开发 (7)§3.1.1创建数据 (7)§3.1.2编辑视图 (10)§3.1.3新建报表 (24)§3.1.4框架说明 (25)§3.1.5基础操作说明 (26)§3.1.6数据集构建器的其他说明 (47)§3.1.7添加公共筛选 (53)§3.1.8浏览报表 (55)§3.1.9添加其他图表对象 (57)§3.1.10数据集可重用性 (58)§3.1.11图表对象类型切换 (60)§3.1.12图表对象属性设置 (62)§3.1.13面板属性 (66)§3.1.14图表对象切换开发者属性 (67)§3.1.15切换主题 (70)§3.1.16主题样式 (70)§3.1.17设定默认钻取 (71)§3.1.18方案管理 (73)§4浏览........................................................................................................................... 错误!未定义书签。
§4.1.1PC端报表浏览 ............................................................................................ 错误!未定义书签。
§4.1.2手机端报表浏览 .......................................................................................... 错误!未定义书签。