2009 Altered microRNA expression following traumatic spinal cord injury
- 格式:pdf
- 大小:1.11 MB
- 文档页数:6
Molecular phylogeny,long-term evolution,and functional divergence of flavin-containing monooxygenasesDa Cheng Hao ÆShi Lin Chen ÆJun Mu ÆPei Gen XiaoReceived:26November 2008/Accepted:23June 2009/Published online:5July 2009ÓSpringer Science+Business Media B.V.2009Abstract Flavin-containing monooxygenases (FMOs)metabolize xenobiotic compounds,many of which are clinically important,as well as endogenous substrates as part of a discrete physiological process.The FMO gene family is conserved and ancient with representatives pres-ent in all phyla so far examined.However,there is a lack of information regarding the long-term evolution and func-tional divergence of these proteins.This study represents the first attempt to characterize the long-term evolution followed by the members of this family.Our analysis shows that there is extensive silent divergence at the nucleotide level suggesting that this family has been sub-ject to strong purifying selection at the protein level.Invertebrate FMOs have a polyphyletic origin.The func-tional divergence of FMOs 1–5started before the split between amphibians and mammals.The vertebrate FMO5is more ancestral than other four FMOs.Moreover,the existence of higher levels of codon bias was detected at the N-terminal ends,which can be ascribed to the critical role played by the FAD binding motif in this region.Finally,critical amino acid residues for FMO functional divergence(type I &II)after gene duplication were detected and characterized.Keywords Flavin-containing monooxygenase ÁMolecular evolution ÁPurifying selection ÁGene duplication ÁFunctional divergence ÁMolecular phylogenyIntroductionFlavin-containing monooxygenase (FMO)oxygenates drugs and xenobiotics containing a ‘‘soft-nucleophile’’,usually nitrogen or sulfur (Cashman and Zhang 2006;Krueger and Williams 2005).FMO,like cytochrome P450(CYP),is a monooxygenase,utilizing the reducing equiva-lents of NADPH to reduce one atom of molecular oxygen to water,while the other atom is used to oxidize the substrate.FMO and CYP also exhibit similar tissue and cellular location,molecular weight,substrate specificity,and exist as multiple enzymes under developmental control.The mam-malian FMO functional gene family is much smaller (five families each with a single member)than CYP.FMO does not require a reductase to transfer electrons from NADPH and the catalytic cycle of the two monooxygenases is remarkably different.Another distinction is the lack of induction of FMOs by xenobiotics.FMOs are as important as CYPs as the major contributor to oxidative xenobiotic metabolism.In addition,FMOs metabolize specific endog-enous substrates as part of a discrete physiological process.FMO and CYP have overlapping substrate specificities,but often yield distinct metabolites with potentially significant toxicological/pharmacological consequences.All five expressed mammalian FMO genes,FMO1to FMO5,exhibit genetic polymorphisms.Electronic supplementary material The online version of this article (doi:10.1007/s10709-009-9382-y )contains supplementary material,which is available to authorized users.D.C.Hao ÁJ.MuLaboratory of Biotechnology,Dalian Jiaotong University,116028Dalian,China D.C.Haoe-mail:hao@D.C.Hao ÁS.L.Chen (&)ÁP.G.XiaoChinese Academy of Medical Sciences,Peking Union Medical College,100193Beijing,China e-mail:slchen@Genetica (2009)137:173–187DOI 10.1007/s10709-009-9382-yEswaramoorthy et al.(2006)analyzed the functional mechanism of FMO from Schizosaccharomyces pombe using the crystal structures of the wild type and protein-cofactor and protein-substrate complexes.FMO(447aa)of S.pombe is composed of two structural domains.Residues 176–291form a small structural domain(insertion domain, ID),with the remainder of the polypeptide chain forming a larger single domain consisting of N-terminal region and C-terminal region.A channel is present between these two domains.A60-residue-long polypeptide chain segment in a predominantly random coil configuration occurs in the interface between the two domains,where it appears to stabilize the overall domain organization.The structure of the wild-type FMO revealed that the prosthetic group FAD is an integral part of the protein.FMO needs NADPH as a cofactor in addition to the prosthetic group for its catalytic activity.It was proposed that FMOs exist in the cell as a complex with a reduced form of the prosthetic group and NADPH cofactor,readying them to act on substrates.The 4a-hydroperoxyflavin form of the prosthetic group repre-sents a transient intermediate of the monooxygenation process.The oxygenated and reduced forms of the pros-thetic group help stabilize interactions with cofactor and substrate alternately to permit continuous enzyme turnover. Moreover,the X-ray structure of a soluble prokaryotic FMO from Methylophaga sp.strain SK1has been solved at 2.6-A˚resolution and is now the protein of known structure with the highest sequence similarity to human FMOs (Alfieri et al.2008).The structure,resembling that of S. pombe FMO,possesses a two-domain architecture,with both FAD and NADP?well defined by the electron density maps.Biochemical analysis shows that the prokaryotic enzyme shares many functional properties with mamma-lian FMOs,including substrate specificity and the ability to stabilize the hydroperoxyflavin intermediate that is crucial in substrate oxygenation.The developmental and tissue-specific expression of FMO enzymes have been previously characterized in a number of animal species,including humans,mice,rats, and rabbits(Hines et al.1994).Zhang and Cashman(2006) used real-time reverse transcription-PCR to systematically quantify the steady-state mRNA levels of FMOs1–5in human tissues.A comparison between fetal liver and adult liver showed that FMO1was the only FMO that was down-regulated;all other FMOs had greater amounts of mRNA in adult liver.FMO5was the most prominent FMO form detected in fetal liver.The FMO5mRNA level was nearly as abundant as FMO3in adult liver.Whereas other FMOs displayed a significant,dominant tissue-specific mRNA profile,FMO4mRNA was observed more broadly at rel-atively comparable levels in liver,kidney,lung,and small intestine.The most studied offive mammalian FMOs is FMO3for which mutant alleles contribute to the human disease known as trimethylaminuria(TMAU).Affected individuals are unable to catalyze the N-oxidation of dietary-derived trimethylamine(TMA),a substrate of FMO3.As a con-sequence of this metabolic deficiency,TMA is excreted in the breath,sweat and urine,imparting a bodily odor rem-iniscent of rottingfish(Mitchell and Smith2001).A similar phenotype exists in cattle,in which a nonsense mutation in the bovine orthologue causes afishy off-flavor in cow’s milk(Lunden et al.2002)and off-flavor in pork is asso-ciated with the FMO3polymorphism(Glenn et al.2007). Honkatukia et al.(2005)reported the mapping of a similar disorder(fishy taint of eggs)and the chicken FMO3gene to chicken chromosome8.The only nonsynonymous muta-tion identified in the chicken FMO3gene(T329S)changes an evolutionarily highly conserved amino acid and is associated with elevated levels of TMA andfishy taint in the egg yolk.These results support the importance of the evolutionarily conserved motif FATGY of the insertion domain which has been speculated to be a substrate rec-ognition pocket of FMOs.Allerston et al.(2007)provided evidence that FMO3has been the subject of balancing selection and identified mutations in the50-flanking region (e.g.,-3,548,-2,650,and-3,549)and the coding region (E158K and E308G of the insertion domain)that are potential targets for selection.Hao et al.(2006)found that sites158and257were in significant linkage disequilibrium in both Han Chinese and African-American populations. Interestingly,combinations of certain polymorphic variants can have a prominent effect on FMO3activity(Park et al. 2002;Lattard et al.2003),and in some cases give rise to mild or transient forms of TMAU(Zschocke et al.1999).Earlier reports of characteristic FMO activities in a range of organisms,including bacteria(Boulton et al. 1974),fungi(Suh et al.1999),protozoa(Agosin and Ankley1987),marine invertebrates(Schlenk and Buhler 1989),insects(Naumann et al.2002),and sharks and tel-eostfish(Schlenk1993),indicated that FMO genes are ancient and conserved.The subsequent completion of various genome projects confirmed such universality with FMO homologs identified in essentially all bacterial,fun-gal,animal and plant genomes.The diversification of FMO proteins during animal evolution must have been deter-mined by the presence of different structural and functional constraints acting on these proteins.In this study we take advantage of the molecular data currently available for FMO proteins of different taxonomic groups to analyze their long-term evolution and functional divergence within a phylogenetic framework.Particular attention was paid to the relative importance of the functional and structural constraints acting at the protein and nucleotide level.Materials and methodsA total of104nucleotide coding sequences belonging to34 different species of metazoans were used in our analyses (supplemental datasets S1and S2).These include11 FMO1,12FMO2,11FMO3,13FMO4,21FMO5,8FMO from other vertebrates,11FMO fromfish,15FMO-like from invertebrates and two FMO from plete sequences retrieved from databases GenBank and Ensembl were subsequently aligned on the basis of their translated amino acid sequences using the CLUSTAL_W and BIO-EDIT programs(Hall1999)with the default parameters. The alignment of the complete set of sequences consisted of1969nucleotide positions(excluding the start and stop codons)corresponding to675amino acid sites.The inde-pendent alignments for each of the seven FMO lineages are available upon request from the corresponding author and in all cases were checked for errors by visual inspection. The distinction between the N-terminal,the insertion domain(ID),and the C-terminal regions of FMO proteins was established on the basis of the tertiary protein structure of S.pombe and the alignment of these sequences with that of the yeast FMO(see Fig.2legends for details).All molecular evolutionary analyses in this work were carried out using the program MEGA4(Tamura et al. 2007).The extent of nucleotide and amino acid divergence between sequences was estimated by means of the uncor-rected differences(p-distance).The best-fit evolutionary model and the gamma shape parameter of among-site rate variation were inferred with ModelTest3.8(Posada2006); the latter was used to calculate the transition/transversion ratio(R).The numbers of synonymous(p S)and nonsyn-onymous(p N)nucleotide differences per site were com-puted using the modified Nei–Gojobori method(Zhang et al.1998),providing R in both cases.Distances were estimated using the pairwise-deletion option(which was also used in the protein phylogenetic tree reconstructions) and standard errors were calculated by the bootstrap method with1,000replicates.The presence and nature of selection was tested in FMO genes by using the codon-based Z-test for selection,establishing the alternative hypothesis as H1:p N=p S and the null hypothesis as H0: p N=p S.The Z-statistic and the probability that the null hypothesis is rejected were obtained,and significance levels were indicated as**P(P\0.001)or***P (P\0.01).The presence of selection in the seven main FMO lin-eages(1–5,fish,and inv)was further studied by testing for deviations from neutrality.The GC content at fourfold degenerate sites was assumed to represent the genomic GC content and was considered as an approximation to the neutral expectation.The influence of selection on certain amino acids was analyzed by determining the correlation between the genomic GC content and the proportion of GC-rich(GAPR)and GC-poor(FYMINK)residues.Under the neutral model,GC-rich and GC-poor amino acids will be positively and negatively correlated with genomic GC content,respectively(Kimura1983).If the frequency of these amino acids is influenced by selection,no correlation between genomic GC content and amino acid frequency would be expected(Rooney2003).Correlations were computed for complete sequences and for discriminating between the N-terminal,ID,and C-terminal segments by using the Spearman rank correlation coefficient.For amino acid sequences,the neighbor-joining(NJ) method(Saitou and Nei1987)was used to reconstruct the phylogenetic trees.The best model JTT?G(gamma shape parameter2.826)was identified by using ProtTest (Abascal et al.2005).To assess that our results were not dependent on this choice,phylogenetic inference analyses were also completed by(1)the reconstruction of a maxi-mum-parsimony(MP)tree(PAUP* 4.0b10;Swofford 2002)using the tree-bisection-reconnection(TBR)branch swapping algorithm with ten replications for the random addition trees option,and(2)the reconstruction of a Bayesian tree(MrBayes3.1.2;Ronquist and Huelsenbeck 2003)with four Markov chain Monte Carlo chains run for one million generations.For nucleotide sequences, Bayesian analysis and maximum likelihood(ML)methods (GARLI;Zwickl2006)were used to infer phylogenetic trees.The best model GTR?I?G was selected by ModelTest3.8.Bayesian probabilities were obtained under this model,with four Markov chain Monte Carlo chains run for four million generations,using random trees as starting point,and sampling every500th generation.To test the reliability of the obtained topologies,the bootstrap proba-bility(BP)and the posterior probability(PP)values were produced for each internal branch,assuming BP C80% and PP C95%as statistically significant.S.pombe FMO (Eswaramoorthy et al.2006)and the FMO from Saccha-romyces cerevisiae(Zhang and Robertus2002)were assigned as outgroups in the reconstructions.The analysis of the nucleotide variation across different FMO coding regions was performed using a sliding-window approach by estimating the total(p)and the synonymous (p S)nucleotide diversity(average number of nucleotide differences per site between two sequences)with a window length of20bp and a step size of5bp(for p)and a window length of10bp and a step size of5bp(for p S).The codon usage bias in FMO genes was estimated as the effective number of codons(ENC)(Wright1990),where the highest value(61)indicates that all synonymous codons are used equally(no bias)and the lowest(20)that only a preferred codon is used in each synonymous class(extreme bias). Both analyses were conducted with the program DnaSP v.4.10(Rozas et al.2003).To better understand the functional evolution of FMO enzymes,we performed functional analyses of the amino acid alignments in the context of the hypothesized phylo-genetic tree using the software DIVERGE2(Gu and Van-der Velden2002;Gu2006).In particular,we focus on(1) Type-I functional divergence,or site-specific rate shifts,as typically exemplified by amino acid residues highly con-served in a subset of homologous genes but highly variable in a different subset of homologous genes,and(2)Type-II functional divergence,or the shift of cluster-specific amino acid properties,as exemplified by a radical shift of amino acid properties between duplicate genes,that is otherwise evolutionarily conserved.We used DIVERGE2to test the null hypothesis of no changes in site-specific and cluster-specific evolutionary rates among FMO subclades and to predict sites in the alignment having altered functional constraints.For type-I functional divergence,DIVERGE2 measures change in site-specific evolutionary rates using the coefficient of evolutionary functional divergence(h k), where h k=0indicates no change and values approaching h k=1reflect increasing functional divergence.For type-II functional divergence,a h II value significantly higher than zero indicates increasing functional divergence.ResultsEvolution of the FMO protein familyA protein phylogeny was reconstructed from104FMO sequences of34species belonging to different metazoan phyla(Fig.1).Thefive FMO types,thefish FMO,and the invertebrate FMO-like type are well defined by the topol-ogy and by the BP and PP values calculated for each internal branch.The different taxonomic groups are also well differentiated with regard to each of the FMO types. While the tree topology shows the presence of a mono-phyletic origin for FMOs1–5and FMOfish proteins,the polyphyletic origin observed for FMOinv is the result of differences between nematodes and insects,giving rise to independent groups in the phylogeny.In particular,two differentiation events(nodes1and10in the tree)occurred that ledfirst to the FMO lineage from insects and subse-quently to the differentiation of the FMO lineage from nematodes.This pattern of differentiation,which was also corroborated by MP and Bayesian analyses,may have important functional implications.The lineages corresponding to FMOs1–5(nodes2and3 in the tree)differentiated later than FMOinv where FMO1 and3(P=0.764±0.047substitutions per site)was the closest of all,followed by FMO3and4(P=0.891±0.054 substitutions per site),and FMO1and4(P=0.901±0.057 substitutions per site).This is most likely the result of the longer time elapsed since the differentiation of FMOinv. This observation is supported by the protein variation observed within lineages(Fig.2),which is in agreement with the temporal differentiation frame of the FMO types. The group corresponding to piscine FMO sequences also shows a monophyletic origin and shares the closest common ancestor with FMOs1–5.After the differentiation of the six vertebrate FMO lin-eages,the early diversification of FMO5,which apparently took place at the same point in mammals and amphibians (node A in the tree),was followed by that of FMOs3and4 (node B)and by FMO2(node C)and FMO1(node D).The differentiation process is also present in invertebrates, which leads to the appearance of the two invertebrate FMO types(insect FMO and nematode FMO).Moreover,some diversification is also present within the invertebrate FMO-like proteins(Fig.1).Nucleotide variation among FMO genesBecause some FMO sequence comparisons between spe-cies was close to or had even reached the saturation level, the nucleotide-based tree was of low reliability and there-fore we focussed on the protein phylogeny(Fig.1).In the tree that is based on the nucleotide differences per site (data not shown),different FMO types intersperse exten-sively with each other,implying that the nature of the nucleotide variation in the different FMO lineages is essentially synonymous.The level of silent variation was very similar forfive of the six vertebrate lineages(FMO1, p S=0.344±0.009;FMO2,p S=0.380±0.010;FMO3, p S=0.407±0.009;FMO4,p S=0.378±0.010;FMO-fish,p S=0.403±0.014,Fig.2)and slightly higher in FMO5(p S=0.522±0.007)and the invertebrate FMO-like genes(p S=0.519±0.012).When comparing these values with the nonsynonymous differences,we found that p S was significantly greater than p N(P\0.001,Z-test of selection,Fig.2)in most comparisons.Although the nucleotide coding sequences of these proteins have diverged extensively through silent substi-tutions,different FMOs from the same species do not necessarily cluster together in the phylogenies on the basis of their protein sequences(Fig.1)and nucleotide substi-tutions(data not shown).In general,the amount of silent variation was relatively high between FMO coding regions. It was noted that genes from the same species are not more closely related to each other than they are to FMO genes belonging to very different species of vertebrates(data not shown).For example,the average synonymous divergence between human FMO1and FMO2genes is0.440±0.031 substitutions/site,which is either higher than or comparable to that observed between human FMO1and any of the other types in either human or any other vertebrates.Fig.1Phylogeneticrelationships among FMO proteins.The reconstruction was carried out by using theJTT?G model and104FMO sequences(see supplemental dataset1).FMO types are indicated on the right near the species names.Numbers for branches indicate BP values of NJ analyses.The differentiation and diversification events are indicated by squares and circles at the nodes in the phylogeny. human:Homo sapiens,chimp: Pan troglodytes,monkey: Macaca mulatta,bushbaby: Otolemur garnettii,opossum: Monodelphis domestica,mouse: Mus musculus,rat:Rattus norvegicus,guinea pig:Cavia porcellus,rabbit:Oryctolagus cuniculus,squirrel: Spermophilus tridecemlineatus, pig:Sus scrofa,cow:Bos taurus,Madagascan hedgehog tenrec:Echinops telfairi, hedgehog:Erinaceus europaeus,platypus: Ornithorhynchus anatinus, zebrafish:Danio rerio,dog: Canis familiaris,fugu:Takifugu rubripes,tetraodon:Tetraodon nigroviridis,medaka:Oryzias latipes,stickleback: Gasterosteus aculeatus, chicken:Gallus gallus,X. tropicalis:Xenopus tropicalis, evis:Xenopus laevis,C. intestinalis:Ciona intestinalis, C.savignyi:Ciona savignyi, fruitfly:Drosophila melanogaster,moth:Tyria jacobaeae,A.aegypti:Aedes aegypti,A.gambiae:Anopheles gambiae,C.elegans: Caenorhabditis elegans,C. briggsae:Caenorhabditis briggsae,S.cerevisiae: Saccharomyces cerevisiae,S. pombe:Schizosaccharomyces pombeBy discriminating between the N-terminal region,ID,and the C terminus,we observed significantly lower amino acid variation to the N-terminal region (Fig.2).Con-versely,nucleotide variation was roughly the same in terms of silent variation in the N-and C-terminal regions of FMOs 1and 2,and was higher in the C-terminal region of FMOs 3–5than in the N-terminal region.In FMOfish and FMOinv,nucleotide variation was higher in the N-terminal region than in the C-terminal region.Nevertheless,the nonsilent variation was significantly lower in N-terminal domains of the proteins:even the FMO-like proteins from invertebrates did not depart from this trend (Fig.2).This suggests the presence of the strongest functional constraints in this region,which in turn is the main target of the purifying selection acting on FMO proteins.The nature of nucleotide variation exhibited by sequen-ces among different species was further analyzed by cal-culating the nucleotide diversity (p )and the synonymous nucleotide diversity (p S )across FMO sequences using a sliding-window approach,as shown in Fig.3.The relative contribution of p S to p in FMOs 1–5is evident,as in most cases the overall amount of nucleotide variation was the result of the underlying synonymous variation.While on average the amount of p S ranged between 0.35and 0.65substitutions per site along the five different types of FMO sequences,a slight increase in the value of p in the case of FMO3and FMO5can be observed at C-terminal regions.This is most likely due to a relaxation of the structural and functional constraints in these regions of the molecules.The values of p and p S appear also to be constrained by the presence of a relatively conserved sequence in the N-terminal region of FMO1(Fig.3a,arrow),the FMO identifying motif FxGxxxHxxxF in the C-terminal region of FMO2(Fig.3b,arrow),and the NADPH binding motif (GxGxxG/A)in the ID of FMO5(Fig.3d,arrow),resulting in reduced nucleotide variation in the segment composing these elements.For FMOinv,a large number of indels made it very difficult to discern between different patterns of variation when comparing the different sequences..,All x -values were substantially \1(Table S1),suggesting a lack of positive selection.Amino acid frequency and nucleotide composition of FMOsThe presence of selection for certain biased amino acids in the FMO lineages was first analyzed by determining the correlation coefficients between GC content andtheFig.2Average numbers of amino acid (p AA )and nucleotide (p NT )differences per site,and average synonymous (p S )and nonsynony-mous (p N )differences per site in the seven FMO lineages,discrim-inating among complete coding regions,N-terminal,ID,and C-terminal domains (within each type,from left to right ).p S [p N in all comparisons except for FMOfish complete (no significant difference),FMOfish C term (no significant difference),FMOinv complete (no significant difference),and FMOinv ID (p S \p N ,P \0.01).Stan-dard errors calculated by the bootstrap method with 1,000replicates are indicated with bars .FMO1[N terminus,nucleotide alignmentposition (nt pos.)1–444;ID,445-1008;C terminus,1,009–1,609],FMO2(N terminus,nt pos.1–444;ID,445-993;C terminus,994–1,615),FMO3(N terminus,nt pos.1–444;ID,445-993;C terminus,994–1,627),FMO4(N terminus,nt pos.1–444;ID,445-996;C terminus,997–1,706),FMO5(N terminus,nt pos.1–453;ID,454-1003;C terminus,1,004–1,637),FMO fish (N terminus,nt pos.1–450;ID,451-1001;C terminus,1,002–1,694),and FMO -like from invertebrates (N terminus,nt pos.1–540;ID,541-1121;C terminus,1,122–2,097)frequency of GC-rich and GC-poor amino acids,shown in Fig.4.In the case of the N-terminal region of FMOs 1,2,4,5,fish,and inv,the frequency of GC-rich GC-poor or that of both amino acids was not correlated with GC content (all P C 0.10).For the ID of FMOs 1,2,3,4,5,and inv,frequencies of GC-rich,that of GC-poor or both amino acids was not correlated with GC content.In con-trast,only in the C-terminal region of FMO3,both the frequencies of GC-rich and that of GC-poor amino acids were not correlated with GC content,while both the fre-quency of GC-rich and that of GC-poor amino acids were significantly correlated with GC content in the case of the same region of FMOs 5and fish (Table 1).For complete FMO molecules,the only case in which a significant cor-relation agreed with the predictions of the neutral model was the negative correlation observed between GC content and the frequency of GC-poor residues of FMOs 2,5,fish,and inv,and the positive correlation between GC content and the frequency of GC-rich residues of FMOs 2,5,fish,and inv (Table 1).FMO codon usage bias and functional divergence The presence of functional constraints at the protein level allows for a large extent of silent variation in nucleotide sequences resulting in a subsequent decrease in codon bias exhibited by FMO genes.As shown in Fig.5,the overall ENC for FMO genes ranges from 52.558±5.084(FMO5)to 55.979±2.802(FMOinv).When discriminating between the different protein domains,the N-terminal region displayed a trend that was slightly more biased than the C-terminal region,with the exception of FMO4.This unexpected observation may be related to the presence of the conserved FAD binding motif (GxGxxG)at the N-ter-minal segments of FMOs which is present in all species examined and has been shown to be critical for their correct structure and catalytic function (Eswaramoorthy et al.2006).The analyses of the codon usage for glycine residue in this motif showed that GGA (35.26%)is the preferred codon,followed by GGG (23.7%),GGC (22.1%),and GGT(18.9%).Fig.3Total (p ,red )and synonymous (p S ,blue )nucleotide diversity (expressed as the average number of nucleotide difference per site)across the coding regions of FMO1(a ),FMO2(b ),FMO3(c ),and FMO5(d ).The diversity values were calculated using a sliding-window approach with a window length of 20bp and a step size of 5bp (for p )and a window length of 10bp and a step size of 5bp (for p S )(Color figure online)In addition to our phylogenetic analyses,we analyzed site-specific (type I)divergence of evolutionary rates to predict sites in the amino acid sequences undergoing divergent functional evolution.These functional analyses were based on pairwise comparisons of seven FMO clades (Fig.1).The coefficients of evolutionary functional diver-gence (h k )for each pairwise comparison are presented in Table S2.The type I functional divergence was significant in all comparisons except between FMO2and FMOfish,FMO2and FMOinv,and FMOfish and FMOinv.There was significant divergence in site-specific evolutionary rates between FMO4and all other FMO clades,especially between FMO4and FMO3(h k =0.522±0.060),and between FMO4and FMO1(h k =0.522±0.065).Site-specific analysis of h k revealed a nonrandom distribution of divergent functional constraints along the FMO alignment (Fig.6a,b).For example,among 550alignment positions of FMOs 3and 4,there are 26amino acid residues corre-sponding to the cut-off value P (S 1|X )[0.80.Among 26critical amino acids,ten are in the N-terminal region,five in the ID,and 11in the C-terminal region.Figure 6b shows the distributions of the number of predicted critical sites in three regions of FMOs among 18pairs of cluster compari-sons.It is interesting that the number of predicted critical amino acid residues of the C-terminal region was generally higher than that of the N-terminal region,and bothregionsFig.4Relationship between GC content of fourfold degenerate sites and the frequencies of GC-rich (GAPR)and GC-poor (FYMINK)amino acid classes in FMO1(a ),FMO3(b ),FMO4(c ),and FMOinv(d ),discriminating between the complete proteins,the N-terminal regions,IDs,and the C-terminal regions。
MicroRNA作用于Oct4和Sox2基因时对于干细胞的调节作用摘要:MicroRNA是一系列高度保守的长度约为22个核苷酸的非编码小分子RNA。
大量研究证实,microRNAs广泛分布于真核生物,其在细胞的分化发育、生长代谢等各种活动中都起着重要的调节作用。
Oct4和Sox2转录因子在启动细胞重编程、维持胚胎干细胞多能性和决定其是否走向分化方面具有关键作用。
MicroRNA可通过与Oct4和Sox2及其基因相互作用,而对干细胞的分化产生调节作用。
关键词:MicroRNA;Oct4;Sox2;干细胞Abstract:MicroRNAs are highly conserved and non-coding small RNAs mainly with 22-nucleotide in length.It has proven that microRNAs are widely expressed in eukaryotes and play an important role in the regulation of cell differentiation and development, growth metabolism, and many other cell activities.Oct4 and Sox2 transcription factors play an essential role in initiating cell reprogramming,maintaining sternness of pluripotent stem cell and deciding whether or not to differentiate.Key words: MicroRNA; Oct4; Sox2; stem cell1 MicroRNA的生成和作用方式Lee等[1]发现在线虫体内存在一种RNA(lin-4),是一种不编码蛋白但可以生成一对小的RNA转录本(后来被命名为microRNAs, miRNAs),每一个转录本能在翻译水平通过抑制一种核蛋白lin-14的表达而调节了线虫的幼虫发育进程。

MicroRNA155通过下调清道夫受体表达抑制巨噬细胞泡沫化形成尚菲;曾德意;杨慧;黄琳燕;刘捷;吕晓飞;关永源;周家国【摘要】[Objective] To study the effect of raicroRNA-155 (miR-155) on macrophagic foam cell formation. [Methods] Realtime RT-PCR was used to test the expression of microRNA-155. Western blot was used to determine the expression of scavenger receptors SR-A and CD36 in THP-1 macrophages. Receptor-specific binding and uptake of Dil-labeled ox-LDL (Dil-oxLDL) were examined by laser scanning confocal microscope. [Results] In THP-1 cells, 80 μg/mL oxidi zed low density lipoprotein (ox-LDL) induced up-regulation of miR-155 in a time-dependent manner. Ad-miR-155 transfection decreased the expression of SR-A and D36, and the uptake and binding of THP-1 cell with Dil-oxLDL. In contrast, miR-155 inhibitor increased the expression of SR-A and CD36, and the uptake and binding of THP-1 cell with Dil-oxLDL. [Conclusion] MicroRNA-155 inhibits macrophagic foam cell formation through decreasing the expression ofSR-A and CD36.%[目的]探讨microRNA- 155( miR- 155)对巨噬细胞泡沫化过程的影响及机制.[方法]实时定量PCR检测miR-155的表达,Western Blot方法检测巨噬细胞A类清道夫受体SR-A和B型清道夫受体CD36的表达,激光共聚焦显微镜观察miR-155对THP-1结合、摄取DiI标记氧化型低密度脂蛋白(DiI-oxLDL)能力的影响.[结果]80 μg/mL的氧化型低密度脂蛋白(ox-LDL)时间依赖性地诱导巨噬细胞miR-155表达上调.过表达miR-155抑制SR-A和CD36的表达,同时巨噬细胞结合、摄取DiI-oxLDL的能力明显降低.而反义-miR-155则明显上调SR-A和CD36的表达,同时巨噬细胞结合、摄取DiI-oxLDL的能力明显增强.[结论]MiR-155通过降低巨噬细胞SR-A和CD36的表达抑制巨噬泡沫细胞的形成.【期刊名称】《中山大学学报(医学科学版)》【年(卷),期】2012(033)002【总页数】7页(P156-162)【关键词】miR-155;动脉粥样硬化;THP-1巨噬细胞;清道夫受体;泡沫化【作者】尚菲;曾德意;杨慧;黄琳燕;刘捷;吕晓飞;关永源;周家国【作者单位】中山大学中山医学院,药理教研室//心脑血管研究中心,广东广州510080;中山大学中山医学院,药理教研室//心脑血管研究中心,广东广州510080;广东省医学科学院//广东省人民医院医学研究中心,广东广州510080;中山大学中山医学院,药理教研室//心脑血管研究中心,广东广州510080;中山大学中山医学院,药理教研室//心脑血管研究中心,广东广州510080;中山大学中山医学院,药理教研室//心脑血管研究中心,广东广州510080;中山大学中山医学院,药理教研室//心脑血管研究中心,广东广州510080;中山大学中山医学院,药理教研室//心脑血管研究中心,广东广州510080【正文语种】中文【中图分类】R966动脉粥样硬化(atherosclerosis,AS)是一种慢性心血管疾病,严重威胁人类健康。

2009年诺贝尔生理学或医学奖研究成果介绍摘要:2009年10月5日瑞典卡罗林斯卡医学院诺贝尔生理学或医学奖评审委员会宣布将本年度诺贝尔生理学或医学奖授予三位美国科学家伊丽莎白·布莱克本(Elizabeth H Blackburn)、卡罗尔·格雷德(Carol W.Greider)和杰克·绍斯塔克(Jack W.Szostak),以表彰他们在上世纪80年代发现了“端粒和端粒酶是如何保护染色体的”。
本文主要介绍端粒和端粒酶是如何保护染色体的。
关键词:端粒,端粒酶,染色体Elizabeth Blackburn教授1948年出生在澳大利亚塔斯马尼亚州霍巴特市,毕业于墨尔本大学,1975年在剑桥大学获博士学位,而后在耶鲁大学做博士后,1990年至今在加州大学任教。
Jack Szostak教授1952年出生在英国伦敦,毕业于加拿大麦吉尔大学,1977年在美国康奈尔大学获博士学位,现供职于哈佛医学院、麻省总医院和霍华休斯医学研究所。
这两位科学家合作证实了真核生物的端粒具有保护染色体末端的作用。
Carol Greider教授1961年出生在美国加州的圣地亚哥,1987年在加州大学Black—burn教授的指导下获博士学位,而后在冷泉港实验室做博士后,1997年至今任教于约翰·霍普金斯大学医学院。
Greider教授与Blackbum教授合作发现了催化延伸端粒结构的端粒酶。
1 端粒能保护染色体末端以下仅以哺乳动物的端粒为例加以介绍。
哺乳动物端粒的重复序列为(TTAGGG/AATCCC),其中G链3’端是一段单链的悬突(overhang),C链5’端以序列(ATC)结束。
电镜观察发现,端粒结构是一个双环结构,称为T环(T—loop),3’端的悬突替代G链的一段序列与C链配对,形成D环(D-loop),T环的形成使得染色体的末端被包裹保护起来而免遭破坏。
哺乳动物的端粒与一个6种蛋白构成的复合物shelterin结合,这6种蛋白分别为TRFl、TRF2、POTl、TIN2、Rapl和TPPl。
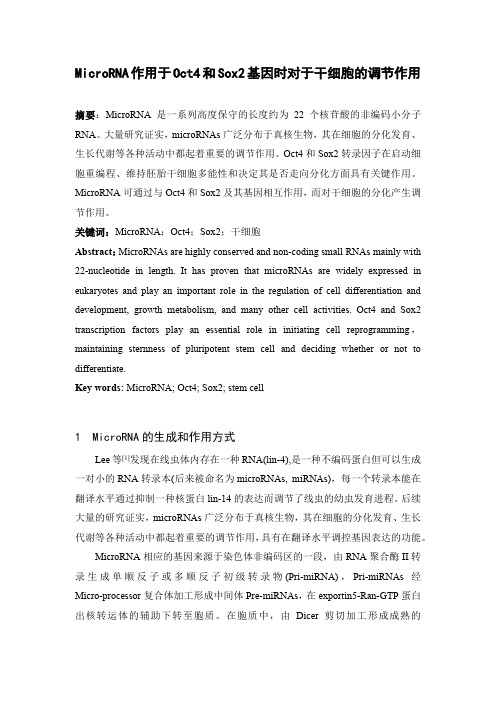
中国科学: 生命科学2010年 第40卷 第6期: 476 ~ 483 SCIENTIA SINICA Vitae 英文版见: Luo J, Teng M, Fan J M, et al. Marek’s disease virus (MDV)-encoded microRNAs: genomics, expression, and function. Sci China Life Sci, 2010, 53, inpress《中国科学》杂志社SCIENCE CHINA PRESS评 述马立克氏病病毒编码的microRNA: 从基因组学到功能研究罗俊①, 滕蔓①, 樊剑鸣①②, 王方雨①, 周玲①, 邓瑞广①, 张改平①*① 河南省农业科学院, 农业部动物免疫学重点开放实验室, 河南省动物免疫学重点实验室, 郑州 450002; ② 郑州大学公共卫生学院毒理学教研室, 郑州 450001 * 联系人, E-mail: zhanggaiping2003@收稿日期: 2009-04-17; 接受日期: 2009-09-14国家重点基础研究发展计划(批准号: 2005CB523200)、国家自然科学基金重点项目(批准号: 30730068)和国家科技支撑计划(批准号: 2006BAD06A04-6)资助摘要 microRNA 在多种生物学过程中发挥重要的基因转录后调控功能. 近期发现, 疱疹病毒也编码大量的miRNA. 对包括马立克氏病病毒在内的疱疹病毒编码miRNA 的初步研究表明, 它们可能在病毒复制、潜伏感染、细胞转化及肿瘤发生发展中发挥重要调控作用. MDV 是疱疹病毒甲亚科的重要成员, 其感染自然宿主鸡后可诱发典型的马立克氏病, 该病可用抗病毒疫苗有效预防, 这是目前已知肿瘤病中第一个可用疫苗预防的病毒性肿瘤病. 因此, MDV 感染对于研究miRNA 调控肿瘤发生和发展的生物学、遗传学及免疫学等都提供了极好的动物模型. 本文综述了MDV 编码miRNA 的发现与鉴定、基因组结构、表达谱及功能研究的进展, 并探讨了今后深入研究其生物学功能的技术及前景.关键词miRNA MDV 疱疹病毒 肿瘤肿瘤发生机制microRNA(miRNA)是一类长度介于22~25 nt 的非编码小分子RNA, 在细胞发育与分化、细胞凋亡、肿瘤发生等许多生物学过程中发挥重要的转录后基因调控功能[1,2]. 1993年, Lee 等人[3]和Wightman 等人[4]在秀丽隐杆线虫(Caenorhabditis elegans )中首次发现lin-4, 一个长度为22 nt 的RNA 小分子能够时序性调控其细胞发育过程, 这是人类发现的第一个miRNA 分子. 此后, 数以万计的miRNA 分子在包括人类在内的所有已研究过的动物、植物和部分病毒基因组中得以发现和鉴定[5]. 在最近的10年中, 对miRNA 的研究取得了巨大进展. 令人吃惊的是, 在已发现的700多种人类miRNA 中, 很多分子可能在多种疾病尤其是肿瘤发生过程中发挥重要调控功能. 有些miRNA 被鉴定为原癌基因, 另一些则可能是抑癌基因[6,7]. 深入研究这些miRNA 的功能, 已成为21世纪生命科学研究领域最前沿的热点之一, 它对于揭示生命科学本质、了解肿瘤发生等人类疾病的发生发展过程及生物治疗等均具有重要的理论和现实意义.1 多种疱疹病毒编码miRNA最新研究发现, 部分病毒基因组中也编码数量不等的miRNA, 这些病毒大多属于疱疹病毒属的成员, 也有一些属于多瘤病毒属和逆转录病毒属[5,8]. 疱中国科学: 生命科学 2010年 第40卷 第6期477疹病毒是一大类直径较大、有囊膜的双链DNA 病毒, 其基因组DNA 长度一般介于120~240 kb. 根据宿主和组织特异性及病毒复制特性, 疱疹病毒可分为甲、 乙、丙3个亚科. 至今, 在疱疹病毒基因组中发现的miRNA 基因已多达140余种[9], 其中从非洲淋巴瘤病毒(Epstein-Barr virus, EBV)、卡波济肉瘤相关疱疹病毒(Kaposi’s sarcoma herpesvirus, KSHV)、鼠γ疱疹病毒68(murine herpesvirus 68, MHV68)、人巨细胞病毒(human cytomegalovirus, HCMV)、单纯疱疹病毒(herpes simplex virus, HSV)、马立克氏病病毒(Marek’s disease virus, MDV)、火鸡疱疹病毒(herpesvirus of turkeys, HVT)及禽传染性喉气管炎病毒(infectious laryngotracheitis virus, ILTV)中分别发现了25, 13, 9, 9, 11, 32, 19和7个miRNA 基因, 这些miRNA 中的绝大部分分子已得到鉴定. 利用生物信息学方法, 少数病毒自身编码的基因和很多宿主基因如细胞因子、趋化因子、细胞凋亡因子、生长因子及信号传导因子等被预测为病毒miRNA 的靶分子. 然而与真核生物相似, 由于miRNA 靶基因筛选验证和信号通路研究的复杂性, 绝大多数病毒miRNA 的功能目前尚不清楚.2 MDV 及其编码的miRNAMDV 在分类上归属于甲亚科疱疹病毒, 病毒基因组全长约180 kb [10]. 与EB 病毒相似, MDV 是少数几种疱疹病毒在其自然宿主中可诱导产生肿瘤的一种肿瘤性病毒. MDV 感染其自然宿主鸡诱发马立克氏病(Marek’s disease, MD), 以淋巴组织增生和肿瘤形成为主要特征, 1907年匈牙利人Marek [11]首次报道该病. 此后研究发现, MDV 共有3种血清型: 血清Ⅰ型(MDV-1)、Ⅱ型(MDV-2)和Ⅲ型(MDV-3)[10]. 血清Ⅰ型MDV 包括对宿主具有毒力或致瘤性的强毒分离株及它们的致弱变异株, 血清Ⅱ型MDV 包括能产生小型蚀斑但无致病性的毒株, 血清Ⅲ型MDV 则包括无致病力的HVT 及其变异株. 根据致病性的不同, 血清Ⅰ型野毒分离株又可以分为温和MDV(mild MDV, m MDV)、强毒MDV(virulent MDV, v MDV)、超强毒MDV(very virulent MDV , vv MDV)及超超强毒MDV(very virulent plus MDV, vv+ MDV). 与其他致瘤性疱疹病毒一样, MDV 入侵宿主后可建立和保持终身性潜伏感染, 最终导致淋巴细胞转化诱发肿瘤. 一直以来, 生物学家们一直致力于MDV 致瘤的分子机制研究, 并且发现在血清Ⅰ型MDV 编码的近百种病毒基因中, Meq 基因可能是MDV 致瘤的主要致癌基因[12,13], 而其他的一些基因, 如pp38, vIL-8, ICP4相关转录物及病毒编码的端粒酶RNA 等也可能在MDV 潜伏感染及肿瘤发生中发挥重要作用.令人意外的是, 随着对miRNA 研究的深入, 最新发现在MDV 基因组中也存在着大量miRNA 的表达[14~18]. 最近几年, 利用构建cDNA 文库及传统的克隆测序方法、或者最新的454高通量基因组测序技术, 有学者先后从MDV-1超强毒株RB1B 感染的鸡胚成纤维细胞(chicken embryo fibroblasts cells, CEFs)和MDV-1诱导的T 淋巴肿瘤细胞系MSB-1中发现了14个血清Ⅰ型MDV miRNA 基因(共计编码22种MDV- 1-miRNA)和18个血清Ⅱ型MDV miRNA 基因(共计编码36种MDV-2-miRNA)[14~17], 从血清Ⅲ型MDV 毒株HVT 感染的CEFs 中发现了18个火鸡疱疹病毒miRNA 基因(共计编码29种HVT-miRNA)[17,18]. 在3种不同血清型的MDV 基因组中, 目前已发现了近百种禽类疱疹病毒miRNA, 初步研究发现血清Ⅰ型MDV 编码的一些 miRNA 可能参与调控病毒的致病和致瘤过程[19,20], 这为研究疱疹病毒的分子致病机制和肿瘤发生机制提供了全新的研究课题.3 MDV-miRNA 的基因组结构MDV 基因组为线性双股DNA, 全基因组主要由一个长独特序列区(unique long, U L )和一个短独特序列区(unique short, U S )构成, 在两个独特序列区两侧分别是两个序列完全相同的反转重复序列区, 长末端重复序列(terminal repeat long, TR L )和长内部重复序列(internal repeat long, IR L )或是短末端重复序列(terminal repeat short, TR S )和短内部重复序列(terminal repeat short, IR S )[21], 独特序列区中编码的病毒基因与其他疱疹病毒具有高度保守性, 而MDV 特异性的病毒基因则主要位于反转重复序列区TR/IR 中[22]. 研究发现, 尽管3种不同血清型MDV 编码的miRNA 在基因序列上没有同源性, 但它们的基因座位在病毒基因组中具有高度保守性, 并形成典型的miRNA 基因簇(图1)[14~18].血清Ⅰ型MDV 编码的14个miRNA 基因全部位于病毒基因组的反转重复序列区中, 并形成3个明显的miRNA 基因簇[14,16]. MDV1-miR-M2, MDV1-miR-罗俊等: 马立克氏病病毒编码的microRNA: 从基因组学到功能研究478M3, MDV1-miR-M4, MDV1-miR-M5, MDV1-miR- M9和MDV1-miR-M12组成第一个基因簇, 这些miRNA 位于TR L /IR L 重复序列区中、紧邻Meq 基因上游、与R-LORF8转录物反向, 且miRNA 前体之间间距很短(少则数10个、最多不超过220 nt), 因此该基因簇被命名为Meq-cluster. MDV1-miR-M6, MDV1- miR-M7, MDV1-miR-M8, MDV1-miR-M10和MDV1- miR-M13组成第2个基因簇, 这些miRNA 主要位于IR S /TR S 重复序列与病毒潜伏感染相关基因转录物(latency-associated transcript, LAT)的内含子中, 它们的前体分子紧密相联甚至相互交错, 因此被命名为LAT-cluster. 另外3个miRNA 分子MDV1-miR-M1, MDV1-miR-M11和MDV1-miR-M32位于L1/LORF5a 可读框中, 这几个miRNA 的分子间距介于200~300 nt 之间, 且位于Meq-cluster 和LAT-cluster 中间, 或许可因此将其命名为Middle-cluster(Mid-cluster).与血清Ⅰ型miRNA 相比, 血清Ⅱ型MDV 编码的绝大部分miRNA(包括miR-1~miR-16, 共计16个前体分子)都位于TR L /IR L 重复序列一段长约4.2 kb 的区域中, 聚集形成一个较大的基因簇, 而MDV2-miR- 17则单独位于IR S /TR S 重复序列中ICP4的ORF 中, 但转录方向正好与之相反[15,17]. 有趣的是, HVT(血清Ⅲ型MDV)编码的miRNA 的基因组织形式与血清Ⅱ型miRNA 非常相似, 几乎全部位于TR L /IR L 重复序图1 MDV 编码的病毒miRNA 的基因组结构绿色、蓝色和棕色发夹分别示MDV-1, MDV-2和HVT 编码的病毒miRNA 前体; 虚线示其在基因组中的相对位置中国科学: 生命科学 2010年 第40卷 第6期479列区中, 形成一个明显的miRNA 基因簇[17,18]. 仔细分析不同血清型MDV 编码的miRNA, 可以发现它们中的绝大部分都位于禽类疱疹病毒基因组中与病毒进化密切相关的反转重复序列区域中, 表明它们在MDV 的致病和致瘤中可能具有重要的调控作用.4 MDV-miRNA 的表达经克隆测序发现的MDV 编码的miRNA 中, 绝大部分分子已利用Northern blot 分析得以被证实. 仔细分析MDV-1, MDV-2及HVT 编码的病毒miRNA 发现, 它们最大的共同点就是绝大部分成员在病毒基因组的反转重复序列区中聚集形成基因簇, 因此推测它们很可能是由不同病毒基因组中同一启动子起始转录产生一个长的初级转录本(primary miRNA, pri-miRNA), 然后剪切加工产生miRNA 成熟体[14~18]. 这一推测在MDV-1编码的miRNA 中已得到证实, 利用RT-PCR 技术, 已经检测到一个同时转录Meq- cluster 内编码的全部miRNA 的转录本[14]. 理论上讲, 同一转录本剪切加工成熟的miRNA 似乎应该具有较一致的表达水平, 然而克隆测序及Northern blot 结果表明, 这些miRNA 的表达水平存在很大差异, 这可能是由于它们在加工成熟、miRNA 稳定性及生物学功能等方面的差异所致.由于血清Ⅰ型MDV 具有高致病性及致瘤性, 研究MDV-1编码miRNA 的表达情况对进一步深入研究其功能具有重要的参考意义. 此前研究表明, 首批发现的MDV-1 miRNA 在vv MDV 毒株RB1B 感染的CEF 细胞中, MDV1-miR-M4-5p 和MDV1-miR-M8-3p 表达量最高, 其次为MDV1-miR-M6-3p, MDV1- miR-M3-5p, MDV1-miR-M2-5p, MDV1-miR-M1-5p 和MDV1-miR-M5-3p, 而MDV1-miR-M7-3p 表达量最低(表1). 但在RB1B 诱发的脾脏肿瘤中, 除MDV1- miR-M7-3p 未检测到表达外, 其他不同miRNA 分子表1 Northern blot 分析MDV-1编码的miRNA 在体内相对表达水平不同毒株MDV 诱导脾脏肿瘤中miRNA 的相对表达水平 编号 miRNA 名称所属基因簇GX0101 RB1B [16] RB1B [14] RB1B [23] 615K [23] 1 MDV1-miR-M2-5p Meq 高 较高 较高 较高 高 2 MDV1-miR-M2-3p Meq 高 较高 低 低 较高 3 MDV1-miR-M3-5p Meq 高 高 较高 较高 高 4 MDV1-miR-M4-5p Meq 高 高 较高 较高 高 5 MDV1-miR-M4-3p Meq 无表达 低 低 未测 未测 6 MDV1-miR-M5-5p Meq 无表达 低 未测 未测 未测 7 MDV1-miR-M5-3p Meq 无表达 高 较高 较高 较高 8 MDV1-miR-M9-5p Meq 较高 高 未测 未测 未测 9 MDV1-miR-M9-3p Meq 无表达 低 未测 未测 未测 10 MDV1-miR-M12-3p Meq较高 高 未测 高 高 11 MDV1-miR-M1-5p Mid 低 未测 低 高 高 12 MDV1-miR-M1-3pMid无表达 低 未测 未测 未测 13 MDV1-miR-M11-5p Mid 无表达 低 未测 未测 未测 14 MDV1-miR-M11-3p Mid 无表达 低 未测 未测 未测 15 MDV1-miR-M32-3p Mid 低 未测 未测 未测 未测 16 MDV1-miR-M6-5p LAT 低 高 未测 较高 较高 17 MDV1-miR-M6-3p LAT 无表达 未测 低 低 低 18 MDV1-miR-M7-5pLAT 高 高 未测 较高 较高 19 MDV1-miR-M8-5p LAT 无表达 较高 未测 较高 较高 20 MDV1-miR-M8-3p LAT 高 未测 高 高 高 21 MDV1-miR-M10-3LAT较高 低 未测 未测 未测 22 MDV1-miR-M13-3p LAT无表达低未测未测未测罗俊等: 马立克氏病病毒编码的microRNA: 从基因组学到功能研究480之间的相对表达水平虽然与CEF 感染细胞基本一致,但它们在脾脏肿瘤组织中的整体表达水平则明显高于CEF 感染细胞[14]. 此后, 对MDV-1编码的21种miRNA 在RB1B 同批感染的CEF 细胞及诱发的脾脏肿瘤及肿瘤细胞系MSB-1中的表达进行分析, 也发现了类似现象[16], 这很可能与MDV-1在CEF 细胞和肿瘤细胞内的适应能力、复制速度以及病毒量差异有关. 分析20多种具有不同毒力的MDV-1毒株基因组, 发现MDV-1编码的同一miRNA 分子在基因序列上具有高度保守性. 然而令人意外的是, 位于Meq-cluster 内的MDV1-miR-M2-5p, MDV1-miR-M2-3p, MDV1- miR-M3-5p, MDV1-miR-M4-5p, MDV1-miR-M5-3p 及MDV1-miR-M12-3p 在vv+ MDV 毒株615K 诱导的脾脏肿瘤中的表达量要高于vv MDV 毒株RB1B 诱导的脾脏肿瘤数倍, 但位于LAT-cluster 内的miRNA 的表达水平则未发现明显差异[23](表1). 目前尚不清楚这些miRNA 是否与MDV 的复制或毒力有关, 但似乎表明Meq-cluster 内编码的miRNA 可能在MDV 的致病机制方面具有更重要的作用.最近, 对MDV-1强毒株GX0101编码的miRNA 在宿主体内的动态表达谱进行了系统研究, 结果发现MDV-1 miRNA 的表达在病毒感染全程中具有明显的时序性和组织差异性(结果未发表). 根据这些miRNA 在MDV 感染不同阶段的表达谱, 将22种MDV-1 miRNA 中的12种稳定表达的成熟体miRNA 归类为感染早期表达的miRNA(early-expressed miRNAs, 包括MDV1-miR-M1-5p, MDV1-miR-M3-5p, MDV1- miR-M4-5p, MDV1-miR-M7-5p, MDV1-miR-M8-3p 和MDV1-miR-M12-3p)或感染晚期表达的miRNA(late-expressed miRNAs, 包括MDV1-miR-M2-5p, MDV1- miR-M2-3p, MDV1-miR-M6-5p, MDV1-miR-M9-5p, MDV1-miR-M10-3p 和MDV1-miR-M32-3p); 另外5种miRNA(包括MDV1-miR-M1-3p, MDV1-miR-M4- 3p, MDV1-miR-M6-3p, MDV1-miR-M8-5p 和MDV1- miR-M9-3p)被鉴定为miRNA 成熟体的星号序列; 其余的5种miRNA(包括MDV1-miR-M5-5p, MDV1- miR-M5-3p, MDV1-miR-M11-5p, MDV1-miR-M11-3p 和MDV1-miR-M13-3p)在体内虽然检测到前体表达, 但均未检测到成熟体表达(图2). 虽然大部分MDV-1 miRNA 在体内的表达与此前在CEF 感染细胞或MSB-1细胞系中的研究结果基本相似, 但新鉴定的miRNA 星号序列, MDV1-miR-M5-5p, MDV1-miR- M5-3p, MDV1-miR-M11-5p, MDV1-miR-M11-3p 和MDV1-miR-M13-3p 在体内的表达则具有显著差异. 此外, 感染早期表达的miRNA 在MDV 感染后18和36天均具有明显的脾脏和肺脏特异性表达特征, 但在感染后90天肉眼肿瘤发生期, 虽然没有观察到miRNA 的肿瘤特异性表达但却存在着明显的组织差异性, 其中以脾脏、肺脏或胸腺中的表达量最高. 与早期表达miRNA 相比, 晚期表达miRNA 虽然只在肉眼肿瘤发生期表达, 但它们在不同组织脏器中的表达差异性更显著, 这意味着两类不同表达模式的miRNA 在MDV-1的入侵、复制、潜伏、诱导肿瘤发生及肿瘤转移中可能具有不同的调控作用.5 MDV-miRNA 的功能在病毒潜伏感染阶段及肿瘤发生细胞中, MDV图2 MDV-1编码的miRNA 体内表达模式图miRNA 前体发夹结构中, 红色、蓝色和灰色分别示稳定表达的miRNA 成熟体、miRNA 星号序列及未加工成熟的miRNA中国科学: 生命科学 2010年 第40卷 第6期481编码的绝大部分基因是不转录的, 但与病毒进化密切相关的反转重复序列区域却处于激活状态[24~26]. 血清Ⅰ型MDV 编码的绝大部分miRNA 位于病毒基因组的反转重复序列区域中, 而且在病毒诱发的宿主肿瘤及肿瘤细胞系中的表达量远高于CEF 感染细胞, 这表明这些miRNA 中的全部或部分分子可能在病毒诱导的肿瘤发生中发挥重要调控功能. 为了进一步研究MDV 编码的全部miRNA 分子的功能, 已经建立了MDV 病毒基因cDNA 序列及宿主基因3′端非编码序列数据库, 并利用相关生物学软件对部分MDV-1 miRNA 潜在的靶基因进行了预测[23]. 然而, 由于miRNA 靶分子预测及鉴定的困难性, 绝大部分MDV-1 miRNA 的调控功能尚不清楚.有研究认为, 或许Meq-cluster 内编码的miRNA 在MDV 致病性方面具有更重要的调控作用, 因为该基因簇的绝大部分miRNA 在毒力更强的MDV 毒株诱导的肿瘤中表达量更高[23]. 事实上, 位于同一基因簇内的miRNA 尽管由同一初级转录本剪切加工而成, 但它们的表达丰度却存在着显著差异[16], 因此它们的功能可能要比想象的更加复杂. 在所有已研究过的肿瘤细胞系及实质肿瘤中, MDV1-miR-M4-5p 是表达量最高的MDV-1 miRNA 之一. 最近研究证实, MDV1-miR-M4-5p 是miR-155的同功分子, 调控淋巴细胞特异性转录因子Pu.1的表达[19], 可能在恶性淋巴瘤发生及免疫调节方面具有重要作用. 体内动态表达谱表明, 除了MDV1-miR-M4-5p 在感染早期(18 dpi)即开始大量表达外, MDV1-miR-M3-5p, MDV1- miR-M12-3p 以及位于LAT-cluster 中的MDV1-miR- M7-5p 和MDV1-miR-M8-3p 都具有相似的表达规律, 并且表达量更高, 它们是否与MDV1-miR-M4-5p 具有相似的功能尚不清楚. 而其他一些晚期表达的miRNA(如MDV1-miR-M2-5p, MDV1-miR-M2-3p, MDV1-miR-M6-5p, MDV1-miR-M9-5p, MDV1-miR- M10-3p 及MDV1-miR-M32-3p)与早期表达的miRNA 具有明显不同的表达时序性, 因此基本可以排除同一基因簇内编码的miRNA 具有相似功能的可能性.作为Mid-cluster 中的一员, MDV1-miR-M1-5p 位于MDV L1/RLORF5a 的可读框中, 而且其表达与L1/RLORF5a 相似, 因此MDV1-miR-M1-5p 很有可能是该转录物剪切加工而成. 但值得注意的是敲除L1/RLORF5a 并不影响病毒的复制、潜伏感染及致瘤性[27,28], 因此有学者认为, MDV1-miR-M1-5p 可能不是上述这些功能所必需的[14]. 对MDV1-miR-M1-5p 在体内的动态表达分析亦显示, 尽管在感染后30天即可检测到低水平表达, 但在整个致病及致瘤过程中它是早期表达miRNA 中表达水平最低的. 先前发现, 在肿瘤细胞系MSB-1中, MDV1-miR-M11表达量极低, 而本研究组在宿主体内却没有检测到成熟体的动态表达, 表明它可能并不具备重要的生物学功能. 有意思的是, 作为Mid-cluster 的另一个成员, 体内表达谱发现MDV1-miR-M32-3p 只在肿瘤发生期表达, 其表达量与MDV1-miR-M1-5p 相当, 且是晚期表达miRNA 中表达丰度最低的一个. 利用生物信息学分析发现, MDV1-miR-M32-3p 与宿主miRNA miR- 221可能具有保守的功能, 调控宿主蛋白p27Kip1的表达[23], 该蛋白是细胞周期的关键抑制因子, 该蛋白的下调表达可促进肿瘤细胞的生长及增殖[29,30].LAT-cluster 内编码的MDV-1 miRNA 可能由一个长约10 kb, 与病毒潜伏感染相关转录物转录加工成熟, 这些转录物在病毒潜伏感染的后期[31]、肿瘤转化细胞系及实体肿瘤内大量表达[32,33]. 从转录方向看, 该基因簇的miRNA 可能是MDV ICP4的反义RNA [23], 由于ICP4转录本尚未测通, 这些miRNA 是否调控该基因的蛋白表达尚难以确定. 此外, 体内动态表达谱显示该基因簇内miRNA 的表达也存在显著差异, 其中MDV1-miR-M7-5p 和MDV1-miR-M8-3p 表达丰度最高, 在感染后30天即可检测到大量表达, 而其他一些分子如MDV1-miR-M6-5p 和MDV1-miR- M10-3p 只能在肿瘤发生阶段检测到较低水平的表达, 它们在融细胞性感染、潜伏感染及诱发肿瘤过程中是否具有不同的功能仍需进一步研究.6 展望作为疱疹病毒甲亚科的重要成员, MDV 感染可以诱发其自然宿主产生肿瘤, 并且肿瘤的发生可以用HVT 或致弱的、非致病性的MDV-1毒株制备疫苗进行有效的免疫预防, 这是世界上首个用疫苗来预防致瘤性病毒引发癌症的成功例子. 因此, MDV 感染对于研究肿瘤发生和发展的生物学、遗传学及免疫学等都提供了极佳的动物模型[22]. 尽管已发现大量的疱疹病毒miRNA 在融细胞性复制、潜伏感染、以及肿瘤发生中表达, 但只有极少数的一些分子的靶基因得以被确定, 研究它们的生物学功能仍极其艰罗俊等: 马立克氏病病毒编码的microRNA: 从基因组学到功能研究482巨[9]. 然而, 目前miRNA 靶基因预测、筛选及鉴定技术已日趋成熟, 对部分MDV-1病毒miRNA 的靶基因也已进行了预测()[23], 尤其是细菌人工染色体技术(bacterial artificial chromo- some, BAC)及Rec E/T 同源重组技术在研究疱疹病毒基因功能方面的成功应用, 或许为揭示MDV miRNA 的功能提供了可能. 利用细菌人工染色体技术, 多个MDV 毒株如RB1B, CVI988, HVT, GX0101等已被成功拯救成传染性克隆, 并在MDV 疫苗及分子致病机制研究中发挥了重要作用[34~37]. 在MDV 传染性BAC 克隆的基础上, 利用Rec E/T 同源重组技术构建miRNA 单基因或单基因簇敲除的毒株, 可为进一步研究miRNA 基因缺失对MDV 的复制、致病性、致瘤性等致病表型的影响及其分子调控机制奠定良好的基础. MDV miRNA 调控功能的阐明, 将可能为人们最终了解肿瘤的发生发展机制提供重要线索.参考文献1 Bartel D P. MicroRNAs: genomics, biogenesis, mechanism, and function. Cell, 2004, 116: 281—2972 Filipowicz W, Bhattacharyya S N, Sonenberg N. Mechanisms of post-transcriptional regulation by microRNAs: are the answers in sight?Nat Rev Genet, 2008, 9: 102—1143 Lee R C, Feinbaum R L, Ambros V. The C. elegans heterochronic gene lin-4 encodes small RNAs with antisense complementarity to lin-14.Cell, 1993, 75: 843—8544 Wightman B, Ha I, Ruvkun G, et al. Posttranscriptional regulation of the heterochronic gene lin-14 by lin-4 mediates temporal patternformation in C. elegans . Cell, 1993, 75: 855—8625 Grif fiths-Jones S. The microRNA Registry. Nucl Acids Res, 2004, 32: D109—D1116 Fabbri M, Garzon R, Andreeff M, et al. MicroRNAs and noncoding RNAs in hematological malignancies: molecular, clinical andtherapeutic implications. Leukemia, 2008, 22: 1095—11057 Lee Y S, Dutta A. MicroRNAs in cancer. Annu Rev Pathol, 2009, 4: 199—227 8 Sullivan C S, Ganem D. MicroRNAs and viral infection. Mol Cell, 2005, 20: 3—79 Boss I W, Plaisance K B, Renne R. Role of virus-encoded microRNAs in herpesvirus biology. Trends Microbiol, 2009, 17: 544—553 10 Witter R L, Schat K. Marek’s Disease. In: Saif Y M, ed. Diseases of Poultry, 11th ed. Ames: Iowa State University Press, 2003. 407—464 11 Marek J. Multiple Nervenentzuendung (polyneuritis) bei Huehnern. Dtsch Tierarztl Wochenschr, 1907, 15: 417—42112 Lupiani B, Lee L F, Cui X, et al. Marek’s disease virus-encoded Meq gene is involved in transformation of lymphocytes but is dispensablefor replication. Proc Natl Acad Sci USA, 2004, 101: 11815—1182013 Nair V, Kung H J. Marek’s disease virus oncogenicity: molecular mechanisms. In: Davison F N, ed. Marek’s Disease, an Evolving Problem.Oxford: Elsevier Academic Press, 2004. 32—4814 Burnside J, Bernberg E, Anderson A, et al. Marek’s disease virus encodes microRNAs that map to meq and the latency-associated transcript.J Virol, 2006, 80: 8778—878615 Yao Y, Zhao Y, Xu H, et al. Marek’s disease virus type 2 (MDV-2)-encoded microRNAs show no sequence conservation with those encodedby MDV-1. J Virol, 2007, 81: 7164—717016 Yao Y, Zhao Y, Xu H, et al. MicroRNA profile of Marek's disease virus-transformed T-cell line MSB-1: predominance of virus-encodedmicroRNAs. J Virol, 2008, 82: 4007—401517 Waidner L A, Morgan R W, Anderson A S, et al. MicroRNAs of Gallid and Meleagrid herpesviruses show generally conserved genomiclocations and are virus-specific. Virology, 2009, 388: 128—13618 Yao Y, Zhao Y, Smith L P, et al. Novel microRNAs (miRNAs) encoded by herpesvirus of Turkeys: evidence of miRNA evolution byduplication. J Virol, 2009, 83: 6969—697319 Zhao Y, Yao Y, Xu H, et al. A functional MicroRNA-155 ortholog encoded by the oncogenic Marek's disease virus. J Virol, 2009, 83: 489—49220 Lambeth L S, Yao Y, Smith L P, et al. MicroRNAs 221 and 222 target p27Kip1 in Marek's disease virus-transformed tumour cell line MSB-1.J Gen Virol, 2009, 90: 1164—117121 Cebrian J, Kaschka-Dierich C, Berthelot N, et al. Inverted repeat nucleotide sequences in the genomes of Marek’s disease virus and theherpesvirus of the turkey. Proc Natl Acad Sci USA, 1982, 79: 555—55822 Osterrieder N, Kamil J P, Schumacher D, et al. Marek's disease virus: from miasma to model. Nat Rev Microbiol, 2006, 4: 283—294中国科学: 生命科学 2010年第40卷第6期23 Morgan R, Anderson A, Bernberg E, et al. Sequence conservation and differential expression of Marek’s disease virus microRNAs. J Virol,2008, 82: 12213—1222024 Jones D, Lee L, Liu J L, et al. Marek’s disease virus encodes a basic-leucine zipper gene resembling the fos/jun oncogenes that is highlyexpressed in lymphoblastoid tumors. Proc Natl Acad Sci USA, 1992, 89: 4042—404625 Lee L F, Nazerian K, Boezi J A. Marek’s disease virus DNA in a chicken lymphoblastoid cell line (MSB-1) and in virus-induced tumours. In:de Thé G, Epstein M A, Zur Hausen H, eds. Oncogenesis and Herpesviruses Ⅱ. Lyon: IARC, 1975. 199—20426 Sugaya K, Bradley G, Nonoyama M, et al. Latent transcripts of Marek’s disease virus are clustered in the short and long repeat regions. JVirol, 1990, 64: 5773—578227 Jarosinski K W, Osterrieder N, Nair V K, et al. Attenuation of Marek’s disease virus by deletion of open reading frame RLORF4 but notRLORF5a. J Virol, 2005, 79: 11647—1165928 Schat K A, Hooft van Iddekinge B J L, Boerrigter H, et al. Open reading frame L1 of Marek’s disease herpesvirus is not essential for in vitroand in vivo replication and establishment of latency. J Gen Virol, 1998, 79: 841—84929 Fornari F, Gramantieri L, Ferracin M, et al. MiR-221 controls CDKN1C//p57 and CDKN1B//p27 expression in human hepatocellularcarcinoma. Oncogene, 2008, 27: 5651—566130 Galardi S, Mercatelli N, Giorda E, et al. miR-221 and miR-222 expression affects the proliferation potential of human prostate carcinomacell lines by targeting p27Kip1. J Biol Chem, 2007, 282: 23716—2372431 Morgan R W, Xie Q, Cantello J L, et al. Marek’s disease virus latency. Curr Top Microbiol Immunol, 2001, 255: 223—24332 Cantello J, Anderson A, Morgan R. Identification of latency-associated transcripts that map antisense to the ICP4 homolog gene of Marek’sdisease virus. J Virol, 1994, 68: 6280—629033 Cantello J, Parcells M, Anderson A, et al. Marek’s disease virus latency-associated transcripts belong to a family of spliced RNAs that areantisense to the ICP4 homolog gene. J Virol, 1997, 71: 1353—136134 Schumacher D, Tischer B K, Fuchs W, et al. Reconstitution of Marek’s disease virus serotype 1 (MDV-1) from DNA cloned as a bacterialartificial chromosome and characterization of a glycoprotein B-negative MDV-1 Mutant. J Virol, 2000, 74: 11088—1109835 Petherbridge L, Homes K, Baigent S J, et al. Replication-competent bacterial artificial chromosomes of Marek's disease virus: novel toolsfor generation of molecularly defined herpesvirus vaccines. J Virol, 2003, 77: 8712—871836 Petherbridge L, Brown A C, Baigent S J, et al. Oncogenicity of virulent Marek’s disease virus cloned as bacterial artificial chromosomes. JVirol, 2004, 78: 13376—1338037 Sun A J, Petherbridge L, Zhao Y G, et al. A BAC clone of MDV strain GX0101 with REV-LTR integration retained its pathogenicity.Chinese Sci Bull, 2009, 54: 2641—2647483。

Lv—shRNA—Hsa—microRNA—691慢病毒表达载体的构建与鉴定龙源期刊网Lv—shRNA—Hsa—microRNA—691慢病毒表达载体的构建与鉴定作者:何燕浙唐德军来源:《饮食与健康·下旬刊》2016年第08期【摘要】目的:构建 Lv-shRNA-hsa-microRNA-691慢病毒表达载体。
方法:双酶切及测序鉴定正确后进行慢病毒包装与滴度检测。
构建成功后感染人胰腺癌细胞Panc-1, 48h后Real-time Q-PCR检测miR-691的表达。
结果:病毒感染后的Panc-1胰腺癌细胞在倒置荧光显微镜下观察可见绿色荧光,Real-time Q-PCR显示被感染细胞的miR-691表达量较未感染细胞显着增高。
结论:建立了高效稳定表达Lv-shRNA-hsa-miR-691 的慢病毒转染系统。
【关键词】microRNA; Lv-shRNA-hsa- miR-691;慢病毒表达载体microRNA是近年来在人体中发现一类长度约为22个核苷酸左右的非编码RNA,它不直接参与蛋白质的合成,通过对人体1/3左右的mRNA进行调节,控制着细胞分化、增殖和凋亡等生命活动,并能够特异性靶向mRNA实现对其转录后抑制[1]。
已有的研究表明:波形蛋白作为胰腺癌上皮-间质化标志蛋白之一,与胰腺癌的侵袭转移密切相关[2, 3]。
通过生物性息学预测Lv-shRNA-hsa-miR-691可靶向调控波形蛋白的表达。
本研究旨在构建针对Lv-shRNA-hsa-miR-691高效的慢病毒表达系统,为深入研究其靶向调控波形蛋白的表达对胰腺肿瘤细胞侵袭转移提供一种研究工具。
1.材料和方法材料1. 质粒、菌株和细胞及主要酶和试剂慢病毒质粒pLenti-CMV-GFP Puro (658-5)、包装质粒和购自Addgene 公司;大肠杆菌菌株PANC-1细胞妥善保存。
限制性内切酶AgeI、EcoR I、T4 连接酶购自Takara公司;;总RNA提取试剂盒购自Qiagen公司;Fugene HD转染试剂购自Roche 公司;Lv-shRNA-hsa-miR-691定量PCR引物及miRNA qRT-PCR 检测试剂盒购自GeneCopoeia公司。
microRNA调控细胞凋亡的研究进展
刘卜玮;蔡明成;杨雪;赖松家
【期刊名称】《生理科学进展》
【年(卷),期】2018(049)004
【摘要】microRNA(miRNA)是一类非编码小RNA,通过基因转录后调控来调节细胞的各生理过程.其中,细胞凋亡作为细胞自主有序的死亡过程,在维持内环境稳态中起重要作用.同时,miRNA作为细胞凋亡信号通路的关键调节因子,已成为生命科学研究的热点之一.本文综述了miRNA对细胞凋亡相关通路(线粒体通路,死亡受体通路和内质网通路)调控的研究进展,总结了不同组织及细胞中miRNA对凋亡通路的调节作用,为癌症等疾病治疗提供理论指导和新的思路.
【总页数】6页(P309-314)
【作者】刘卜玮;蔡明成;杨雪;赖松家
【作者单位】四川农业大学畜禽遗传资源发掘与创新利用四川省重点实验室,成都611130;四川农业大学畜禽遗传资源发掘与创新利用四川省重点实验室,成都611130;四川农业大学畜禽遗传资源发掘与创新利用四川省重点实验室,成都611130;成都市农林科学院,成都611130;四川农业大学畜禽遗传资源发掘与创新利用四川省重点实验室,成都611130
【正文语种】中文
【中图分类】Q28
【相关文献】
1.MicroRNA调控肿瘤干细胞凋亡的研究进展
2.MicroRNA210和microRNA486与红系造血调控的研究进展
3.MicroRNA-29a调控心房颤动模型大鼠心房肌细胞凋亡的机制研究
4.MicroRNA-766-3p靶向调控Epac-1影响H9C2心肌细胞凋亡的机制研究
5.干预microRNA-181a调控线粒体自噬促进骨髓瘤细胞凋亡的研究
因版权原因,仅展示原文概要,查看原文内容请购买。
S ci. B ull. (2015) 60(2):202–209 w w w.s c ib ull.co mD OI 10.1007/s11434-014-0657-zAltered expression of microRNAs in the response to ER stressLimin Dai • Chuan Huang • Liang Chen • Ge Shan • Zhaoyong LiReceived: 28 M a y 2014 / Ac c ept e d: 29 Jul y 2014 / Pu bli sh e d online: 1 J an u ary 2015 © S ci e n c e Ch in a P res s a n d Sp ri ng e r -Ve rl ag B e rli n Hei d elb e rg 2014Abstract Mi cro R NAs, a cla ss of s m a ll no n co din g R NAs ,play key rol es in div ers e biolo gi cal an d pat hol og ical pro - cess es. E R stres s, res ulting fro m the accumulation ofun fold ed or misfold ed prot eins in the E R lum en, is trig- gered by vario us p hysi ological ev ents and pat h ological insults. Here, using R NA d eep sequ en cing an alysis, we fo un d that the exp ressio n of so m e micro R N As was altered in HeLa and HE K293 cells un d er E R stress. Prot ein and R NA lev els of DGC R8, Dr os h a, Ex p ortin-5, Dicer, an d Ag o2 sh o wed n o sig nificant alteration in E R-stres sed cel ls, whi ch s ug g es ted that the ch an g e in micro R NA exp r essio n might not b e caus ed b y the micro R NA bio gen esis pat h way but by ot her, u nk n o wn facto rs. Real-time PC R ass ays co nfirm ed that hs a-mi R-423-5p was u p-regul ated, whereas hs a-mi R-221-3p and hsa-mi R-452-5p were do wn -regu - lated, in bot h HeL a and HE K293 cells u nd er ER stress. Lucifer as e activit y an d West ern blot ass ays v erified that C DKN 1A was a direct target of hs a-mi R-423-5p an d that C DKN 1B was a direct target of hs a-mi R-221-3p an d hs a- mi R-452-5p. We specu lated that by regul ating their targ ets, micro R NAs might functi on cooperatively as regul ato rs i n the adaptive resp o ns e to E R stress.Keywo rds micro R NA · No n codin g R NA · E R stres s · UP RElectronic supplem entary m aterial The online version of this article (doi:10.1007/s11434-014-0657-z) contains supplementarymaterial, which is available to authorized users.L. Da i · C. Hu a n g · L. C h e n · G. Sh a n · Z. Li (&) S c ho ol of Life S ci en c e s, Uni v ersit y o f Sc i en c e an d T ec h nol o gy of Chi n a, Ke y L ab o rato ry o f B rain F u n ctio n an d Dis e a s e,C hi n es e Ac a d e m y of S ci e n c es, Hefei 230027, Ch in ae-mail: liz hy @u st c.e d u.c n1 IntroductionMi cro R NAs (miR NAs ) are s mall (*22 nt), highl y co n- serv ed n o nco din g R NAs that bind to target seq u ences in the 30 UT R of m ess en g er R NAs (m R N As) to inhibit translatio n or pro mot e m R NA d eg r ad atio n, leading to lo wer prot ein lev els of the target gen es. T wo k ey en zy m es neede d for maturation of th es e s m all reg ulat ors are the R Nas e III en zy m es , DR OS HA, an d DIC E R, whi ch cleave mi R NA precu rso rs an d eventually lead to the form atio n of the mature mi R NA d upl ex. To date, mo r e th an 1,000 miR NAs h ave been regist er ed fo r the hu m an sp ecies , and the nu m b er is still increasi ng [1]. It is estimated that one-third of all protein - co din g g en es are co ntrol led by miR NAs [2]. mi R NAs h av e emerge d as k ey regulat ors of div ers e biological an d pat ho - logical pro cess es, in clu din g cell cycle co ntrol, cell gro wth , different iation, ap o ptosis, an d em bryo dev elo p m ent [3]. Accu m ulating evidence also indicates that mi R NA dys - functi on leads to hu m an dis eas es inclu din g cancer [4]. The en do plas mi c reticulum (E R ) is the pri m ary su b ce l- lular organ elle wh e re protei ns are sy nth esized, mo dified, an d fold ed. The ho m eost asis o f the E R is indis p ens able fo r itsno rm al functi on. On ce it is distu rb ed b y v ari ous ph ysiol og - ical event s or path olo g ical insults, unfold ed or mis fold edprotei ns accumulate in the E R lum en, resulting in E R stress. Du ring E R stress, a series of adaptive mech anis ms are acti- vated to cop e with protei n-foldin g ab n orm a lities, which togethe r are calle d the unfold ed protei n res p ons e (UPR ) [5]. The UPR is mediated by stress sen so rs such as inos itol - requi ring protei n 1a (IR E1a ), protei n kin as e R NA -l ike en d opl as mi c reticulum kin as e (P E R K), and activating tran - scri ption factor 6 (ATF 6) [5]. F ollo win g E R stress, cells are arrested withi n G 1 ph as e [6] and ER stress s erv es to ind u c e a check point that allo ws cells to gain time to re-est ablish ho m eost asis. The UPR sig nalin g p ath way is co or d inatedS ci.B ull.(2015)60(2):202–209 203with a decreas ed rate of protei n synth esis and G1ph as e arrest.PE R K was fou n d to serv e as a critical effector of UP R- indu ced gro w th arrest,lin king stress in the E R to co ntrol o f cell cycle prog ressio n[7].Wh en cells un derg o irrev ersi ble E R stres s an d the ho m eost asis of the E R cann ot b e resto red, the UPR in du ces apo ptosis o f the dam ag ed cel ls[5].Re cently,an increa sin g nu m b er of stud ie s h av e v e ri fied the fun c tio n of mi R NAs in E R st re ss[8].Byrd et al.[9]rep or te d that mi R-30c-2*is in du ce d by the PER K p a th way of the UP R an d go v erns the ex pression of XBP1(X-bo x bi nd in g pr otei n 1),wh ic h is a key tr ansc riptio n fact or t ha t pro m ot es cell surv i v a l in t he ad ap ti ve UPR,by directly ta rg etin g the 30UT R of i ts m R NA.C h itni s et al.[10]dem ons trat ed t ha t PERK in du ce s mi R-211 in E R st re ss,wh i ch in tu rn atte nu at es st re ss- depend en t ex pressio n of the proapo ptotic tra ns cripti on fact or C HOP by directl y ta rg etin g it s prox imal pro m oter.Th ey sugg es te d that PE R K-d ep end en t m iR-211 in du ctio n ma y prev en t pr emat ur e C HOP ac cu m u latio n an d he lp the cell to re-e stab li sh ho me os ta sis pr io r to apop totic co mmitment. mi R-322,a m iR NA wh os e expressio n is do wn-reg ulat ed in E R st re ss, ta rg et s P DIA6,wh os e increa sed abu nd anc e pro- m o te s the sust ai ned acti va tio n of IR E1a sign ali n g un d er E R st re ss[11]. T hes e o bserv atio ns indicate a key ro le fo r mi R- NAs as critical m od ulat ors of the E R st re ss re spo nse.In thi s stud y,w e in vest igat ed the alter ed ex pression of mi R NAs i n He La an d HE K293 cell s und er E R st re ss and the po t en tial re gu lat ors. We sp eculat ed that by neg a ti ve l y re gu- lati ng t he ir ta rg et s, th es e mi R NAs mi gh t fun c ti on t o mediate the UPR sig n alin g p a t h way,wh ic h is t he adap ti ve re spo ns e to E R st re ss. We perf or m ed mi R NA pro fi lin g in He La an d HE K293 cell s und er E R st re ss by s m all R NA deep seq u en ci ng.T hro ug h real-time PCR ass ays,we al so v a li da te d that the expres sion of hs a-mi R-423-5p and hs a-m iR-1246was up-re gu late d,wh erea s t ha t of hs a-mi R-221-3p and hs a-mi R- 452-5p was do wn-re gu late d in E R-st re ssed He La an d HE K293cell s.C DKN1A pl ays a ro le in t he sh ift fro m the pros ur vi va l to t he proapo ptotic fun c ti on of the UP R d u ri ng E R st re ss[12],and C DKN1B is a cell cy cle inhibit or that prev ents t he acti va ti on of cy clin E-C DK2or cy clin D-C DK4 co m p le xes[13].Our lucifera se activit y an d We st er n blot assays i nd icat ed that CDKN1A was a ta rg et of hs a-mi R-423- 5p,and C DK N1B was a direct tar ge t of hs a-mi R-221-3p an d hs a-mi R-452-5p.Our d a ta sugg es te d that micr oR NAs,whos e ex pression was altere d i n E R st re ss, mi gh t fun c ti on in the ad ap ti ve re spons e to E R st re ss by re gu lati ng thei r tar gets.2 Materials and method s2.1 Cell culture and E R stress inducti onHeL a an d HE K293 cells were maintained un der stand ard culture co ndition s with DM E M plu s10%FB S at 37°C an d5%C O2.T o in du ce E R stress, cel ls were treat ed wit h 300 nmol/L th apsi g argin(T G)an d h arv ested at 6,12,an d 24h follo wi n g T G treatme nt. Ethanol (Et OH),solv ent of thapsig argin,was us ed as control.2.2mi R NA seq u en cin gmi R NA seq uen cin g was p er fo rm ed with Illumina GAII2000 with total R NA is olat ed fro m cel ls using Trizol reag ent (In vitro g en,Carlsb ad,US A).A total of5,070,156an d 5,169,260reads were o btain ed fro m the control(Et OH- R NA)an d sam pl e(T G-R NA)library,res p ective ly, in HeL a cells. In HE K293 cel ls,3,611,140reads were obt ain ed fro m the cont rol(Et OH-R NA) librar y an d746,986reads fro m the sam ple(T G-R NA)library. The nu m b er of read s fo r each mi R NA was adj usted to reads p er milli on(RP M) to co m p are the ex pressio n leve ls b et ween the control an d sam ple grou ps.2.3 Real-time PC R an d pri m ersTotal R NA was isolat ed fro m cells usin g Trizol reag ent (In vitro g en)follo wi n g the man u fact urer’s instru ctio ns,an d DN A was eliminated with n ucl eas e-free DNas e(Pro m eg a, M adis on,US A).C o mpl ementary DNA(cDN A)was sy n- thesi zed fro m R NA(100n g)o f each sam pl e via a rev ers e trans cr iption reaction with rand o m prime rs.T h e cDN A was then used for real-time P CR with S YB R green(T aKaR a Biot ech nol og y,Dalian,C hin a),with GAP DH as internal co ntrol. The pri m ers us ed for revers e trans cri p tion an d real- time PC R of micro R NA are listed in T abl es S1an d S2, res p ect ively. The pri m ers u sed fo r real-time PC R of m R NA are listed in Table S3.2.4Western blotWh ol e cell lys a te an d West ern blot an alysis were p er- form ed as describ ed p revio us ly [3].P rot ein of cel ls with o r with o ut thapsig argin treatment fo r24h was utilize d for West ern blotting ass ay.The pri m ary antib o dies us ed were as follo ws:mo us e po lyclonal anti-DGC R8(1:500)(Sig ma, St.L o uis,US A), rabbit poly clo n al anti-Drosh a(1:500) (Sig m a),rab bi t poly c lonal anti-D icer (1:500)(Sig ma), rabbit poly c lonal anti-Ex p ortin-5(1:500)(Sig m a), rabbit poly cl on al anti-Ago2(1:500)(Sig m a),rab bi t poly clo n al anti-C DK N1A(1:1,000)(S anta C ru z,Dallas,US A),rabbit poly cl on al anti-C D KN1B(1:300)(Sang o n,Shan gh ai, Chi n a),an d rabbit mo n ocl o nal anti-b-acti n(1:1,000)(Cell Sign a ling T ech n olo gy,Bost on,US A).P VDF m em bran es were incubat ed for1h at roo m temperature alon g with prima ry antib od y in 5%n on-fat milk an d su bs eq u ently with h ors eradish p eroxi dase-co nju g ated seco n dary anti- bo dy.T h e sign al was detected using a chem ilu min es cence detect ion kit (Per kinElmer Life S cien ces,B osto n,M A,204 S ci. B ull. (2015) 60(2):202–209US A), and b an d densi ty was analyzed with Im ageJ soft- ware and n orm al ized to b –actin.2.5 Plas mid con stru ctio nFor functi on al anal ysis of mi R N A, partial seg m ents of the m R NA 30 UT R contain ing the mi R NA bi ndi ng s equ en ces of C DKN1A (1.5 k b) an d C DKN 1B (1.3 k b) were PC R- amplifi ed fro m cDN A made fro m HE K293 R NA. The forward pri m er for C DK N1A 30 UT R am plification is GC T C T AG AA A GC C T GC A GT C C T G GA A GC , and the rev ers e prime r is GC T C T AG AG T G GG AG G AGC T GT G A AA GA. The fo rwar d pri mer fo r C DKN1B 30 UT R am plifi- cation is GC T C T AGAC A G AT AC AT C AC T G C T T G AT G, an d the rev erse pri m er is GC T C T AG A T T GGC T C AGT AT GC AAC C TT. The PC R prod u c t was th en s u b clon ed into the X ba I site do wn stream o f the stop cod on in the P GL 3-control firefly lucife ras e rep ort er vect or. mi R NA exp ressio n plas- mi ds were con stru c ted by inserting DNA frag m e nt con - taining pre-mi R NA co din g seq uen ce bet ween the Hin d III an d Ba m HI sites of p M R -m C h erry (Clo n tech, Mo u nt ain Vi ew, US A). The prim ers liste d in Table S3 were used fo r DN A frag m e nt am plification with geno m ic DNA of HE K293 cells. Th e correct ori entation of 30 UT R frag m entsan d pre-mi R NA co din g seq uen ce in the plas mid DNA co nstru cts were fu rth er co nfir m ed by s equ enci ng.2.6 Plas mid tran sf ection and Lucifer as e activit y ass ayPlas mi d transf ection was perform ed with Lip of ectamine 2000 (In vitro g en ) accor ding to the su pplie r’s p rot ocol. Fo r luciferas e activit y ass ay, cel ls were trans f ected in 96-well plat es with mi R NA exp r essio n pl as mid s or p M R -m C herry co ntrol plas mid s, pR L -n ull (Renilla plas mi d), an d the firefly lucife rase con stru cts carr ying the corresp o ndi ng 30 UT R. The luciferas e activity was mea sured 24 h post- transf ection usin g the Du al-Lu ciferase Rep ort er 1000 Syst em (Pro m ega) bas ed on the m an ufac tu rer’s prot ocol. Briefly, cells were lys ed with p assi ve l ysis b uffer at roo m temperature fo r 15 mi n. Th e lucife rase ass ay b uffer II was then ad d ed , an d firefly lucife ras e (F-lu c) activity was immediately read usi ng a Fluo ro sk an As c ent FL microplate read er (T herm o Sci entific, Waltha m, M A, US A). Next, Stop & Gl o B uffers with Sto p & Glo s ub strates were add ed an d mix ed briefly. Renilla lu ciferas e (R-l u c) activit y was immediately read. F-lu c activit y was n orm al ized to R-luc activit y to account for variat ion in trans f ection effi ciency.(a)is(b)Fig. 1 mi c ro R N A e xp res sio n was altered in E R -st res s ed cells. a (Left) E R st ress wa s indu c e d by 300 nmol/L th aps ig a rgin (T G) in He L a an d HE K293 cells fo r 24 h; ethanol was us e d as a co nt rol. Total R NA o f cells was iso l at ed for hi g h-t h ro u gh pu t s m all R N A d e ep s eq u en c in g. (Ri ght ) The cyt opl a s mi c spli ci n g o f the xbp -1 m R N A in re sp on s e to T G treatment was detected by s ep a rati ng the RT -P C R p ro d u cts in an a g a ro s e gel. b mi c ro R N A e xp res sio n pro fil e a n al ysis of the de ep se qu e n ci ng re sul ts. Nu m b e r an d percentage of inc re as e d, unc h a ng e d, and de c re as e d m i c ro R N As in E R -st ress e d He L a an d HE K293 cells(TG/Et O H )) (lo g (TGIn c r ea s edhs a -m i R -4508 2.94 hs a -m i R -4508 6.64 hs a -m i R -628-3p2.65 hs a -m i R -3687 4.64 hs a -m i R -1256 2.00 hs a -m i R -4488 4.46 hs a -m i R -199b -5p2.00 hs a -m i R -3648 4.29 hs a -m i R -33b-5p 2.00 hs a -m i R -1248 4.17 hs a -m i R -36092.00hs a -m i R -1291 3.61 hs a -m i R -4645-3p2.00 hs a -m i R -50963.58 hs a -m i R -1246 1.81 hs a -m i R -3651 2.81 hs a -m i R -3158-3p1.80 hs a -m i R -12442.58 hs a -m i R -1291 1.66 hs a -m i R -44492.58De c r e as e dhs a -m i R -4467 -3.32 hs a -m i R -125a-3p -4.86 hs a -m i R -548u-3.17hs a -m i R -3164 -4.52hs a -m i R -500a-5p -3.00 hs a -m i R -4525 -4.49 hs a -m i R -500b -3.00 hs a -m i R -3175-4.46hs a -m i R -675-5p -2.57 hs a -m i R -4742-5p -4.25 hs a -m i R -576-5p -2.50 hs a -m i R -877-5p -4.10 hs a -m i R -4745-3p -2.32 hs a -m i R -556-3p -4.10 hs a -m i R -491-5p -2.32 hs a -m i R -105-3p -3.91 hs a -m i R -130a-5p -2.32 hs a -m i R -100-5p-3.81hs a -m i R -643-2.32 hs a -m i R -4664-5p -3.81S ci. B ull. (2015) 60(2):202–209 2052.7 Statis tic an alysisTable 1 To p 10 in cre a s ed or d e c re as e d mi c ro R N As und e r E R st ress He L aHE K293All val u es repo rted in this stud y repres ent t he av er age ofthree ind ep en d e nt ex p eri m ents with stan d ard error. Aft er m i R N AF ol d c h a ng e m i R N AF ol d c h a ng e /Et O H )) an al ysis of variance by f test, the sta tistical significa nce an d P valu es were evaluat ed b y Stud e nt’s t tes t.3 Results3.1 mi R NA exp r essio n profile d urin g E R stressR NA-s eq was applied to detect the expr essi on leve ls of mi R NA in res p ons e to E R stress. HeL a an d HE K293 cel ls were treat ed to ind u ce E R stress with 300 nmol/L of T G, and the indu ctio n o f the UP R to ER stress was v erified b y the cytopla smic splici ng o f the xbp -1 mR N A [14]. As expected, 24 h o f T G treatment ind uced E R stress ex hib ited as increas ed spliced xb p-1. C o m p arin g with the cont rol cel ls, the exp ressio n of *28 % o f miR NAs was increas ed, *44 % was do wn-reg ula ted, an d *28 % was un ch an g ed in E R- stress ed HeL a cells. By contrast, the ex pres sion o f *9 % of mi R N As was u p-reg ul ated, *2 % was un ch an ged, and *89 % was decreas ed in HE K293 cells in res po ns e to E R stress. T h e top 10 signifi ca ntly increased or d ecreas ed mi R N As in HeL a or HE K293 cel ls are li sted in Table 1. Intere stingly, so m e miR NAs exhibited sam e pattern of ch an ge in res po ns e to E R stress. F or instan c e, hsa-mi R-4508, has-mi R-423-5p, hs a-mi R-1291, hs a-mi R-616-5p, hs a-miR - 3648, hs a-mi R-1246, and hs a-mi R-129-1-3p increas ed in both cell lin es, wh ereas hs a-mi R -452-5p, hsa-mi R-519a-3p , hs a-mi R-4687-3p , hsa-mi R-4738-3p, hs a-miR -221-3p, hs a- mi R-33b-3p, an d hs a-mi R-4747-5p d ecreas ed. So m e other mi R N As includi ng hs a-mi R-450a-5p , hsa-miR -22-3p, hsa- mi R-199b-3p, hsa-mi R-720, hsa-miR -1244, hsa-mi R-22- 5p, and h sa-mi R-320b remained un ch ang ed in resp o ns e to E R stres s (data not sh o wn) (Fig. 1a, b).Usin g real-time PC R, we fu rth er validated the ER stress - indu ced ch an g es in miR N A exp r essio n. C o nsistent wi th the deep s equ enci ng data , the ex pressio n l ev els of mi R-423-5p an d mi R-1246 wer e significa ntly increas ed in T G-treated HeL a and HE K293 cel ls, the lev els of miR -199b -3p an d mi R-320b wer e not affect ed, and the leve ls of mi R-221-3p an d mi R-452-5p were signifi ca ntly d o wn-reg ula ted in HeL a an d HE K293 cells after T G treatment (Fig. 2a, b).3.2 E xp ressio n of mi R NA proces sing facto rsdu ring E R stres sThere are sev er al pro cessi ng st eps fro m p ri m ary trans cri pts to mature miR NAs. Pri mary miR NAs are cleaved to pro- du ce precu rs or mi R NAs by a nuclear R Nas e III-ty pe en zy m e, Dros h a, an d its c ofacto r, DGC R 8. Follo wi n g(lo g 22nuclear pro cessin g, precurs or miR NAs are exp or ted fro m the nucl eus into the cytopla sm b y E x po rtin-5. Th es e pre- cu rs ors are then cleaved b y Di cer an d releas e *22 bp mi R NA d u plex es. The res u lting R NA d u plex is load ed onto R IS C, which co ntai ns Ag o2. On e stran d (the gui de strand ) of the R NA d upl ex remain s in RI S C an d fun ctio ns as the mature miR NA. To investigate wh eth er the chan g es in the mi R NA ex pressi on lev els are res ulted fro m the altered ex pr essi on of k ey facto rs in mi R NA biog en esis pat h w ay, we analyzed the mR NA ex pressi on levels o f five mi R NA pro cessin g factor s, includi ng DGC R 8, Dr osh a, E xportin -5, Di cer, and A g o2, in E R-st ress ed HE K293 cel ls after T G treatment for 6, 12, and 24 h. The exp ressio n o f Drosh a was slight ly decreas ed at 6 h, but in creas ed at 12 h after T G treatment (Fig. 3a). A g o2 mR NA was decreased only after 12-h T G treatment. Non e of the m R NA l ev els o f an y of the fiv e miR NA pro ces sing fact ors were signifi- cantly ch an g ed (Fig. 3a, rig ht pan el) after 24-h T G treat- ment. Unlik e the mR NA ex pr essio n, West er n blots did not detect any ch an ge o n prot ein leve ls of any of the five mi R NA proces sin g factor s (Fig. 3b). Alth o ug h E R stress m ay trigge r so m e flu ctu ation in the m R NA lev els of certain mi R NA pro cessin g factor s, the miR NA bi og en esis pat h way is gen er ally sta ble upo n E R stres s, es peci a lly in prolo n g ed206S ci.B ull.(2015)60(2):202–209(a)(b)Fig. 2 The mi cro R N A ex p ress io n profil e wh e n un d e r E R st re ss wa s validated by RT-real-time PC R. The exp ressi o n of the inc re as e d(m i R-423- 5p,mi R-1246),un c h an g e d(m i R-199b-3p,mi R320b)a n d d e cre a s ed(m i R-221-3p,mi R-452-5p)mi c ro R N As fo u nd in the de ep s e qu e n ci ng ass a y wa s ve ri fi ed by real-time P C R,as sho wn in a (for He L a cell s)a nd b (fo r HE K293c ell s).Erro r ba rs rep res e nt the sta nd a rd erro r fo r three ind e p e nd e nt ex p eri m e nts,a nd P val u es we re determined with a t wo-ta il ed St u d ent’s t te st.*P \0.05;**P \0.01T G treatment (e.g.,24h)(Fig.3b).T h es e data indicatedthat rat her than an alteration in the mi R NA biog en esispat h w ay,so m e oth er un kn o wn factor s might be resp o nsi blefor the m assi v e ch ang es in mi R NA exp ressio n lev els thatwere ob serv ed in E R-stress ed cells.3.3R oles o f mi R NAs in the regulatio n of C DK N1Ban d C DK N1A ex pr essio nT o fu rth er investigate the fun ctio n of miR NAs in E R stress,we b ro ug h t our fo cus on3miR NAs,hs a-miR-221-3p,hsa-mi R-452-5p,and hs a-miR-423-5p,which sh o wed simi larex pres sio n profiles in E R-stress ed HeL a and HE K293 cel ls.It is predicted by the Tar g etS can an d mi R DB prog rams thatC DK N1B is a pot e ntial target of bot h mi R-452-5p an dmi R-221-3p,and C DK N1A is a potential target of mi R-423-5p(Fi g.4a).C o m p ared with the control gro up s, theluciferas e activit y in HeL a an d HE K293 cel ls transf ectedwith C DK N1B30UT R o v er ex pres sion plas mi ds was do wn-regulat ed by ov erexp ressin g miR-221-3p or mi R-452-5p(Fig.4b).R epressi on o f firefly lu ciferas e activit y was als oobs erv ed in HeL a and HE K293 cells co-trans f e cted withrepo rt er plas mi ds harb ori ng the C DK N1A30UT R an dplas mi ds exp r essin g miR-423-5p(Fig.4b).Fu rth erm o r e,ou r Western blot anal ysis d em o nstrated that the C DKN1Bprotei n level in the cell was d o wn-regulate d by miR-221-S ci.B ull.(2015)60(2):202–209 207 (a)(b)1.0 1.0 1.0Fig. 3 Examination of the m R N A a nd p ro te in e xp re ssi on o f fa ct o rs in the mi cro R N A bi o g en e sis p ath wa y.a Ex pre ssi on o f DGC R8,Dr os ha, E xp or tin-5,Di c er,an d Ag o2in HE K293 cells un d er E R stres s was detected by real-time PC R.GAP D H m R N A was us e d as a c ont rol for normalization. b DGC R8,Dro sh a,Ex p ortin-5,Di c e r,an d Ag o2p ro t ein le v els in E R-st res s ed He L a an d HE K293 cells we re test e d by We st e rn blot.b-actin prot ein wa s us e d as a lo adi ng co nt rol,a n d the relative prot ei n le v els we re q u anti fi ed u sin g the Im ag e J so ft wa re(ri g ht pa n el).E rro r b ars rep res e nt the stan d a rd error fo r three ind e p en d e nt e xp e ri m e n ts,a nd P val u es we re determined wit h a t wo-t ail e d St u d ent’s t te st.*P \0.05 3p or mi R-452-5p o verex pr es sion and that the C DKN1Aprotei n level was decreased by mi R-423-5p o v erexp r essio n(Fig.4c).Th es e res ults indicated that C DK N1A an dC DK N1B might serv e as direct targ ets of mi R-423-5p,mi R-221-3p and miR-452-5p,res p ectiv ely.4 DiscussionAccu mulation of unfolded or misfolded ER proteins trigg ersE R stress,an d the UPR is p rimarily a cellular adaptive respons ethat allevi ates E R stress by in creasing the protein-foldingcapacity and sim ultan eo usly redu cing the influx of nascentpolypeptides into the E R.miR NAs,which inhibit m R NAtranslation o r pro mote m R NA degradation by targeting t he30UT Rs of m R NAs, re su lt i n l o w er pr otei n l ev els of t h eir tar g etgen e s.Althoug h increasing eviden ce h a s sho wn co-adjus tmentbet ween mature miR NAs an d s ignal t ransd ucers in the UP Rsign aling p ath way[15–18], little is kno w n a bout the processingof pri-miR NA s and p re-miR NA s during E R stress.Our stud y sho wed alter ed expr essio n of a majorit y ofmi R NAs in He La and HE K293 cell s un der E R st re ss(F i g.1b;T ab le 1),wh ic h sug g es t ed the in vo l v e ment of mi R NAs i n ERst re ss. We atte mp te d to de te rm ine wh et her the chan ges i nmi R NA ex pressio n we re attri bu table to mi R NA processin g inE R stress.S urp ris ingl y, t he expressio n of s ev er al key co m-po ne nt s of the mi R NA bi og en esis ma ch iner y,i nc ludi ng the208S ci.B ull.(2015)60(2):202–209(a)(b)(c)1.0 1.0Fig. 4Vali d ati on of mi c ro R N A t a rg ets b y lu ci fe ras e activity ass ay s an d We st e rn bl ots. a There are two potential target sites fo r hs a-m i R-221-3p a nd on e potential target site fo r hs a-m i R-452-5p in the 30UT R of the C DK N1B m R N A.T wo po ssi bl e target site s fo r hs a-m i R-423-5p are located in the 30UT R of the C DK N1A m R N A.b He L a a nd HE K293 cells we re c o-t ra ns fe ct e d with mi c ro R N A ex p ressi o n pl a s mi ds o r p M R-m C h e rry (m C h e rry)an d wit h the pR L-null (Renilla pl a s mi d)a nd fi re fly lu ci fe ras e re po rt e r pl as m i ds h a rb o rin g the co rre sp on di ng30UT R. The ratio of the rep o rt e r(Fi r efl y) to co nt rol pl as m i ds(Renilla) in relative lu mi n es c e n c e uni ts wa s plotted. c He L a cells we re tra ns fe ct ed wit h the p M R-m C h e rry c ont rol pl as m i d(m C h e rry)o r mi c ro R N A ex p ressi o n pl as m i ds fo r48h a n d h a rv e st ed fo r We s t ern blot an al ysi s o f C D K N1B,an d C D K N1A.b- actin prot ei n was utilized a s a lo adi n g co nt rol,a nd the relative prot e in level wa s qu an tifi e d by the Im ag eJ so ft wa re.E rro r ba rs re pre s en t the sta n d ard erro r for three ind e p en d ent e xp e ri m e n ts,an d P v alu e s were determined wit h a t wo-t ail e d St ud e nt’s t test.*P \0.05;**P \0.01pr i-mi R NA pr ocessin g fact ors DGC R8and Drosh a,pr e-mi R NA tra ns fe rr in g fact or E xpo r ti n-5,an d p r e-mi R NA pro-ce ss in g fact ors Di ce r an d Ago2,flu ct ua te d du ri ng E R st re ss.M o re ov er, t he re we re n o ob vi ous v a riatio ns in the mR NA o rpr otei n le ve l s of any o f th es e g en es at 24h afte r T G in du cti on,wh ic h indicate s that mi R NA ex pression ch an ges du ri n g E Rst re ss d o no t re su lt fro m pr i-mi R NA or pr e-m iR NA pro cess-in g,bu t m ay b e re gu lat ed b y un kn o wn fact ors that affect thestab ilit y of mature mi R NAs du ri ng E R st re ss.Re cently,anincrea sin g nu mb er of stud ie s hav e re po rt ed that the stab ility ofa mi R NA i s re gu late d by tra ns cripti on fact ors or i s relat ed toit s o wn s eq u en ce.Yu and Hech t [19]fou nd t ha t tr ansl in, aDNA/R NA-b i nd in g pr otei n, bi nds t o mi R-122a and i n c re as esit s in vi vo st ab ilit y.B ail et al.’s[20]stud y re po rt ed t ha t mi R-382, a mi R NA that co ntri bu t es to HIV-1prov ir us late ncy,isunstab le in cell s an d that t he30termi nus of th is mi R NA isne ce ss ar y for i ts in stab ilit y.In our fu ture re se ar ch,w e wi llseek to d e termine wh ic h fact ors affect mi R NA stab ility in E RS ci.B ull.(2015)60(2):202–209 209st re ss,in order to el uc idate the me ch an i s m of mi R NA ex pression v a riatio n in E R-s tr essed cell s.Ho w coul d miR NAs fun ctio n in E R stres s? T o ad dress this q u estion,we fo cus ed on the stud y of h sa-mi R-221-3p, hs a-mi R-452-5p,and hs a-mi R-423-5p,wh os e exp r essio n pro files sh o wed hi gh d eg rees o f co nsisten cy in ER-stress ed HeL a and HE K293 cells. We v erified that hsa-mi R-423-5p targeted C DKN1A an d that hsa-mi R-452-5p an d hs a-miR- 221-3p target ed C DKN1B.Sev er al studi es h av e prop os ed that CDKN1A m ay blo ck apo ptosis by interacting with proap optotic molecu les such as pro casp as e-3 in the cyto- plas m[12,21].C DK N1B,en co din g a cyclin-d ep end ent kin as e inhibi tor,bind s to an d prev ents the activation of cyclin E-C DK2or cyclin D-C DK4co m plex es an d th us co ntrols cell cycle prog ressio n at G1[22].By negativel y regulat ing their target s,hs a-mi R-423-5p m ay activate ap o ptosis,whereas hs a-mi R-452-5p an d hs a-mi R-221-3p m ay med iate cell cycle arrest.Gi ven the diversity of mi R N As an d their targ ets,our study provi d es o nly an example and sh o ws limit ed info rm ation on the regulatio n of mi R NAs du rin g E R stress an d the UPR. The do wn- regulat ed an d up-reg ulat ed miR NAs may syn er gistically functi on and cont ribute to the adaptive res po ns e to E R stress.The dy n amic in v ol vement of mi R NAs in E R stress an d the UP R is a very comple x regulat ory n et wo rk.C ells are su bjected to inn er and o uter stim uli and in sults at all ti m es,an d n on codi ng R NAs are kn o wn to play vital rol es in th es e co nt exts[23–26].F urth er in v estigatio ns are ess enti al to better und erst an d the invol vem en t of n on cod- ing R NAs in th es e biolo gi cal event s.Ackno wledgements This wo rk was sup p ort e d by the Nat io n al B a si c R e s e arc h P ro g ra m of Chi n a(2011C B A01103), the Nati o n al Na t u ral Sc i en c e Fou nd a tio n of Chin a(81372215,31301069, 81171074,a nd91232702), the S ci e n c e F o un d ati on of the C hin e s e Ac a d e m y of Sci e n c es(KJ Z D-E W-L01-2),Anh ui Pro vi n ci al Nat ural S ci e n c e F ou n da tio n(1408085M C42),a nd the Fu nd a m e n t al R es e a rc h F un ds for the Ce nt ra l Uni v e rsiti e s(W K2070000034).Conflict of interest The aut ho rs declare that the y ha v e no co n fli ct of int e rest.References1.Ko z o m a ra A,Griffit hs-J on es S(2011)mi R B a s e: integratingm i c ro R N A a nn ot ati o n a nd d e e p-s e qu e n cin g data. Nu c l eic Aci ds R e s39:D152–D1572.S hiv d as a ni R A(2006)mi c ro R N As:re gul a to rs o f g e n e e x pre ssi ona nd cell differentiation. Bloo d108:3646–36533. Li Z,Hass a n M Q,Voli ni a S et al (2008)A mi c ro R N A si g n atu refo r a B M P2-i nd u c e d ost eo bl ast lineage commitment pro g ra m.P ro c Na tl Ac a d S ci US A105:13906–139114.De Sa nt a F,Ios u e I,Del Rio A et al (2013)mi cro R N A bi o g en e sisp ath wa y as a therapeutic t arget for h u m a n dis e as e an d cancer.C u rr Ph a rm De s19:745–7645.Het z C(2012) The unfol d ed p ro t ein re sp on s e:c o ntrolli n g cellfate dec isi on s u nd e r E R stre ss an d be y on d.Nat R e v Mol Cell B iol13:89–1026.Tho m a s SE,M al z e r E,Ord on e z A et al (2013)p53a nd tra nsl a-tion attenuation regulate disti n ct cell cycle c h e ck p oint s du ri nge nd op l as m i c reticulum (E R)stres s.J Biol Ch e m288:7606–76177.Bre we r J W,Di ehl J A(2000)P E R K mediates cell-cycle exitdu ri ng the mammalian un fol d e d prot ein re sp on s e.P ro c Nat l Ac adS ci US A97:12625–126308.Chit nis N,P yt el D,Di ehl J A(2013)UP R-in d u cibl e mi R N Asc ont ri but e to stres sful situ ati on s.T ren ds B io c h e m S ci38:447–4529.B yrd AE,Ara go n IV,B re we r J W(2012)mi c ro R N A-30c-2*limits expre ssi o n o f pro a d ap tiv e factor XB P1 in the unfol d edprot ei n re sp on s e.J Cell Biol196:689–69810.Chit nis NS,Pyt el D,B ob ro v nik o v a-M a rj on E et al (2012)m i R-211is a pros u rvi v al mi c ro R N A that re g ul at es ch op e xp res sio n ina PE R K-d e p e n d ent m an n e r.M ol Cell 48:353–36411.Gro e n en d yk J,P e ng Z,Dud e k E et al (2014)Int e rpl ay b et we e nthe oxido re du ct a s e P DI A6an d mi c ro R N A-322c o nt rol s theres po ns e to disru pt ed en do pl as m i c reticulum calcium h o m e ost a-sis.S ci Sig n al7:ra5412.Mi h aili d ou C,P a p a zi an I,P a p av a ssili o u AG et al (2010)C H OP-d epe nd e nt reg ul ati on of p21/wa f1du ri ng E R stre ss. Cell Ph ys iolB io c h e m25:761–76613.Toy os hi m a H,Hu nt e r T (1994)p27, a no v el in hi bito r o f G1 cyclin-C d k prot ei n kin a s e activity, is related to p21. Cell 78:67–7414.Yos hi d a H,M at su i T,Ya m a m ot o A et al (2011)XBP1 m R N A i sind u c e d by AT F6an d spli c e d by IR E1 in re sp o ns e to ER st ress topro du c e a hig hly active tran s cripti o n fa ct o r.Cell 107:881–89115.B el m o nt PJ,C h e n WJ,T hu e rau f DJ et al (2012)R eg ul ati on ofm i c ro R N A e xp res sio n in the heart by the AT F6b ra n ch o f the ERstre ss re sp o ns e.J Mol Cell C a rdiol52:1176–118216.B a rt os ze ws k i R,Bre w er J W,R a b A et al (2011)Th e unfo ld e dpr otei n re spon se(UP R)-acti va t ed tra ns criptio n fact or X-bo x- bi nd in g pr otei n1(XB P1) i nd u c es micr oR N A-346ex p ressio n t ha tta rg et s the hu ma n an ti ge n pe ptide tra nspo rter 1(T AP1)m R N A a ndgo ve rn s im m un e re gu lato ry ge ne s.J Bi ol C h em 286:41862–41870 17.Ch h ab ra R,Du b ey R,S ai ni N(2011)Ge n e ex p ress io n profil in gindicate role of E R stres s in mi R-23a*27a*24-2cl ust e r ind u c eda po pt osis in HE K293T cells. R N A B iol8:648–66418.M urat su-Ik e d a S,Na n g ak u M,Ik ed a Y et al (2012)Do wn re g u-lation of mi R-205m o dul at e s cell sus c ep tibi lity to oxidative ande nd op l as m i c reticulum stress e s in renal tub ul a r cells. P Lo S On e7:e4146219.Yu Z,He c ht NB(2008) The DN A/R N A-bi ndi n g prot ein,tra nsli n,bin ds m ic ro R N A122a an d in c re as es its in viv o stability. J An d rol 29:572–57920. Bail S,S we rd el M, Liu H et al (2010)Di ffere nti al reg ul ati o n o fm i c ro R N A stability. R NA16:1032–103921.Su z uki H,Ya b ut a N,Ok a d a N et al (2013)L ats2p ho sp ho ryl at esp21/C D K N1A after UV irradiation and re gu l at es ap o pto sis.J Cell S ci126:4358–436822.R e yni sdo´ttir I,M ass a g u e´J(1997) The sub c e llul a r lo c ati on s ofp15(In k4b)a n d p27(Ki p1)c oo rdin at e their inh ibit o ry int e ra cti on swit h cd k4a nd c dk2.Gen e s De v11:492–50323.M en g L F,C h e n L, Li Z Y et al (2013)R ol es o f mi cro R N As in theC a e no rh ab diti s el e ga ns n e rv ou s syst e m.J Ge n et Ge no m i cs40:445–45224. Liu HJ,Wa n g XR,Wa n g HD et al (2012)Es c h eri c hi a colino n co di ng R N As can affect gen e e xp res si on a nd ph ysi ol og y ofC a e no rh ab diti s el eg an s.Na t Co m m u n3:107325.Hu S S,Wu J,C h e n L et al (2012)Sig n al s fro m no n c odi n g R N As:un c on v e ntio n al rol e s fo r co n v enti o n al pol III tran s cript s.Int JB io c h e m Cell B iol44:1847–185126.M e ng L F,Ch e n L, Li Z Y et al (2013)En vi ron m e n t al R N Ainterference in ani m a ls.C hi n S ci B ull58:4418–4425。
专利名称:MICRORNA (MIRNA) FOR THE DIAGNOSIS AND TREATMENT OF HEART DISEASES发明人:THUM, Thomas,BAUERSACHS, Johann申请号:EP2007008772申请日:20071009公开号:WO08/043521P1公开日:20080417专利内容由知识产权出版社提供摘要:The invention relates to microRNAs (miRNAs) for the diagnosis, prophylaxis and/or treatment of heart diseases, and especially to SEQ ID NR: 1 bis SEQ ID NR: 29 for the diagnosis, prophylaxis and/or treatment of heart diseases. The invention also relates to the use of said sequences for producing a medicament for heart diseases and for the diagnosis of heart diseases. The invention further relates to a method for diagnosing a heart disease, a kit and an expression vector comprising said sequences, a cell containing the expression vector, a method for modulating a heart disease, and a method for screening a pharmaceutically active compound for the treatment and/or prophylaxis of a heart disease.申请人:THUM, Thomas,BAUERSACHS, Johann地址:DE,DE,DE国籍:DE,DE,DE代理机构:ELBEL, Michaela更多信息请下载全文后查看。
MicroRNA在氧化应激诱导晶状体上皮细胞凋亡中作用的初步研究柏凌;李鹏;陈凌;何玲;王峰【期刊名称】《国际眼科杂志》【年(卷),期】2014(14)10【摘要】AIM: To identify the changes in microRNA ( miRNA ) profile of human lens epithelium ( HLE) induced by H2 O2 and the role of miRNA in oxidative stress induced apoptosis. <br> METHODS: HLE cell line HLE - B3 was treated by 100μmol/L H2 O2 for 24h and the total RNA were isolated by Trizol reagent. miRNA profile was generated by miRCURYTM LNA microRNA Array. The target genes of differentially expressed miRNAs were predicted by bioinformatics software. <br> RESULTS:Twenty-eight miRNAs showed significantly differential expression after H2 O2 treatment, 18 miRNAs upregulated and 10 miRNAs downregulated. The differentially expressed miRNAs may involve in apoptosis of lens epithetium and development of cataract through targeting BCL2L2 and MIP. <br> CONCLUSION: H2 O2 can induce dramatically changes in miRNA profile of HLE, which may play a pivotal role in the pathogenesis and development of cataract.%目的:观察H2 O2处理对晶状体上皮细胞HLE-B3miRNA表达谱的影响,初步明确miRNA在氧化损伤诱导晶状体细胞凋亡中的作用及机制。
Altered microRNA expression following traumatic spinal cord injuryNai-Kui Liu,Xiao-Fei Wang,Qing-Bo Lu,Xiao-Ming Xu ⁎Spinal Cord and Brain Injury Research Group,Stark Neurosciences Research Institute and Department of Neurological Surgery,Indiana University School of Medicine,950W.Walnut St.,R-2Building,Room 402,Indianapolis,IN 46202,USAa b s t r a c ta r t i c l e i n f o Article history:Received 5May 2009Revised 15June 2009Accepted 18June 2009Available online 1July 2009Keywords:Spinal cord injury MicroRNA In flammation Oxidation ApoptosisGene expressionMicroRNAs (miRNAs)are a novel class of small non-coding RNAs that negatively regulate gene expression at the posttranscriptional level by binding to the 3′untranslated region of target mRNAs leading to their translational inhibition or sometimes degradation.We uncovered a previously unknown alteration in temporal expression of a large set of miRNAs following a contusive spinal cord injury (SCI)in adult rats using microarray analysis.These altered miRNAs can be classi fied into 3categories:(1)up-regulation,(2)down-regulation and (3)an early up-regulation at 4h followed by down-regulation at 1and 7days post-SCI.The bioinformatics analysis indicates that the potential targets for miRNAs altered after SCI include genes encoding components that are involved in the in flammation,oxidation,and apoptosis that are known to play important roles in the pathogenesis of SCI.These findings suggest that abnormal expression of miRNAs may contribute to the pathogenesis of SCI and are potential targets for therapeutic interventions following SCI.©2009Elsevier Inc.All rights reserved.IntroductionThere are two mechanisms of damage after acute spinal cord injury (SCI):a primary mechanical injury and a secondary injury induced by multiple biological processes including extensive temporal changes in gene expression (Bareyre and Schwab,2003;Di Giovanni et al.,2003;Nesic et al.,2002).Alteration in expression of many genes has been shown to play important roles in the pathogenesis of secondary SCI (Bareyre and Schwab,2003;Di Giovanni et al.,2003;Nesic et al.,2002).Much less insight,however,has been gained into the regulatory network that establishes such altered gene expression.miRNAs are attractive candidates as upstream regulators of the secondary SCI progression because miRNAs can post-transcriptionally regulate the entire set of genes (Chan et al.,2005;Lim et al.,2005).miRNAs are endogenous,non-coding ∼22nt RNA molecules that have been discovered recently as fundamental and posttranscriptional regulators of gene expression (Kosik,2006;Krichevsky,2007).Recent evidence suggests that expression of at least 20–30%of human protein-coding genes is modulated by miRNAs (Krichevsky,2007).A number of miRNAs were found in the mammalian CNS,including the brain and spinal cord,where they play key roles in neurodevelopment and are likely to be important mediators of plasticity (Bak et al.,2008;Kosik,2006;Krichevsky,2007;Miska et al.,2004).Some miRNAs have been implicated in several neurological diseases such as Tourette's syndrome and Fragile X syndrome (Kosik,2006).Recently,several studies suggested the possibility of miRNA involvement in neurode-generation (Bilen et al.,2006;Kim et al.,2007;Schaefer et al.,2007).To date,however,no reports are available on the expression of miRNAs after SCI.In the present study,we examined temporal expression of miRNAs in the spinal cord following contusive SCI in adult rats using microarray analysis and con firmed these results with real-time quantitative reverse transcriptase polymerase chain reaction (qRT-PCR).Our findings provide the first evidence of an altered miRNA expressional pro file in the spinal cord following injury.The bioinfor-matics analysis suggests that the altered expression of miRNAs may contribute to the pathogenesis of secondary SCI.Materials and methods Spinal cord contusion injuryAdult female SD rats (200–230g)underwent a T10contusive spinal cord injury using an NYU impactor (10g,12.5mm),as described previously (Liu et al.,2004).Control animals received laminectomy only.The rats were sacri ficed at 4h,1day,or 7days post-SCI,and a 10mm spinal cord segment containing the injury epicenter was removed quickly for microarray and qRT-PCR analyses.All surgical interventions and postoperative animal care were performed in accordance with the Guide for the Care and Use of Laboratory Animals (National Research Council,1996)and the Guidelines of the Indiana Institutional Animal Care and Use Committee.Total RNA extractionTotal RNA from 10mm-long spinal cord segments containing the injury epicenter was extracted with miRNeasy Mini kit (Qiagen,Experimental Neurology 219(2009)424–429⁎Corresponding author.E-mail address:xu26@ (X.-M.Xu).0014-4886/$–see front matter ©2009Elsevier Inc.All rights reserved.doi:10.1016/j.expneurol.2009.06.015Contents lists available at ScienceDirectExperimental Neurologyj o u r n a l h o me p a g e :w w w.e l s e v i e r.c om /l o c a t e /y e x nrValencia,CA)according to the manufacturer's instructions.RNA purity was examined by spectrophotometric determination at 260/280and 260/230nm.miRNA microarray assay and analysisMicroarray assay for mature miRNAs was performed by the LC Sciences Microarray Service (LC Sciences,Houston,TX).Brie fly,total RNA (5μg)was size fractionated (b 300nucleotides)by using a YM-100Microcon centrifugal filter (Millipore)and the small RNAs (b 300nt)isolated were 3′-extended with a poly(A)tail using poly (A)polymerase.An oligonucleotide tag was then ligated to the poly (A)tail for later fluorescent dye staining.Dye switching was done for duplicates to eliminate potential dye bias.Hybridization was performed overnight on a μPara flo micro fluidic chip using a micro-circulation pump (Atactic Technologies).On the micro fluidic chip,each detection probe consisted of a chemically modi fied nucleotide coding segment complementary to target all 350mature rat miRNA sequences from miRBase version 11.0(Sanger Institute,Cambridge,U.K.;/sequences ).After RNA hybridization,tag-conjugating Cy3and Cy5dyes were circulated through the micro fluidic chip for dye staining.FluorescenceFig.1.Heat map shows signi ficant expressional changes of 60miRNAs with levels of intensity N 500in rats that received a contusive SCI and were sacri ficed at 4h,1day,and 7days post-injury as compared to the sham-operated control (n =3/group;S1–3,sham;4h 1–3,4h post-SCI;1day 1–3,1day post-SCI;7days 1–3,7days post-SCI).The color green indicates down-regulation and red up-regulation.425N.-K.Liu et al./Experimental Neurology 219(2009)424–429images were collected using a laser scanner(GenePix4000B, Molecular Device)and digitized using Array-Pro image analysis software(Media Cybernetics).Data were analyzed byfirst subtracting the background and then normalizing the signals using a LOWESSfilter(Locally-Weighted Regression)for two color experiments.Transcripts were determined as detectable if their signal intensity was higher than3times the background standard deviation,spot CV(standard deviation/signal intensity)was b0.5,and transcripts had at least50%of replicate probe signals registering above the detection level.p values of the ANOVA were calculated.The miRNAs with p values b0.05and signal intensity N500were selected for cluster analysis according to a hierarchical method,which was performed with average linkage and Euclidean distance metrics.The clustering plot was generated using TIGR MeV(Multiple Experimental Viewer)software from the Institute for Genomic Research.Rea-time qRT-PCRReal-time quantitative reverse transcriptase polymerase chain reaction(qRT-PCR)was performed by the LC Sciences Service(LC Sciences,Houston,TX).Briefly,10ng of total RNA from each sample was reverse-transcribed to cDNA using TaqMan®MicroRNA Reverse Transcription Kit(Applied Biosystems,Foster City,CA)and miRNA-specific primers(Applied Biosystems)for four down-regulated(miR-137,miR-181a,miR-219-2-3p and miR-7a)and one up-regulated miRNA species(miR-21).Each group hadfive samples:three from the microarray studies and two from additional samples not used in the microarray studies.U87and4.5S were used as endogenous controls.A no-template control was used as a negative control.Critical threshold (CT)values were determined using ABI Prism7000SDS Software (Applied Biosystems).The relative quantity of each miRNA to U87was described using2−ΔC T,whereΔC T=(C T miRNA−C T U87).Fig.2.Bar graphs show significant expressional changes of60miRNAs at4h,1day and7days post-SCI with levels of intensity N500(ANOVA,p b0.05;n=3/group).(A)miRNAs significantly up-regulated following SCI.(B)miRNAs significantly down-regulated following SCI.(C)miRNAs significantly up-regulated at4h and then down-regulated at1and 7days post-SCI.426N.-K.Liu et al./Experimental Neurology219(2009)424–429Statistical analysisAll data are presented as mean±SD.One-way ANOVA with Tukey HSD post hoc t -tests were used to determine levels of statistical signi ficance.A p value of b 0.05was considered statistically signi ficant.ResultsWe examined expression of 350Rattus norvegicus -miRNAs based on Version 11.0of the Sanger miRBase (Sanger Institute,Cambridge,U.K.;/sequences )in the injured spinal cords at 4h,1and 7days after acute SCI.Microarray analysis revealed that 269of 350miRNAs were detected in the adult rat spinal cord.Based on signal intensity of the miRNA expression,levels of miRNAs expressed in adult rat spinal cords were divided into four categories:low level (intensity b 500),moderate level (500–4999),high level (5000–9999)and the highest level (N 10000).Among all expressed miRNAs,36were expressed at the highest level in the normal spinal cord (Supplementary Table 1).After SCI,97of 269miRNAs showed signi ficant expressional changes (ANOVA,p b 0.05).Of those,60miRNAs were expressed greater than the low level,i.e.between the moderate and highest levels (Supplementary Table 2).These miRNAs can be classi fied into five distinct clusters by hierarchical clustering analysis (A –E;Fig.1).Clusters A and C contain up-regulated miRNAs (Fig.2A),cluster D contains down-regulated miRNAs (Fig.2B),and clusters B and E contain miRNAs that were up-regulated at 4h post-SCI and then down-regulated at 1and 7days (Fig.2C).The remaining 37miRNAs were expressed at low level and were signi ficantly deregulated after SCI (Supplementary Table 3).The expression of 89miRNAs above the low level and 83miRNAs at the low level were unaffected by SCI (Supplementary Table 4and 5).To validate the microarray platform,we assessed the expression of a subset of miRNAs including four down-regulated (miR-137,miR-181a,miR-219-2-3p and miR-7a)and one up-regulated (miR-21)miRNAs by real-time qRT-PCR.A strong correlation between our microarray pro filing and real-time RT-PCR data was found (Fig.3),suggesting that the microarray data were reliable to warrant further analysis.To analyze the role of miRNAs following SCI,potential downstream targets for miRNAs altered after SCI,predicted by miRanda,were retrieved from the Sanger miR Database.The bioinformatics analysis revealed that some in flammatory mediator mRNAs such as tumor necrosis factor-α(TNF-α),interleukin-1β(IL-1β)and intercellular adhesion molecule 1(ICAM1)mRNAs were potential targets of miR-181a,miR-411,miR-99a,miR-34a,miR-30c,miR-384-5p and miR-30b-5p which were down-regulated after SCI.Conversely,some anti-in flammatory mRNAs such as annexin A1and annexin A2mRNAs were potential targets of miR-221and miR-1respectively,which were up-regulated after SCI (Figs.4A and B).Cytosolic phospholipases A 2(cPLA 2)and secretory PLA 2(sPLA 2)mRNAs were potential targets of miR-181a and miR-127,respectively,which were down-regulated after SCI (Fig.4A).Recent evidence showed that SCI-induced PLA 2activation may play an important role in the pathogenesisofFig.3.Real-time qRT-PCR validation shows a strong correlation between the microarray and real-time qRT-PCR data.r =correlation coef ficient (n =3/group for microarray,n =5/group forqRT-PCR).Fig.4.The potential targets of altered miRNAs following SCI.(A)Several in flammatory genes are potential targets of down-regulated miRNAs after SCI.sPLA 2:secretary phospholipase A 2;cPLA 2:cytosolic phospholipase A 2;TNF-α:tumor necrosis factor-α;IL-1β:interleukin-1β;ICAM1:intercellular adhesion molecule 1.(B)Several anti-in flammatory or anti-oxidative genes are potential targets of up-regulated miRNAs after SCI.ANXA1:annexin A1;ANXA2:annexin A2;SOD1:superoxide dismutase 1.427N.-K.Liu et al./Experimental Neurology 219(2009)424–429secondary SCI (Liu et al.,2006).Several up-regulated miRNAs after SCI,such as miR-1,miR-206,miR-152and miR-214,are upstream to some anti-oxidant genes such as SOD1and catalase genes (Fig.4B).In recent years,apoptosis has been identi fied as an important mechanism of cell death in many neurological disorders including SCI (Beattie et al.,2000;Crowe et al.,1997;Liu et al.,1997).Apoptotic genes such as caspase-3,calpain 1,calpain 2and apoptosis inducing factor (AIF)were potential targets of several miRNAs such as miR-235-3p,miR-137,miR-98,miR-124and miR-30b-3p,which were down-regulated after SCI.However,some anti-apoptotic genes such as Bcl2-1and Bcl2-2were potential targets of several miRNAs such as miR-145,miR-214,miR-133a,miR-133b,miR-674-5p,miR-15b,miR-17,miR-20a,miR206,miR-672,miR-103and miR-107,which were up-regulated after SCI (Figs.5A and B).DiscussionTo our knowledge,this is the first study demonstrating the miRNA expression pro file after traumatic SCI in adult rats.Real-time qRT-PCR analysis veri fied the results of the microarray study and showed that the microarray data were consistent and reliable.We demonstrated that ≈77%of the identi fied rat mature miRNAs were expressed in the adult rat spinal cord,suggesting that the rat spinal cord is a rich source of miRNA expression,which is consistent with a previous report showing the expression of a large number of miRNAs in the spinal cord of adult mice (Bak et al.,2008).We then demonstrated that a large set of miRNAs were signi ficantly deregulated after SCI.Among the 60miRNAs that showed expressional changes greater than the low level,30were up-regulated,16down-regulated,and 14up-regulated at 4h post-SCI and then subsequently down-regulated at 1and 7days (Figs.1and 2).These altered miRNAs with a diversity of functions may affect a large number of neuronal genes (Kim et al.,2004;Krichevsky et al.,2003;Lagos-Quintana et al.,2002).Demonstrating a large number of miRNA expressional changes following acute spinal cord injury is an important first step in understanding the underlying molecular mechanism of injury.However,the pathophysiological relevance of deregulation of these miRNAs after traumatic SCI remains to be ing a bioinformatics approach,we analyzed potential targets for miRNAs that were altered after SCI.The bioinformatics analysis indicates that the potential targets for these miRNAs include genes encoding components that are involved in many pathophysiological processes such as in flammation,oxidation and apoptosis following SCI.For example,several miRNAs down-regulated after SCI are upstream to several in flammatory (Fig.4A)and apoptotic (Fig.5A)genes whereas other miRNAs up-regulated after SCI are upstream to several anti-in flammatory,anti-oxidative and anti-apoptotic genes (Figs.4B and 5B ).These findings suggest that abnormal expression of miRNAs following SCI may contribute to the pathogenesis of secondary SCI,and could be potential targets for therapeutic intervention following SCI.Although the roles of miRNAs in human diseases including that of the SCI are to be elucidated,increasing evidence suggests that these miRNAs represent a new class of drug target (Esau and Monia,2007;Mirnezami et al.,2009;Weiler et al.,2006).miRNAs reduce steady state protein levels for the targeted genes by posttranscriptional regulation (Kosik,2006;Krichevsky,2007).Inhibition of a particular miRNA linked to a particular disease may remove the blockade against expression of a therapeutic protein.Conversely,administration of a miRNA mimetic may boost an endogenous miRNA population which in turn represses a detrimental gene.Taking advantage of their small size and the current knowledge of miRNA biogenesis,modi fied RNAs can be transiently delivered as a synthetic,pre-processed miRNA or anti-miRNA oligonucleotides (Medina and Slack,2009).Several studies have shown the potential of customized miRNA inhibitors to target speci fic pathologic miRNAs in vitro ,and more importantly,in vivo (Medina and Slack,2009;Mirnezami et al.,2009).In conclusion,our study has provided the first evidence of altered miRNA expression following SCI.To elucidate the role of miRNAs in SCI,additional studies are required to investigate the function and targets of these miRNAs.Experiments along these lines are currently in progress in our laboratory.AcknowledgmentsThis work was supported by NIH NS36350,NS52290,NS50243,Mari Hulman George Endowment Funds and the State of Indiana (Grant #91910and 91913).Appendix A.Supplementary dataSupplementary data associated with this article can be found,in the online version,at doi:10.1016/j.expneurol.2009.06.015.ReferencesBak,M.,Silahtaroglu,A.,Moller,M.,Christensen,M.,Rath,M.F.,Skryabin,B.,Tommerup,N.,Kauppinen,S.,2008.MicroRNA expression in the adult mouse central nervous system.RNA 14(3),432–444.Bareyre,F.M.,Schwab,M.E.,2003.In flammation,degeneration and regeneration in theinjured spinal cord:insights from DNA microarrays.Trends Neurosci.26(10),555–563.Beattie,M.S.,Farooqui,A.A.,Bresnahan,J.C.,2000.Review of current evidence forapoptosis after spinal cord injury.J.Neurotrauma.17(10),915–925.Bilen,J.,Liu,N.,Burnett,B.G.,Pittman,R.N.,Bonini,N.M.,2006.MicroRNA pathwaysmodulate polyglutamine-induced neurodegeneration.Mol.Cell.24(1),157–163.Chan,C.S.,Elemento,O.,Tavazoie,S.,2005.Revealing posttranscriptional regulatoryelements through network-level conservation.PLoS Comput.Biol.1(7),e69.Crowe,M.J.,Bresnahan,J.C.,Shuman,S.L.,Masters,J.N.,Beattie,M.S.,1997.Apoptosis anddelayed degeneration after spinal cord injury in rats and monkeys.Nat.Med.3(1),73–76.Di Giovanni,S.,Knoblach,S.M.,Brandoli,C.,Aden,S.A.,Hoffman,E.P.,Faden,A.I.,2003.Gene pro filing in spinal cord injury shows role of cell cycle in neuronal death.Ann.Neurol.53(4),454–468.Esau,C.C.,Monia,B.P.,2007.Therapeutic potential for microRNAs.Adv.Drug Deliv.Rev.59(2–3),101–114.Fig.5.The potential targets of altered miRNAs following SCI.(A)Several apoptotic genes are potential targets of down-regulated miRNAs after SCI.AIF:apoptosis inducing factor.(B)Several anti-apoptotic genes are potential targets of up-regulated miRNAs after SCI.428N.-K.Liu et al./Experimental Neurology 219(2009)424–429Kim,J.,Krichevsky,A.,Grad,Y.,Hayes,G.D.,Kosik,K.S.,Church,G.M.,Ruvkun,G.,2004.Identification of many microRNAs that copurify with polyribosomes in mammalian neurons.Proc.Natl.Acad.Sci.U.S.A.101(1),360–365.Kim,J.,Inoue,K.,Ishii,J.,Vanti,W.B.,Voronov,S.V.,Murchison, E.,Hannon,G., Abeliovich,A.,2007.A microRNA feedback circuit in midbrain dopamine neurons.Science317(5842),1220–1224.Kosik,K.S.,2006.The neuronal microRNA system.Nat.Rev.Neurosci.7(12),911–920. Krichevsky,A.M.,2007.MicroRNA profiling:from dark matter to white matter,or identifying new players in neurobiology.ScientificWorldJournal.7,155–166. Krichevsky,A.M.,King,K.S.,Donahue,C.P.,Khrapko,K.,Kosik,K.S.,2003.A microRNA array reveals extensive regulation of microRNAs during brain development.RNA9(10),1274–1281.Lagos-Quintana,M.,Rauhut,R.,Yalcin,A.,Meyer,J.,Lendeckel,W.,Tuschl,T.,2002.Identification of tissue-specific microRNAs from mouse.Curr.Biol.12(9), 735–739.Lim,L.P.,Lau,N.C.,Garrett-Engele,P.,Grimson, A.,Schelter,J.M.,Castle,J.,Bartel,D.P.,Linsley,P.S.,Johnson,J.M.,2005.Microarray analysis shows that somemicroRNAs downregulate large numbers of target mRNAs.Nature433(7027), 769–773.Liu,X.Z.,Xu,X.M.,Hu,R.,Du,C.,Zhang,S.X.,McDonald,J.W.,Dong,H.X.,Wu,Y.J.,Fan,G.S.,Jacquin,M.F.,Hsu,C.Y.,Choi,D.W.,1997.Neuronal and glial apoptosis aftertraumatic spinal cord injury.J.Neurosci.17(14),5395–5406.Liu,N.,Han,S.,Lu,P.H.,Xu,X.M.,2004.Upregulation of annexins I,II,and V after traumatic spinal cord injury in adult rats.J.Neurosci.Res.77(3),391–401.Liu,N.K.,Zhang,Y.P.,Titsworth,W.L.,Jiang,X.,Han,S.,Lu,P.H.,Shields,C.B.,Xu,X.M., 2006.A novel role of phospholipase A2in mediating spinal cord secondary injury.Ann.Neurol.59(4),606–619.Medina,P.P.,Slack,F.J.,2009.Inhibiting microRNA function in vivo.Nat.Methods6(1), 37–38.Mirnezami,A.H.,Pickard,K.,Zhang,L.,Primrose,J.N.,Packham,G.,2009.MicroRNAs: key players in carcinogenesis and novel therapeutic targets.Eur.J.Surg.Oncol.35(4),339–347.Miska, E.A.,Alvarez-Saavedra, E.,Townsend,M.,Yoshii, A.,Sestan,N.,Rakic,P., Constantine-Paton,M.,Horvitz,H.R.,2004.Microarray analysis of microRNA expression in the developing mammalian brain.Genome Biol.5(9),R68. Nesic,O.,Svrakic,N.M.,Xu,G.Y.,McAdoo,D.,Westlund,K.N.,Hulsebosch,C.E.,Ye,Z., Galante,A.,Soteropoulos,P.,Tolias,P.,Young,W.,Hart,R.P.,Perez-Polo,J.R.,2002.DNA microarray analysis of the contused spinal cord:effect of NMDA receptor inhibition.J.Neurosci.Res.68(4),406–423.Schaefer,A.,O'Carroll,D.,Tan,C.L.,Hillman,D.,Sugimori,M.,Llinas,R.,Greengard,P., 2007.Cerebellar neurodegeneration in the absence of microRNAs.J.Exp.Med.204(7),1553–1558.Weiler,J.,Hunziker,J.,Hall,J.,2006.Anti-miRNA oligonucleotides(AMOs):ammunition to target miRNAs implicated in human disease?Gene Ther.13(6),496–502.429N.-K.Liu et al./Experimental Neurology219(2009)424–429。