商务统计学Ch01PPT课件
- 格式:ppt
- 大小:198.50 KB
- 文档页数:15


现代商务统计学部分课件《现代商务统计学》第一篇总论第一章市场体系与商务统计第一节市场及市场体系一、市场的涵义人们对市场涵义的理解,是随着商务活动内容的不断丰富和发展以及人们认识的不断完善而逐步加深的。
因此,在不同的认识程度上对市场涵义的理解也是不同的。
(一)市场是商品交换的场所这种市场涵义的理解是人们对市场的最早的认识。
显然,这里的市场是一个地域概念。
据我国《易传·系辞下》记载,早在神农氏之世,“日中为市,致天下之民,聚天下之货,交易而退,各得其所”。
这就是我国最原始的市场。
这是一种狭义的理解,狭义的市场是指各种市场主体进行商品买卖的地方或进行商品交换的场所。
如,北京的西单商场、天津的圈业场、上海的中百公司、南京的“金鹰”公司等等。
(二)市场是商品交换和流通的领域,是交换关系的总和。
这种市场涵义的理解,是随着人们认识的不断提高而获得的。
随着社会分工的逐步细化,特别是货币出现以后,商品的生产与交换范围不断扩大,形成了商品的流通过程。
商品从生产领域要转移到消费领域必须经过流通流域。
在流通领域里,商品流通是以货币为媒介的商品交换过程,是商品交换过程连续进行的整体。
任何市场主体的买(卖)总是与其他的市场主体买(卖)连续在一起的,许许多多商品的买卖关系交织在一起,则形成了商品的交换过程和流通全局。
在这种市场涵义的理解中,市场既体现着商品买、卖双方与商务中介的关系,也体现着商务活动的管理机构与商品买、卖双方之间的关系。
(三)市场的实质是商品供求关系的总和这种市场的涵义是从广义角度来理解的。
从广义的角度理解,市场不仅是指商品流通领域,还应紧密联系整个社会再生产过程去分析商品供求关系。
从供求关系角度分析,所有的生产、经营者构成了供给主体,所有的购买者构成了需求主体(生产、经营者在购买商品时,则成为需求主体),供给主体与需求主体之间的关系则构成了市场中的商品供求关系的总和。
供给大于需求则形成买方市场,反之则形成卖方市场。
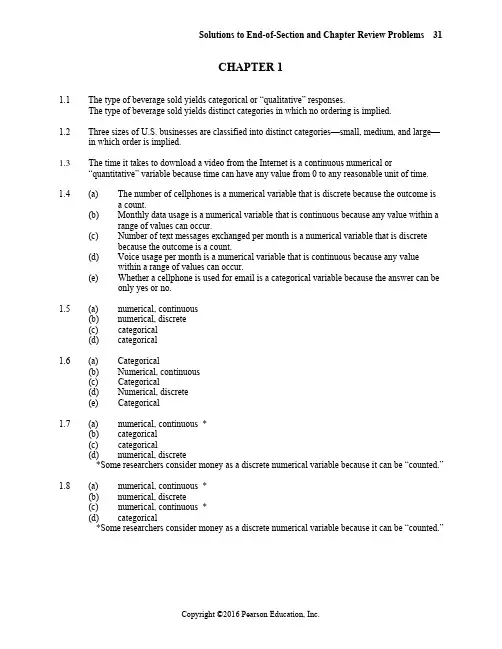
Solutions to End-of-Section and Chapter Review Problems 31CHAPTER 11.1 The type of beverage sold yields categorical or “qualitative” responses.The type of beverage sold yields distinct categories in which no ordering is implied.1.2 Three sizes of U.S. businesses are classified into distinct categories—small, medium, and large—in which order is implied.1.3 The time it takes to download a video from the Internet is a continuous numerical or“quantitative” variable because time can have any value from 0 to any reasonable unit of time.1.4 (a) The number of cellphones is a numerical variable that is discrete because the outcome isa count.(b) Monthly data usage is a numerical variable that is continuous because any value within arange of values can occur.(c) Number of text messages exchanged per month is a numerical variable that is discretebecause the outcome is a count.(d) Voice usage per month is a numerical variable that is continuous because any valuewithin a range of values can occur.(e) Whether a cellphone is used for email is a categorical variable because the answer can beonly yes or no.1.5 (a) numerical, continuous(b) numerical, discrete(c) categorical(d) categorical1.6 (a) Categorical(b) Numerical, continuous(c) Categorical(d) Numerical, discrete(e) Categorical1.7 (a) numerical, continuous *(b) categorical(c) categorical(d) numerical, discrete*Some researchers consider money as a discrete numerical variable because it can be “counted.”1.8 (a) numerical, continuous *(b) numerical, discrete(c) numerical, continuous *(d) categorical*Some researchers consider money as a discrete numerical variable because it can be “counted.”32 Chapter 1: Defining and Collecting Data1.9 (a) Income may be considered discrete if we “count” our money. It may be consideredcontinuous if we “measure” our money; we are only limited by the way a country'smonetary system treats its currency.(b) The first format is preferred because the responses represent data measured on a higherscale.1.10 The underlying variable, ability of the students, may be continuous, but the measuring device, thetest, does not have enough precision to distinguish between the two students.1.11 (a) The population is “all working women from the metropolitan area.” A systematic or randomsample could be taken of women from the metropolitan area. The director might wish tocollect both numerical and categorical data.(b) Three categorical questions might be occupation, marital status, type of clothing.Numerical questions might be age, average monthly hours shopping for clothing, income.1.12 The answer depends on the chosen data set.1.13 The answer depends on the specific story.1.14 The answer depends on the specific story.1.15 The transportation engineers and planners should use primary data collected through anobservational study of the driving characteristics of drivers over the course of a month.1.16 The information presented there is based mainly on a mixture of data distributed by anorganization and data collected by ongoing business activities.1.17 (a) 001 (b) 040 (c) 9021.18 Sample without replacement: Read from left to right in 3-digit sequences and continue unfinishedsequences from end of row to beginning of next row.Row 05: 338 505 855 551 438 855 077 186 579 488 767 833 170Rows 05-06: 897Row 06: 340 033 648 847 204 334 639 193 639 411 095 924Rows 06-07: 707Row 07: 054 329 776 100 871 007 255 980 646 886 823 920 461Row 08: 893 829 380 900 796 959 453 410 181 277 660 908 887Rows 08-09: 237Row 09: 818 721 426 714 050 785 223 801 670 353 362 449Rows 09-10: 406Note: All sequences above 902 and duplicates are discarded.1.19 (a) Row 29: 12 47 83 76 22 99 65 93 10 65 83 61 36 98 89 58 86 92 71Note: All sequences above 93 and all repeating sequences are discarded.(b) Row 29: 12 47 83 76 22 99 65 93 10 65 83 61 36 98 89 58 86Note: All sequences above 93 are discarded. Elements 65 and 83 are repeated.Solutions to End-of-Section and Chapter Review Problems 33 1.20 A simple random sample would be less practical for personal interviews because of travel costs(unless interviewees are paid to attend a central interviewing location).1.21 This is a probability sample because the selection is based on chance. It is not a simple randomsample because A is more likely to be selected than B or C.1.22 Here all members of the population are equally likely to be selected and the sample selectionmechanism is based on chance. But not every sample of size 2 has the same chance ofbeing selected. For example the sample “B and C” is impossible.1.23 (a) Since a complete roster of full-time students exists, a simple random sample of 200students could be taken. If student satisfaction with the quality of campus life randomlyfluctuates across the student body, a systematic 1-in-20 sample could also be taken fromthe population frame. If student satisfaction with the quality of life may differ by genderand by experience/class level, a stratified sample using eight strata, female freshmenthrough female seniors and male freshmen through male seniors, could be selected. Ifstudent satisfaction with the quality of life is thought to fluctuate as much within clustersas between them, a cluster sample could be taken.(b) A simple random sample is one of the simplest to select. The population frame is theregistrar’s file of 4,000 student names.(c) A systematic sample is easier to select by hand from the registrar’s records than asimple random sample, since an initial person at random is selected and then every 20thperson thereafter would be sampled. The systematic sample would have the additionalbenefit that the alphabetic distribution of sampled students’ names would be morecomparable to the alphabetic distribution of student names in the campus population.(d) If rosters by gender and class designations are readily available, a stratified sampleshould be taken. Since student satisfaction with the quality of life may indeed differ bygender and class level, the use of a stratified sampling design will not only ensure allstrata are represented in the sample, it will also generate a more representative sampleand produce estimates of the population parameter that have greater precision.(e) If all 4,000 full-time students reside in one of 10 on-campus residence halls which fullyintegrate students by gender and by class, a cluster sample should be taken. A clustercould be defined as an entire residence hall, and the students of a single randomlyselected residence hall could be sampled. Since each dormitory has 400 students, asystematic sample of 200 students can then be selected from the chosen cluster of 400students. Alternately, a cluster could be defined as a floor of one of the 10 dormitories.Suppose there are four floors in each dormitory with 100 students on each floor. Twofloors could be randomly sampled to produce the required 200 student sample. Selectionof an entire dormitory may make distribution and collection of the survey easier toaccomplish. In contrast, if there is some variable other than gender or class that differsacross dormitories, sampling by floor may produce a more representative sample.34 Chapter 1: Defining and Collecting Data1.24 (a) Row 16: 2323 6737 5131 8888 1718 0654 6832 4647 6510 4877Row 17: 4579 4269 2615 1308 2455 7830 5550 5852 5514 7182Row 18: 0989 3205 0514 2256 8514 4642 7567 8896 2977 8822Row 19: 5438 2745 9891 4991 4523 6847 9276 8646 1628 3554Row 20: 9475 0899 2337 0892 0048 8033 6945 9826 9403 6858Row 21: 7029 7341 3553 1403 3340 4205 0823 4144 1048 2949Row 22: 8515 7479 5432 9792 6575 5760 0408 8112 2507 3742Row 23: 1110 0023 4012 8607 4697 9664 4894 3928 7072 5815Row 24: 3687 1507 7530 5925 7143 1738 1688 5625 8533 5041Row 25: 2391 3483 5763 3081 6090 5169 0546Note: All sequences above 5000 are discarded. There were no repeating sequences.(b) 089 189 289 389 489 589 689 789 889 9891089 1189 1289 1389 1489 1589 1689 1789 1889 19892089 2189 2289 2389 2489 2589 2689 2789 2889 29893089 3189 3289 3389 3489 3589 3689 3789 3889 39894089 4189 4289 4389 4489 4589 4689 4789 4889 4989(c) With the single exception of invoice #0989, the invoices selected in the simplerandom sample are not the same as those selected in the systematic sample. It would behighly unlikely that a random process would select the same units as a systematicprocess.1.25 (a) A stratified sample should be taken so that each of the three strata will be proportionatelyrepresented.(b) The number of observations in each of the three strata out of the total of 1,000 shouldreflect the proportion of the three categories in the customer database. For example,3,500/10,000 = 35% so 35% of 1,000 = 350 customers should be selected from theprospective buyers; similarly 4,500/10,000 = 45% so 450 customers should be selectedfrom the first time buyers, and 2,000/10,000 = 20% so 200 customers from the repeatbuyers.(c) It is not simple random sampling because, unlike the simple random sampling, it ensuresproportionate representation across the entire population.1.26 Before accepting the results of a survey of college students, you might want to know, forexample:Who funded the survey? Why was it conducted? What was the population from which the sample was selected? What sampling design was used? What mode of response was used: a personalinterview, a telephone interview, or a mail survey? Were interviewers trained? Were surveyquestions field-tested? What questions were asked? Were they clear, accurate, unbiased, valid?What operational definition of “vast majority” was used? What was the response rate? What was the sample size?1.27 (a) Possible coverage error: Only employees in a specific division of the company weresampled.(b) Possible nonresponse error: No attempt is made to contact nonrespondents to urge themto complete the evaluation of job satisfaction.(c) Possible sampling error: The sample statistics obtained from the sample will not be equalto the parameters of interest in the population.(d) Possible measurement error: Ambiguous wording in questions asked on thequestionnaire.Solutions to End-of-Section and Chapter Review Problems 35 1.28 The results are based on an online survey. If the frame is supposed to be small business owners,how is the population defined? This is a self-selecting sample of people who responded online, so there is an undefined nonresponse error. Sampling error cannot be determined since this is not a random sample.1.29 Before accepting the results of the survey, you might want to know, for example:Who funded the study? Why was it conducted? What was the population from which the sample was selected? What was the frame being used? What sampling design was used?What mode of response was used: a personal interview, a telephone interview, or a mail survey?Were interviewers trained? Were survey questions field-tested? What other questions wereasked? Were they clear, accurate, unbiased, and valid? What was the response rate? What was the margin of error? What was the sample size?1.30 Before accepting the results of the survey, you might want to know, for example: Who funded thestudy? Why was it conducted? What was the population from which the sample was selected?What sampling design was used? What mode of response was used: a personal interview, atelephone interview, or a mail survey? Were interviewers trained? Were survey questions field-tested? What other questions were asked? Were the questions clear, accurate, unbiased, andvalid? What was the response rate? What was the margin of error? What was the sample size?What frame was used?1.31 A population contains all the items of interest whereas a sample contains only a portion of theitems in the population.1.32 A statistic is a summary measure describing a sample whereas a parameter is a summary measuredescribing an entire population.1.33 Categorical random variables yield categorical responses such as yes or no answers. Numericalrandom variables yield numerical responses such as your height in inches.1.34 Discrete random variables produce numerical responses that arise from a counting process.Continuous random variables produce numerical responses that arise from a measuring process.1.35 Items or individuals in a probability sampling are selected based on known probabilities whileitems or individuals in a nonprobability samplings are selected without knowing theirprobabilities of selection.1.36 Microsoft Excel could be used to perform various statistical computations that were possible onlywith a slide-rule or hand-held calculator in the old days.1.37 (a) The population of interest was 18-54 year olds who currently own a smartphone and/ortablet, and who use and do not use these devices to shop.(b) The sample was the 1,003 18-54 year olds who currently own a smartphone and/or tablet,who use and do not use these devices to shop, and who responded to the study.(c) A parameter of interest is the proportion of all tablet users in the population who use theirdevice to purchase product and services.(d) A statistic used to estimate the parameter of interest in (c) is the proportion of tablet usersin the sample who use their device to purchase product and services.36 Chapter 1: Defining and Collecting Data1.38 The answers to this question depend on which article and its corresponding data set is beingselected.1.39 (a) The population of interest was supply chain executives in a wide range of industriesrepresenting a mix of company sizes from across three global regions: Asia, Europe, andthe Americas.(b) The sample was the 503 supply chain executives in a wide range of industriesrepresenting a mix of company sizes from across three global regions: Asia, Europe, andthe Americas surveyed by PwC from May to July 2012.(c) A parameter of interest is the proportion of supply chain executives in the populationwho acknowledge that supply chain is seen as a strategic asset in their company.(d) A statistic used to estimate the parameter of interest in (c) is the proportion of supplychain executives in the sample who acknowledge that supply chain is seen as a strategicasset in their company.1.40 The answers to this question depend on which data set is being selected.1.41 (a) Categorical variable: Which of the following best describes this firm’s primary business?(b) Numerical variable: On average, what percent of total monthly revenues are e-commercerevenues?1.42 (a) The population of interest was the collection of all the 10,000 benefitted employees at theUniversity of Utah when the study was conducted.(b) The sample consisted of the 3,095 benefitted employees participated in the study.(c) gender: categorical; age: numerical; education level: numerical; marital status:categorical; household income: numerical; employment category: categorical1.43 (a) (i)categorical (iii) numerical, discrete(ii)categorical (iv) categorical(b) The answers will vary.(c) The answers will vary.。