图表描述英文表达 PPT
- 格式:ppt
- 大小:2.05 MB
- 文档页数:42
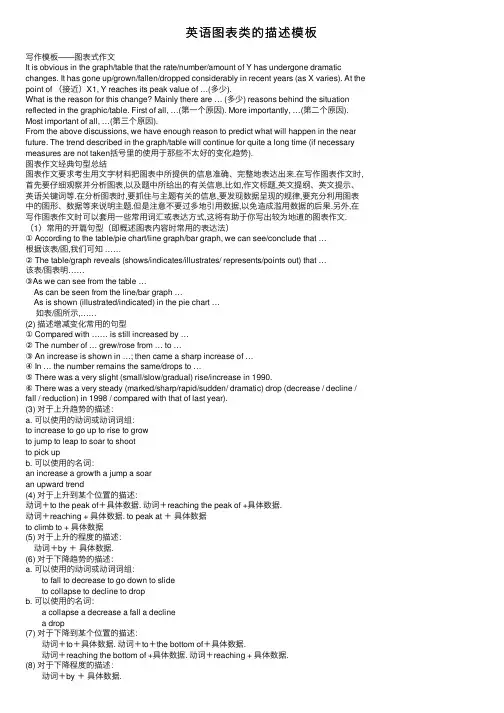
英语图表类的描述模板写作模板——图表式作⽂It is obvious in the graph/table that the rate/number/amount of Y has undergone dramatic changes. It has gone up/grown/fallen/dropped considerably in recent years (as X varies). At the point of (接近)X1, Y reaches its peak value of …(多少).What is the reason for this change? Mainly there are … (多少) reasons behind the situation reflected in the graphic/table. First of all, …(第⼀个原因). More importantly, …(第⼆个原因). Most important of all, …(第三个原因).From the above discussions, we have enough reason to predict what will happen in the near future. The trend described in the graph/table will continue for quite a long time (if necessary measures are not taken括号⾥的使⽤于那些不太好的变化趋势).图表作⽂经典句型总结图表作⽂要求考⽣⽤⽂字材料把图表中所提供的信息准确、完整地表达出来.在写作图表作⽂时,⾸先要仔细观察并分析图表,以及题中所给出的有关信息,⽐如,作⽂标题,英⽂提纲、英⽂提⽰、英语关键词等.在分析图表时,要抓住与主题有关的信息,要发现数据呈现的规律,要充分利⽤图表中的图形、数据等来说明主题.但是注意不要过多地引⽤数据,以免造成滥⽤数据的后果.另外,在写作图表作⽂时可以套⽤⼀些常⽤词汇或表达⽅式,这将有助于你写出较为地道的图表作⽂.(1)常⽤的开篇句型(即概述图表内容时常⽤的表达法)① According to the table/pie chart/line graph/bar graph, we can see/conclude that …根据该表/图,我们可知 ……② The table/graph reveals (shows/indicates/illustrates/ represents/points out) that …该表/图表明……③As we can see from the table … As can be seen from the line/bar graph … As is shown (illustrated/indicated) in the pie chart … 如表/图所⽰,……(2) 描述增减变化常⽤的句型① Compared with …… is still increased by …② The number of … grew/rose from … to …③ An increase is shown in …; then came a sharp increase of …④ In … the number remains the same/drops to …⑤ There was a very slight (small/slow/gradual) rise/increase in 1990.⑥ There was a very steady (marked/sharp/rapid/sudden/ dramatic) drop (decrease / decline / fall / reduction) in 1998 / compared with that of last year).(3) 对于上升趋势的描述:a. 可以使⽤的动词或动词词组:to increase to go up to rise to growto jump to leap to soar to shootto pick upb. 可以使⽤的名词:an increase a growth a jump a soaran upward trend(4) 对于上升到某个位置的描述:动词+to the peak of+具体数据. 动词+reaching the peak of +具体数据.动词+reaching + 具体数据. to peak at +具体数据to climb to + 具体数据(5) 对于上升的程度的描述: 动词+by +具体数据.(6) 对于下降趋势的描述:a. 可以使⽤的动词或动词词组: to fall to decrease to go down to slide to collapse to decline to dropb. 可以使⽤的名词: a collapse a decrease a fall a decline a drop(7) 对于下降到某个位置的描述: 动词+to+具体数据. 动词+to+the bottom of+具体数据. 动词+reaching the bottom of +具体数据. 动词+reaching + 具体数据.(8) 对于下降程度的描述: 动词+by +具体数据.(9) 对于平稳的趋势的描述: 可以使⽤的动词或动词词组: to hardly change to have little change to keep steady to level off to remain constant to stay the same(10) 表⽰程度的副词: 1. 程度较⼤: considerably dramatically greatly markedly obviously quickly rapidly sharply significantly suddenly 2. 程度较⼩: slightly gradually slowly steadily(11) 时间的嵌⼊ 嵌⼊时间时所使⽤的介词和介词词组: from……to…… between…….and…… during……and……at the start of …… by the end of …… over ……at the end of …… throughout ……(12) 上升和下降趋势的组合描述1. 先上升后下降的句型:... increased slowly during… and … but fell sharply in …A steady fall in …… during …… and …… followed the sharp increase in …….2. 先下降后上升的句型:… fell before …… began to make a recovery ……… continue the recovery, climbing to ……… dropped during …… but increased again in ……… fell and then pick up during ……… collapsed before rising to ……at the end of ……3. 起伏波动的句型:… fluctuated sharply all through ……4. 波动不⼤的句型:… hardly changed through the period between …and …。


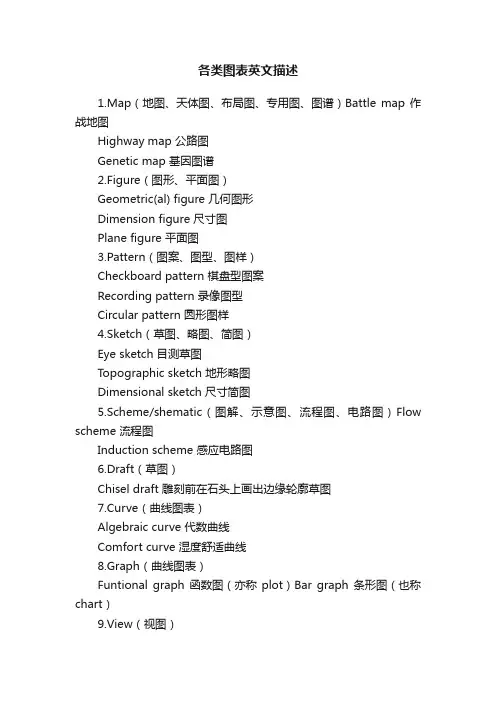
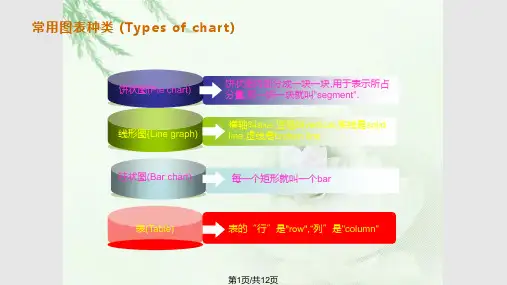
各类图表英文描述1.Map(地图、天体图、布局图、专用图、图谱)Battle map 作战地图Highway map 公路图Genetic map 基因图谱2.Figure(图形、平面图)Geometric(al) figure 几何图形Dimension figure 尺寸图Plane figure 平面图3.Pattern(图案、图型、图样)Checkboard pattern 棋盘型图案Recording pattern 录像图型Circular pattern 圆形图样4.Sketch(草图、略图、简图)Eye sketch 目测草图Topographic sketch 地形略图Dimensional sketch 尺寸简图5.Scheme/shematic(图解、示意图、流程图、电路图)Flow scheme 流程图Induction scheme 感应电路图6.Draft(草图)Chisel draft 雕刻前在石头上画出边缘轮廓草图7.Curve(曲线图表)Algebraic curve 代数曲线Comfort curve 湿度舒适曲线8.Graph(曲线图表)Funtional graph 函数图(亦称plot)Bar graph 条形图(也称chart)9.View(视图)Plane view 平面视图10.Geometry(几何图)Plane geometry 平面几何Solid geometry 立体几何图11.Chart(航海图、图表)Aeronautical chart 领航图Demographic data chart 人口统计图表Pie chart 饼图Bar chart 柱图12.Drawing(工程图、插图)Drawing 建筑图Explanatory drawing 说明(插)图/doc/ec18558506.html,yout(布局图、规划图)1、图形种类及概述法:泛指一份数据图表:a data graph(曲线图)/chart/diagram/illustration/table饼图:pie chart直方图或柱形图:bar chart/histogram趋势曲线图:line chart/curve diagram表格图:table流程图或过程图:flow chart/sequence diagram程序图:processing/procedures diagram2、常用的描述用法The table/chart diagram/graph shows (that)According to the table/chart diagram/graphAs (is)shown in the table/chart diagram/graphAs can be seen from the table/chart/diagram/graph/figures,figures/statistics shows (that)……It can be seen from the figures/statisticsWe can see from the figures/statisticsIt is clear from the figures/statisticsIt is apparent from the figures/statisticstable/chart/diagram/graph figures (that)……table/chart/diagram/graph shows/describes/illustrates3、图表中的数据(Data)具体表达法数据(Data)在某一个时间段固定不变:fixed in time在一系列的时间段中转变:changes over time持续变化的data在不同情况下:增加:increase/raise/rise/go up ……减少:decrease/grow down/drop/fall ……波动:fluctuate/rebound/undulate/wave ……稳定:remain stable/stabilize/level off ……二、相关常用词组1、主章开头图表类型:table(表格)、chart(图表)、diagram(图标)、graph (多指曲线图)、column chart(柱状图)、pie graph(饼图)、tree diagram(树形图)描述:show、describe、illustrate、can be seen from、clear、apparent、reveal、represent内容:figure、statistic、number、percentage、proportion 2、表示数据变化的单词或者词组rapid/rapidly 迅速的,飞快的,险峻的dramatic/dramatically 戏剧性的,生动的significant/significantly 有意义的,重大的,重要的sharp/sharply 锐利的,明显的,急剧的steep/steeply 急剧升降的steady/steadily 稳固的,坚定不移的gradual/gradually 渐进的,逐渐的。


今天我们所要关注的是运动图表,无论是什么题目的运动图表,无论题出的多难,我们都要清醒的认识到,那就是考官也逃不出如下的5个范畴,它们分别是运动范畴,程度范畴,时间范畴,数据范畴与连接范畴。
(一)运动范畴中存在着如下的8种运动趋向:1、保持平稳:我们可以使用的套用结构有: stay stable/ remain steady举例:表示人口数量保持平稳的时候可以写: the number of population stayed stable。
/the number of population remained steady2、上升/增加:我们可以使用的套用结构有:rise/ climb/ increase/ ascend/mount/aggrandize(增加)举例:人口上升:the number of population increased/ascended/mounted等等。
3、下降/减少:我们可以使用的套用结构有:fall/ drop/ decrease/ descend/ decline举例:人口减少:the number of population decreased/ declined4、下降后保持平稳:这个线段前面是向下的,后面是平的,在表示这个平的时候我们就不可以使用remain steady了,我们要使用的结构是bottom out举例:人口下降后保持平稳:the number of population decreased and bottomed out5、上升后保持平稳:前面的上升我们就不用说了,但是在上升以后保持平稳,我们需要使用level off举例:人口上升后保持平稳:number of population mounted and leveled off6、复苏: 前面下降了以后,然后就上升了,这两条线段的连接点就叫复苏.英语中表达为recover举例:人口下降后复苏:number of population decreased and recovered7、波动:就像我们的心电图一样.英语中叫fluctuate 举例:人口波动:number of population fluctuated8、达到顶峰:peak/ reach its summit/reach its zenith举例:人口到达了顶峰:number of population peaked/ reached its summit/ reached its zenith但是同学们想过没有上升,下降,波动是存在程度的。