会计学原理-约翰·J·怀尔德版-上海交通大学-10
- 格式:ppt
- 大小:1.82 MB
- 文档页数:74
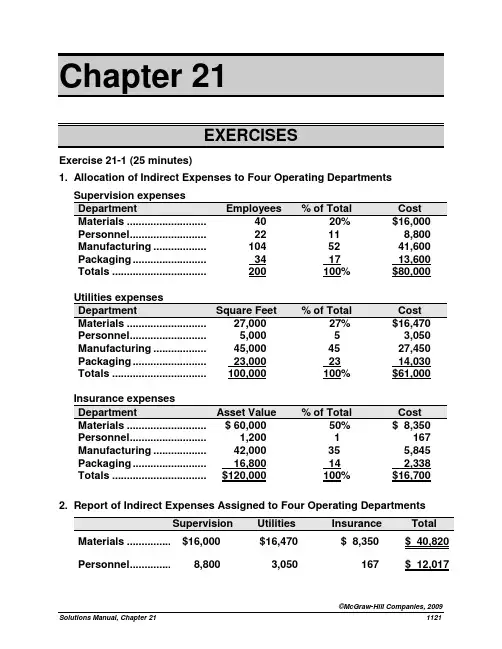
Chapter 21Exercise 21-1 (25 minutes)1. Allocation of Indirect Expenses to Four Operating DepartmentsPersonnel ..............................22 11 8,800 Manufacturing ......................104 52 41,600 Packaging ............................. 34 17 13,600 Totals ....................................200 100% $80,000Personnel ..............................5,000 5 3,050 Manufacturing ......................45,000 45 27,450 Packaging ............................. 23,000 23 14,030 Totals ....................................100,000 100% $61,000Personnel ..............................1,200 1 167 Manufacturing ......................42,000 35 5,845 Packaging ............................. 16,800 14 2,338 Totals ....................................$120,000 100% $16,700 2. Report of Indirect Expenses Assigned to Four Operating DepartmentsMaterials ...................$16,000 $16,470 $ 8,350 $ 40,820 Personnel ..................8,800 3,050 167 $ 12,017Manufacturing ..........41,600 27,450 5,845 $ 74,895 Packaging ................. 13,600 14,030 2,338 $ 29,968 Totals ........................$80,000 $61,000 $16,700 $157,700Exercise 21-2 (30 minutes)........................Depreciation ......................56,600 2,000 MH $28.30 per machine hour Line preparation ...............46,000250 setups $184.00 per setup1. Assignment of overhead costs to the two products using ABCMachinery depreciation ......... 500 hours $ 28.30 14,150 Line preparation ..................... 40 setups $184.00 7,360 Total overhead assigned ....... $23,340Machinery depreciation ......... 1,500 hours $ 28.3042,450 Line preparation ..................... 210 setups $184.00 38,640 Total overhead assigned ....... $84,660Direct labor .................................. 12,200 23,800 Overhead (using ABC) ................ 23,340 84,660 Total cost ..................................... $54,540 $151,660 Quantity produced ...................... 10,500 ft. 14,100 ft. Average cost per foot (ABC) ....... $5.19 $10.763. The average cost of rounded edge shelves declines and the average cost of squared edge shelves increases. Under the current allocation method, the rounded edge shelving was allocated 34% of all of the overhead cost ($12,200 direct labor/$36,000 total direct labor). However, it does not use 34% of all of the overhead resources. Specifically, it uses only 25% of machine hours (500 MH/2,000 MH), and 16% of the setups (40/250). Activity based costing allocated the individual overhead components in proportion to the resources used.Exercise 21-7 (15 minutes)(1) Items included in performance reportThe following items definitely should be included in the performance report for the auto service department manager because they are controlled or strongly influ enced by the manager’s decisions and activities:•Sales of parts•Sales of services•Cost of parts sold•Supplies•Wages (hourly)(2) Items excluded from performance reportThe following items definitely should be excluded from the performance report because the department manager cannot control or strongly influence them:•Building depreciation•Income taxes allocated to the department•Interest on long-term debt•Manager’s salary(3) Items that may or may not be included in performance reportThe following items cannot be definitely included or definitely excluded from the performance report because they may or may not be completely under the manager’s control or strong influence:•Payroll taxes Some portion of this expense relates to themanager’s salary and i s not controllable by themanager. The portion that relates to hourly wagesshould be treated as a controllable expense.•Utilities Whether this expense is controllable depends on thedesign of the auto dealership. If the auto servicedepartment is in a separate building or has separateutility meters, these expenses are subject to themanager’s control. Otherwise, the expense probablyis not controllable by the manager of the auto servicedepartment.Exercise 21-9 (20 minutes)(1)Electronics ...................$750,000 $3,750,000 20% Sporting Goods ...........800,000 5,000,000 16% Comment: Its Electronics division is the superior investment center on the basis of the investment center return on assets.Exercise 21-9 (continued)(2)Net income ...................$750,000 $800,000 Target net income$3,750,000 x 12% ...... 5,000,000 x 12% .......(450,000)(600,000)Residual income……. $300,000 $200,000Comment: Its Electronics division is the superior investment center on the basis of investment center residual income.(3) The Electronics division should accept the new opportunity, since it will generate residual income of 3% (15% - 12%) of the i nvestment’s invested assets.Exercise 21-10 (15 minutes)Electronics ...................$750,000 $10,000,000 7.50% Sporting Goods ...........800,000 8,000,000 10.0%Electronics ...................$10,000,000 $3,750,000 2.67 Sporting Goods ...........8,000,000 5,000,000 1.6 Comments: Its Sporting goods division generates the most net income per dollar of sales, as shown by its higher profit margin. The Electronics division however is more efficient at generating sales from invested assets, based on its higher investment turnover.Problem 21-1A (60 minutes)Part 1Average occupancy cost = $111,800 / 10,000 sq. ft. = $11.18 per sq. ft. Occupancy costs are assigned to the two departments as followsLanya’s Dept................. 1,000 $11.18 $11,180 Jimez’s Dept................. 1,700 $11.18 $19,006**A total of $30,186 ($11,180 + $19,006) in occupancy costs is charged to these departments. The company would follow a similar approach in allocating the remaining occupancy costs ($81,614, computed as $111,800 - $30,186) to its other departments (not shown in this problem).Part 2Market rates are used to allocate occupancy costs for depreciation, interest, and taxes. Heating, lighting, and maintenance costs are allocated to the departments on both floors at the average rate per square foot. These costs are separately assigned to each class as follows:Depreciation—Building .................$ 31,500 $31,500 Interest—Building mortgage .........47,000 47,000Taxes—Building and land .............14,000 14,000Gas (heating) expense ...................4,425 $ 4,425 Lighting expense ...........................5,250 5,250 Maintenance expense .................... 9,625 ______ 9,625 Total ................................................$111,800 $92,500 $19,300Value-based costs are allocated to departments in two stepsSecond floor ...................5,000 10 50,000Total market value .........$250,000Second floor ................... 50,000 20 18,500 3.70Totals ..............................$250,000 100% $92,500Usage-based costs allocation rate = $19,300 / 10,000 sq. ft.= $1.93 per sq. ft.We can then compute total allocation rates for the floors$16.73 Second floor ........................... 3.70 1.93 $ 5.63 These rates are applied to allocate occupancy costs to departmentsLanya’s Department......................... 1,000 $16.73 $16,730 Jimez’s Department......................... 1,700 5.63 $ 9,571Part 3A second-floor manager would prefer allocation based on market value. This is a reasonable and logical approach to allocation of occupancy costs. The current method assumes all square footage has equal value. This is not logical for this type of occupancy. It also means the second-floor space would be allocated a larger portion of costs under the current method, but less using an allocation based on market value.Part 1Professional salaries ..................$1,600,000 10,000 hours $160 per hour Patient services & supplies .......$ 27,000 600 patients $45 per patient Building cost ...............................$ 150,000 1,500 sq. ft. $100 per sq. ft. Total costs ...................................$1,777,000Part 2Allocation of cost to the surgical departments using ABCProfessional salaries ............. 2,500 hours $160 per hr. $400,000 Patient services & supplies ...... 400 patients $45 per patient 18,000 Building cost .......................... 600 sq. ft. $100 per sq. ft. 60,000 Total ...............................................................................................$478,000 Average cost per patient ...............................................................$ 1,195Professional salaries ............. 7,500 hours $160 per hr. $1,200,000 Patient services & supplies ...... 200 patients $45 per patient 9,000 Building cost .......................... 900 sq. ft. $100 per sq. ft 90,000 Total ................................................................................................$1,299,000 Average cost per patient ...............................................................$ 6,495[Note that the sum of the amounts allocated to General Surgery and Orthopedic Surgery ($478,000 + $1,299,000) equals the total amount of indirect costs ($1,777,000).] Part 3If all center costs were allocated on the number of patients, the average cost of general surgery would increase. Since general surgery sees 2/3 of all patients (400/600), it would get allocated 2/3 of all center costs. Orthopedic surgery is currently consuming more professional salaries and building space than general surgery, but has fewer patients.Problem 21-3A (70 minutes)Cost of goods sold ........................ 89,964 63,612 27,500 181,076 (2) Gross profit .................................... 93,636 38,988 22,500 155,124 Direct expensesSales salaries ............................... 21,000 7,100 8,500 36,600Advertising ................................... 2,100 700 1,100 3,900Store supplies used .................... 594 378 400 1,372 (3) Depreciation of equipment ......... 2,300 900 1,000 4,200Total direct expenses .................. 25,994 9,078 11,000 46,072 Allocated expensesRent expense ............................... 5,632 2,835 2,353 10,820 (4) Utilities expense .......................... 2,292 1,153 955 4,400 (4) Share of office dept. expenses ... 15,288 8,540 4,172 28,000 (5) Total allocated expenses ............ 23,212 12,528 7,480 43,220 Total expenses ............................... 49,206 21,606 18,480 89,292Net income ..................................... $ 44,430 $17,382 $ 4,020 $ 65,832 Supporting Computations—coded (1) through (5) in statement aboveGrowth rate (8% increase) ............... x 108% x 108%2010 sales ......................................... $183,600 $102,600 $ 50,000Growth rate (8% increase) ............... x 108% x 108% x 55%* 2010 cost of goods sold .................. $ 89,964 $ 63,612 $ 27,500 A LTERNATIVELY2009 cost of goods sold .................. $ 83,300 $ 58,9002009 sales ......................................... $170,000 $ 95,0002009 cost as % of sales ................... 49% 62%2010 sales ........................................ $183,600 $102,600 $ 50,000 2010 cost as % of sales .................. x 49% x 62% x 55%* 2010 cost of goods sold .................. $ 89,964 $ 63,612 $ 27,500 * T he 55% cost of goods sold percent is computed as 100% minus the predicted 45% gross profit margin.Growth rate (8% increase) ................x 108% x 108%2010 store supplies ..........................$ 594 $ 378 $ 400One-fifth from clock to paintings (1,408) $ 1,408 One-fourth from mirror topaintings ______ (945) 945 2010 allocation of $10,820 rent .........$ 5,632 $ 2,835 $ 2,353 Percent of total * ...............................2010 allocation of $4,400total utilities ....................................$ 2,292 $ 1,153 $ 955Percent of total sales * ......................54.6% 30.5% 14.9% 2010 allocation of $28,000total office departmentexpenses ($20,000 in 2009plus $8,000 increase) ......................$ 15,288 $ 8,540 $ 4,172 * Instructor note: If students round to something other than one-tenth of a percent, theirnumbers will slightly vary.Part 1a.Responsibility Accounting Performance ReportManager, Camper DepartmentFor the YearBudgeted Actual Over (Under)Amount Amount Budget Controllable CostsRaw materials .................................$195,900 $194,800 $ (1,100) Employee wages ............................104,200 107,200 3,000 Supplies used .................................34,000 32,900 (1,100) Depreciation—Equipment ............. 63,000 63,000 0 Totals ..............................................$397,100 $397,900 $ 800b.Responsibility Accounting Performance ReportManager, Trailer DepartmentFor the YearBudgeted Actual Over (Under)Amount Amount Budget Controllable CostsRaw materials .................................$276,200 $273,600 $ (2,600) Employee wages ............................205,200 208,000 2,800 Supplies used .................................92,200 91,300 (900) Depreciation—Equipment ............. 127,000 127,000 0 Totals ..............................................$700,600 $699,900 $ (700)c.Responsibility Accounting Performance ReportManager, Ohio PlantFor the YearBudgeted Actual Over (Under)Amount Amount Budget Controllable CostsDept. manager salaries ................. $ 97,000 $ 98,700 $ 1,700 Utilities ........................................... 8,800 9,200 400 Building rent .................................. 15,700 15,500 (200) Other office salaries ..................... 46,500 30,100 (16,400) Other office costs ......................... 22,000 21,000 (1,000) Camper department ...................... 397,100 397,900 800 Trailer department ........................ 700,600 699,900 (700) Total ............................................... $1,287,700 $1,272,300 $(15,400)Part 2The plant manager did a good job of controlling costs and meeting the budget. He came in under budget for the plant even though he paid the department managers more than budgeted and had to absorb the amounts over budget in their departments. This is because he spent less than the budget amount on building rent, other office salaries, and other office costs. The Trailer Department manager also came in under budget. The Camper Department manager came in over budget, and thus performed the worse of the three managers.Problem 21-1B (60 minutes)Part 1Average occupancy cost = $372,000 / 20,000 sq. ft. = $18.60 per sq. ft.Occu pancy costs are assigned to Miller’s department as followsMiller’s Dept.................. 2,000 $18.60 $37,200Part 2Market rates are used to allocate occupancy costs for the building rent. Lighting and cleaning costs are allocated to the departments on all three floors at the average rate per square foot. Costs assigned to each class are:Lighting expense ................... 20,000 $20,000 Cleaning expense .................. 32,000 _______ 32,000 Totals ...................................... $372,000 $320,000 $52,000Value-based costs are allocated in two steps(i) Compute market value of each floorSecond floor ...................7,500 24 180,000Basement floor ...............5,000 12 60,000Total market value .........$600,000Problem 21-1B (Continued)(ii) Allocate the $320,000 to each floor based on its percent of market valueSecond floor ...................180,000 30 96,000 12.80 Basement floor ............... 60,000 10 32,000 6.40$600,000 100% $320,000Usage-based costs allocation rate = $52,000 / 20,000 sq. ft.= $2.60 per sq. ft.Total allocation rates for the departments on all three floors areSecond floor .................12.80 2.60 15.40Basement floor ............. 6.40 2.60 9.00These rates are applied to alloc ate occupancy costs to Miller’s departmentMiller’s Department ................................2,000 $9.00 $18,000Part 3A basement manager would prefer the allocation based on market value. This is a reasonable and logical approach to allocation of occupancy costs. With a flat rate method, all square footage has equal value. This is not logical for this type of occupancy. Less cost would be allocated to the basement departments if the market value method were used.。

约翰怀尔德会计学原理全文共四篇示例,供读者参考第一篇示例:约翰怀尔德(John Wild)是一位著名的会计学家,他对会计学原理的研究和贡献被广泛认可。
他在他的著作中系统地探讨了会计学的基本原理和理论,帮助人们更好地理解和应用会计学知识。
会计学原理是会计学的基础,是会计科学的根本。
约翰怀尔德在他的著作中详细阐述了会计学原理的重要性,并提出了许多深刻的见解。
他指出,会计学原理是指导会计学实践的准则和规则,其作用是维护会计学的准确性、可靠性和公正性。
在他的著作中,约翰怀尔德强调了会计学原理在企业经营管理中的重要性。
他认为,只有建立在正确的会计学原理基础之上的会计信息才能为企业决策提供准确的参考。
他还指出,遵循正确的会计学原理可以帮助企业提高内部管理效率,加强企业的风险控制能力,提高企业的经营绩效。
约翰怀尔德的著作对会计学原理的研究和理解做出了重要贡献。
他的思想为会计学界和企业管理者提供了宝贵的启示,对促进会计学的发展和提升会计学的实践水平具有重要意义。
希望更多的人可以关注会计学原理的研究,深入理解和应用约翰怀尔德等会计学家的研究成果,为企业的可持续发展和社会的进步做出更大的贡献。
第二篇示例:约翰·怀尔德是一位著名的会计学家,他对会计学原理的研究和贡献被誉为经济学领域的里程碑之一。
怀尔德的研究不仅深刻地影响了当代会计学的发展,也为未来的学者们提供了重要的启示。
本文将对怀尔德的会计学原理进行介绍和分析。
怀尔德认为,会计学原理是会计学的基础,是会计学家应该遵循的核心准则。
在怀尔德看来,会计学原理主要包括:货币计量、持续经营、历史成本、收入确认、费用匹配等几个方面。
这些原则不仅是会计师在日常工作中的行为准则,也是保障会计信息质量和经济运作有序的重要基础。
货币计量原则是指所有的财务信息应该用货币单位进行衡量和记录。
怀尔德认为,货币单位是衡量财务状况和经营业绩的唯一标准,只有将所有的资产、负债、收入和支出都转化为货币单位,才能使这些信息具有可比性和可信度。

会计学入门读物哪本比较好?会计学入门读物哪本比较好?会计学入门读物哪本比较好?国内的教材感觉都比较枯燥,为了提高对此学科的兴趣,暂且决定先从国外的教材开始入门。
我自己也查阅到了一些国外的会计学教材,我先列举自己查阅到的书籍,还请会计界的各位前辈帮我做些参考。
《会计学原理》作者:约翰·J.怀尔德(貌似这两个版本是一样的,好像就是中英文的区别?)《会计学原理》韦安特《会计学》查尔斯·T·亨格瑞《会计学》查尔斯·T·亨格瑞(这两个貌似是先后版本不同,但价格差距很大,第8版是59.3,第六版是119.5,这是怎么回事?)《财务会计教程》查尔斯·T·亨格瑞《会计学基础》罗伯特·N.安东尼(这个好像也是版本相同,只是中英文的区别?)《会计学:数字意味着什么》戴维?马歇尔(这个好像也是版本相同,只是中英文的区别?)请教各位会计界的前辈以上哪本作为会计学的入门读物更好?如果还有更好的书籍作为会计学的入门读物还请各位前辈推荐指教,先谢过!(本人非专业人士!)(注:本人不是为了考证,我只是想对此学科入门之前,先提高对此学科的兴趣,而后系统性的对此学科有所认知。
因此,我非常需要一个趣味性较强而又在知识上综合连贯的书或教材或者是一份书单,谢谢!)会计学入门读物哪本比较好?国内的教材感觉都比较枯燥,为了提高对此学科的.兴趣,暂且决定先从国外的教材开始入门。
我自己也查阅到了一些国外的会计学教材,我先列举自己查阅到的书籍,还请会计界的各位前辈帮我做些参考。
《会计学原理》作者:约翰·J.怀尔德工商管理经典译丛?会计与财务系列:会计学原理(第19版)/约翰?J?怀尔德 (John J.Wild)-图书<="" bdsfid="102" i="">普通高等教育"十一五"国家级规划教材?教育部高校工商管理类教材指导委员会双语教学推荐教材?工商管理经典教材?会计与财务系列?会计学原理(第19版)(英文版)/崔学刚<="" bdsfid="104" i=""> (貌似这两个版本是一样的,好像就是中英文的区别?)《会计学原理》韦安特会计学原理(附光盘1张)/韦安特<="" bdsfid="109" i="">《会计学》查尔斯·T·亨格瑞会计学(第8版)/查尔斯·T·亨格瑞(Charles T.Horngren)-图书<=""bdsfid="113" i="">《会计学》查尔斯·T·亨格瑞会计学(第6版)(套装上下册)/享格瑞<="" bdsfid="116" i=""> (这两个貌似是先后版本不同,但价格差距很大,第8版是59.3,第六版是119.5,这是怎么回事?)《财务会计教程》查尔斯·T·亨格瑞财务会计教程(第8版)/亨格瑞<="" bdsfid="120" i="">。


Accounting terms会计术语Accounting; account; accountant; CPA, CMA, CIA, CB, CFE; financial accounting; managerial accounting; auditor; internal control; financial management; bookkeeping recordkeeping;会计;账户;会计师;注册会计师,注册管理会计师,注册内部审计师,注册簿记员,注册舞弊检查员;财务会计,管理会计,审计员,内部控制;财务管理;记账;记录;R&D, Research & Development; HR Human Resource; distribution; logistics; marketing; Not-for-profit organization; shareholder; stakeholder; lender; creditor; debtors; supplier; customer; regulator; legislator; board of director; broker; mortgage; wholesaler, retailer; merchandiser; manufacturer; services; consignor; consignee; Entrepreneur, entrepreneurship; sole proprietorship; partnership; corporation; common stock or ordinary share; preferred stock or preference share; corporate governance system; limited company; SOE:state-owned enterprise; SME:small and medium sized enterprise;研发、研发、人力资源;分配;物流;销售;非营利组织;股东;利益相关者;出借人;债权人,债务人;供应商;客户;监管;立法;董事会;代理;抵押贷款;批发商、零售商,推销商,制造商,服务,发货人,收货人,企业家,企业家能力;个人独资,合伙企业;企业;普通股或普通股,优先股或优先股;公司治理系统;有限公司;国有企业,中小企业,Financial statement; financial report; footnotes to financial statement; interim financial statement; annual, semiannually, quarterly, monthly financial statement; balance sheet; income statement; cash flow statement; statement of owner’s equity; cla ssified financial statement; pro forma financial statements; unadjusted trial balance; adjusted trial balance; post-closing trial balance; book; journal; ledger; general journal; specific journal; general ledger; subsidiary ledger; chart of accounts; double-entry accounting; working papers; work sheet;财务报表、财务报告、财务报表附注;中期财务报表,年度,每半年、季度、月度财务报表,资产负债表,损益表,现金流量表,所有者权益表;财务报表分类;形式上的财务报表;调整前试算表,调整后试算表,结帐后试算表;账簿;日记账;分类账;一般日记账;特定日记账,总账、明细分类帐;会计科目表;复式会计;工作底稿;工作表;Accounting ethics; accounting fraud, scandal; bogus accounting report; accounting oversight; stringent internal control; accounting principle, assumption, and standard; social responsibility; FASB, GAAP, SEC, IASB, IFRS; general principle, specific principles; cash basis accounting; accrual basis accounting; cost principle; revenue reorganization principle; matching principle; materiality constraint (cost-to-benefit constraint); full disclosure principle; going-concern assumption; monetary unit assumption; time period assumption (periodicity assumption) ; business entity assumption; consistency concept; conservatism constraint; lower of cost or market; LIFO conformity rule;会计道德;会计欺诈,丑闻,虚假的会计报告;会计监督;严格的内部控制,会计原则,假设,和标准;社会责任;财务会计准则委员会,公认会计准则,证券交易委员会,国际会计准则委员会,国际财务报告准则;一般原则,具体原则;收付实现制;权责发生制会计;成本原则;收入确认原则,配比原则;物质性约束(效益成本约束);全面披露原则,持续经营假设;货币计量假设;会计分期假设(周期性假设);会计主体假设;一致性概念;保守主义约束;降低成本或市场;后进先出一致性规则;Accounting cycle; operating cycle; accounting documents; source documents; sales tickets; checks; purchase orders; bills; invoice; cash register; money and any medium of exchange; deposit; money orders; promissory note; written promise; Asset; tangible asset; intangible asset; liability; owner’s equity; revenue; expense; profit; current asset; non-current asset; fixed asset; plant and equipment; cash discount; cost of goods sold; credit memorandum; credit period; credit terms; debit memorandum; discount period; EOM (end of month); FOBshipping point; FOB destination; general and administrative expenses; gross margin; inventory; list price; multiple-step income statement; periodic inventory system; perpetual inventory system; purchase return and allowance; shrinkage; supplementary records; trade discount; damage and loss in transit; transportation-in,transportation-out; itemized cost; physical count; deterioration;会计循环;营业周期;会计凭证;原始凭证;销售票据,检查,采购订单,账单;发票;收银台;金钱和任何交换的媒介,存款,汇票,本票,书面承诺;资产,有形资产,无形资产,负债,所有者权益,收入,费用,利润,流动资产、非流动资产、固定资产、厂房和设备,现金折扣,销货成本;信用证;信贷时期,信贷条件;借项通知单;折扣期间,月末;寄发地交货,目的地交货;一般及行政费用,毛利;存货;定价;多级损益表;定期盘存制;永续盘存制;回购和津贴;损失;补充记录;商业折扣,伤亡和损失在运输过程中,运入运费,运出运费;会计成本;实物盘点;衰退;T-account; contra account; permanent accounts; temporary accounts; transaction and event; what-if or proposed transaction; liquidation; net income or loss; Income Summary; sale on credit, sale on account; receivables; payables; capital; supplies; notes payable; accumulated depreciation; straight-line depreciation; reduced balance depreciation; withdrawal; deferral; accruals; deferred expenses or revenues; accrued expenses or revenues; working capital; beginning balance; ending balance, end-of-period balance; normal balance; opposite normal balance; short-term, long-term; point of time, period of time; prior period; fiscal year, 12 consecutive months or 52 weeks; calendar year; natural business year; closing entries; prepaid account; premium; journal entry; year-end adjusting entry; posting reference column; unearned revenue;丁字式帐户;抵销帐户;永久账户;临时账户,交易和事件,提出假设或事务;清算;净利润或损失;收益汇总;赊销,赊销;应收,应付款;资本;物料;应付票据,累计折旧;直线折旧,余额递减折旧;撤资;延迟;权责发生额;递延费用或收入;应计费用或收入,营运资本,期初余额,期末余额,期末余额;正常平衡;相反的正常平衡,短期、长期,时点,时期,前期;财政年度,连续12个月或52周,历年;自然年;结帐分录;预付帐户;溢价;日记账分录,年终调整分录;过账备查账,预收收入;business decision; lending decision; investment; return; financing; cost of capital; dividend; bonus; principal amount; interest rate; book value; historical value; residual value; salvage value; amount; Pro rata basis; gift card; gift certificate; coupon; premium; salary; wage; pension; welfare; interest; vacation, vocation; carton, cartoon; patent; trademarks; copyrights; franchise; goodwill; licensing agreement; inflation; deflation; goods in transit; goods on consignment; goods damaged or obsolete (deteriorate) ; goods work-in-progress; incidental cost; inventory costing method; physical flow of goods and cost flow of inventory; cost in or out of inventory; specific identification; First-in, First-out; Last-in, First-out; Weighted average;商业决策;贷款决策;投资;回报;融资;资本成本;股息,红利,本金;利率;账面价值;历史价值;残值;残值;数量;按比例;礼品卡;礼券,礼券,奖金;工资,工资,养老金;福利;利息;假期,假期,纸箱,卡通,专利,商标,版权,特许经营;商誉;许可协议;通货膨胀,通货紧缩,货物在运输途中,货物托运;货物损坏或过时(恶化),货物在制品;杂项费用,存货成本核算方法;商品实质流程和存货成本流;成本或库存,具体识别;先进,先进先出,后进先出,加权平均,,identify; record; classify; communicate; analyze; interpret; prepare financial statement (trial balance); present; manipulate; disclose; withdraw; own; owe; yield; prescribe; summarize; journalize; post; credit; debit; understate; overstate; adjust; defer; subtract; add; multiply; divide; transfer; update; come due; smooth out changes in cost; match cost with revenue;识别、记录、分类;沟通;分析;解释;准备财务报表(试);现在,操纵;披露;撤资;自己所有的;欠;产量;规定;总结;记日记账;宣布;贷方;借方;低估;高估;调整;推迟;减少;增加;乘;分化;转移;更新;到期;平滑变化成本;成本与收入匹配;Financial management terms财务管理方面Part A-Chapter 1部分一章1Financial accounting, Managerial accounting, and Financial management财务会计、管理会计和财务管理Investment decision, Financing decision, and Dividend decision投资决策、融资决策和股利决策Enterprise, company, firm, business, proprietorship, partnership, corporation企业、公司、公司、企业,独资企业,合伙企业,公司Listed company or quoted company上市公司或上市公司Stock exchange listing regulation证券交易所上市的监管Voluntary and Not-for-profit organization, economy, effectiveness and efficiency自愿和非营利性组织、经济、有效性和效率Corporate strategy and financial strategy公司战略和财务战略Accounting principle, rules, standards, and assumptions会计原则、规则、标准和假设Going-concern basis, accounting period, accounting entity, and stable monetary unit assumption 持续经营基础上,会计期间、会计主体和稳定货币单位的假设Monetary and non-monetary measures货币和非货币性的措施Financial statement and Financial report财务报表和财务报告Balance sheet or statement of financial position资产负债表或财务状况的声明Income statement, Cash flow statement, and Statement of owner’s equity损益表、现金流量表和所有者权益的声明Financial objectives or targets财务目标或目标Identification and formulation of objectives识别和制定目标The welfare of employee, of management, of society员工的福利,社会的管理The fulfillment of responsibility towards customers and suppliers实现对客户和供应商的责任Shareholders’ wealth maximization股东财富最大化Profitability, growth, customer satisfaction盈利能力、增长、客户满意度Financial achievement财务成果Actual performance and forecast performance实际性能和预测性能Disproportionate to true worth不成比例的真实价值Drawback, advantage, disadvantage, shortcoming缺点,优点,缺点,缺点Agency relationship, goal congruence代理关系,目标一致Corporate governance, internal control, and risk management公司治理、内部控制和风险管理Reward scheme, performance-related pay, extrinsic and intrinsic rewards奖励计划,绩效工资,外在和内在的回报Accountability, good supervision,问责,监督好,Remuneration committee, nomination committee, independent non-executive director薪酬委员会、提名委员会、独立非执行董事Accountant and Auditor会计和审计Shareholder or stockholder, and Stakeholder, creditor and debt holder股东或股东和利益相关者,债权人和债务持有人Employees, directors; managers, pensioners, shareholders, debt holders, investors, customers, bankers, suppliers, competitors, government, pressure groups, local and national communities, professional and regulatory bodies雇员、董事、管理人员、退休人员、股东、债权人、投资者、客户、银行家、供应商、竞争对手、政府、压力团体,地方和全国社区、专业和监管机构Securities, bond, stock, loan, bank overdraft, saving, debenture, treasury, accounts receivable,证券,债券,股票,贷款,银行透支,储蓄、债券、财政部、应收帐款、Working capital, shareholders’ fund or equity营运资本,股东的基金或股票Input, output, yield, product, production, productivity,输入、输出、产量、产品、生产、生产力、As set, liabilities, owners’ equity, revenue, expense profit资产、负债、所有者权益、收入、费用利润Current asset, accounts receivable, inventory流动资产、应收帐款、库存Non-current asset, plant and equipment, fixed asset非流动资产,厂房和设备,固定资产Volume of investment, risk and return of investment的投资,投资的风险和回报Short-term, medium-term, long-term funds, shortfall in fund短期、中期、长期的基金,基金缺口Net present value, book value, market value, added value, nominal value and real value 净现值、账面价值、市场价值,附加价值,名义价值和实际价值Benefit, gain, interest, dividend, earnings, retained earnings, profit retention利益,收益,利息、股息、获利、留存收益、利润保留Ordinary share, preference share普通股、优先股Business risk and financial risk商业风险和金融风险Accounting profit and economic profit会计利润和经济利润Manipulation of profit操纵利润Capitalization资本化Ratio, index, indicator, variables比率指标,指标变量Bad debt, depreciation坏账、折旧Cost of goods sold销货成本Provision for depreciation or anticipated losses折旧准备或预期的损失Overhead cost, development cost, and various expenses间接成本、开发成本和各种费用Administration or selling and distribution expenses管理或销售和分销费用Cum dividend or Ex dividend带息或除息Financial analysis, ratio analysis财务分析中,比率分析Return on equity, return on investment, asset turnover, gearing level,股本回报率,投资回报率,资产周转率,杠杆水平,Profit before and after tax之前和税后利润Profit before interest and tax (PBIT)息税前利润(PBIT)Gross profit margin and net profit margin毛利率和净利润率Return on capital employed (ROCE) or return on investment (ROI)已投资资本回报(ROCE)或投资回报(ROI)EPS, earnings per share每股收益,每股收益Earnings attributable to ordinary shareholders业绩归因于普通股东Profit distributable to ordinary shareholders普通股东可分配利润Weighted average number of ordinary shares加权平均普通股的数量P/E ratio市盈率Dividend per share每股派息Dividend yield股息收益率Part B-Chapter 2, Chapter 3一部分B-Chapter 2,第3章Microeconomics, macroeconomics; policy instrument; economic growth, low inflation, full employment, balance of payment stability; monetary policy, fiscal policy, exchange policy, external trade policy; retail price index (RPI), gross domestic production (GDP); speculation; national income; living standard; subsidies; economies of scale; imperfect competition; acquisition and merger; monopoly; legislation, regulation, deregulation; privatization;微观经济学,宏观经济学,政策工具;经济增长、低通胀、充分就业,收支稳定;货币政策,财政政策,汇率政策、对外贸易政策;零售价格指数(RPI),国内生产总值(GDP);投机;国民收入,生活水平;补贴;规模经济、不完全竞争、兼并;垄断;立法、监管、放松管制、私有化;aggregate demand; surplus and deficit; demand and supply; expenditure; saving, borrowing, lending, spending, deposit, loan; raise money; interest rate, exchange rate, rate of return; fixed, floating and managed (dirty) exchange rate; hard currency; intermediate or forward; outsource; market segmentation;总需求;盈余和赤字;供需;开支;储蓄,借贷,借贷,消费,存款、贷款;筹集资金,利率,汇率,回报率;固定,浮动汇率和管理(脏);硬通货;中间或向前;外包;市场细分;financial intermediaries or institution; money market, capital market; main market, interbank market; primary market, secondary market; insurance company and pension fund, trust company, venture capital organization; risk pooling; diversified portfolios; mutual fund;金融中介机构或机构,货币市场、资本市场,主要市场,银行间市场,一级市场、二级市场、保险公司和养老基金,信托公司,风险资本组织;风险池;多元化投资组合,共同基金;Part C-Chapter 4, Chapter 5C-Chapter 4部分,第五章Working capital; cash, raw materials, work in progress, finished goods, accounts receivable, accounts payable, marketable securities;营运资本;现金,原材料、工作进展,成品,应收账款,应付账款,有价证券;Cash operating cycle, working capital cycle, trading cycle, cash conversion cycle;现金营业周期、流动资金循环,交易周期,现金转换周期;Liquidity ratio; current ratio, quick ratio (acid test ratio, instant ratio), accounts receivable payment period, inventory (accounts payable) turnover, inventory turnover period; over-capitalization, over-trading;流动比率,流动比率,速动比率(酸性测试比率,即时比率),应收账款的付款期,库存(应付帐款)营业额,存货周转期;over-capitalization,交易;Economic order quantity, bulk discount, buffer inventory, lead time, re-order level, safety inventory level,stock-out, just-in-time procurement,经济订货批量、批量折扣、缓冲库存,交货时间,再订购水平,安全库存水平、库存中断,及时采购、Creditworthiness assessment, factoring, invoice discounting, credit insurance,信誉评估、保理、发票贴现、信贷保险,。
怀尔德会计学原理第21版课后习题答案SMChap012第12章课后习题答案12.1 问题回顾1. 在现代企业管理中,有哪些主要类型的财务会计信息用户?答:主要类型的财务会计信息用户包括内部管理层、外部投资者、债权人、监管机构和其他利益相关者等。
2. 财务报表是通过哪种组织结构来提供财务会计信息的?答:财务报表是通过资产负债表、利润表、现金流量表和股东权益变动表等组织结构来提供财务会计信息的。
3. 资产负债表的目的是什么?相关的主要问题是什么?答:资产负债表的目的是展示企业在特定日期的资产、负债和股东权益的情况。
相关的主要问题包括:企业拥有哪些资源?谁向企业提供了这些资源?企业如何使用这些资源?4. 利润表的目的是什么?相关的主要问题是什么?答:利润表的目的是展示企业在特定期间的收入、费用和净利润等情况。
相关的主要问题包括:企业从哪些业务活动中获取了收入?企业的费用总额是多少?企业的净利润是多少?5. 现金流量表的目的是什么?相关的主要问题是什么?答:现金流量表的目的是展示企业在特定期间的现金流量情况。
相关的主要问题包括:企业的现金流入和流出分别来自于哪些活动?企业的净现金流量是多少?12.2 简答题1. 请简要介绍一下资产负债表。
答:资产负债表是一份会计报表,用于展示企业在特定日期的资产、负债和股东权益的情况。
资产负债表的核心思想是资产=负债+股东权益,即企业的资金来源必须等于资金的运用。
资产负债表通常分为两个部分:资产部分和负债和股东权益部分。
资产部分展示了企业拥有的资源,包括现金、应收账款、固定资产等;而负债和股东权益部分则展示了企业所欠债务和股东的权益。
通过资产负债表,用户可以了解企业的财务状况和资金运用情况。
2. 请简要介绍一下利润表。
答:利润表是一份会计报表,用于展示企业在特定期间的收入、费用和净利润等情况。
利润表的核心思想是收入-费用=净利润,即企业从业务活动中获取的收入减去费用后得到的净利润。
江西财经大学本科课程教学进度计划表
2014 —2015 学年度第二学期
主讲教师:江陵职称:讲师学历:研究生学位:博士主授专业:
课程名称:会计学原理课程编号:12016 班级:AE9 学生人数:59
总学时:96 学时,其中课堂讲授90 学时;实验(上机)教学0 学时;其它教学(讨论、见习等): 4 学时;机动: 2 学时实习实训(包括课程实习、课程实训、课程设计等):0 周
教材(名称、主编、出版社、出版时间等)Wild/Shaw/Chiappetta编著Fundamental Accounting Principle(21st edition)中国人民大学出版社.
主要参考书:
《会计学原理》(第21版)(工商管理经典译丛·会计与财务系列),约翰·J·怀尔德、肯·W·肖等著,中国人民大学出版社,2012年1月
成绩考核说明及要求:根据平时成绩和期末考试成绩考核,平时成绩根据课后练习、考勤和测验考核而定
其成绩评定方法:平时成绩:50%(其中作业与考勤10%,测验一10%,测验二10%,期中考试20%),期末考试成绩:50%
考试题型:选择题、判断题、简答题、帐务处理题、计算题
考试时间:根据学院期末安排
系主任(签字):教学院长(签字):
2015年月日2015年月日。
Chapter 3Adjusting Accounts and Preparing1. The cash basis of accounting reports revenues when cash is received while theaccrual basis reports revenues when they are earned. The cash basis reports expenses when cash is paid while the accrual basis reports expenses when they are incurred and matched with revenues they generated.2. The accrual basis of accounting generally provides a better indication of companyperformance and financial condition than does the cash basis. Also, the accrual basis increases the comparability of financial statements from one period to the next.Thus, business decision makers generally prefer the accrual basis.3. Businesses that have major seasonal variations in sales are most likely to select thenatural business year as the fiscal year.4. A prepaid expense is an item paid for in advance of receiving its benefits. As such, itis reported as an asset on the balance sheet.5. Long-term tangible plant assets such as equipment, buildings, and machinery leadto adjustments for depreciation. Generally, land is the only long-term tangible plant asset that does not require depreciation.6. The Accumulated Depreciation contra account is used for depreciation. It providesfinancial statement users with additional information about the relative age of the assets. Without the contra account information, the reader would not be able to tell whether the assets are new or in need of replacement.7. Unearned revenue refers to cash received in advance of providing products andservices. Another name for unearned revenue is deferred revenue. It is reported asa liability on the balance sheet.8. Accrued revenue is revenue that is earned but is not yet received in cash (and/orother assets) and the customer has not been billed prior to the end of the period.Therefore, end-of-period adjustments are made to record accrued revenue.Examples are interest income that has been earned but not collected and revenues from services performed that are neither collected nor billed.9.A If prepaid expenses are initially recorded with debits to expense accounts, then theprepaid expenses asset accounts are debited in the adjusting entries.10. For Best Buy, all of the accounts under the category of Property and Equipment(except for Land), require adjusting entries. The expense related to the depreciation expense account would be understated on the income statement if Best Buy fails to adjust these asset accounts. If the adjusting entries are not made, net income would be overstated. Note: Students might also correctly identify accounts receivable, goodwill, and tradenames as needing adjustment.11. Circuit City must make adjusting entries to Prepaid expenses and other currentassets; Deferred income taxes; Accrued expenses and other current liabilities;Accrued income taxes; and possibly other assets and liabilities such as Receivables for bad debts. (It is also possible that Circuit City would need to adjust Goodwill and Other intangible assets.)12. RadioShack would need to debit interest receivable and credit interest revenue.13. The Accrued Wages Expense would be reported as part of “Accrued Expenses” onCash AccountingRevenues (cash receipts) ...................................................... $52,000Expenses (cash payments: $37,500 - $6,000 + $3,250) ...... 34,750Net income ............................................................................. $17,250 Accrual AccountingRevenues (earned) ................................................................ $60,000Expenses (incurred) .............................................................. 37,500Net income .............................................................................. $22,500 Quick Study 3-2 (10 minutes)a. AE Accrued expensesb. PE Prepaid expensesc. UR Unearned revenuesd. PE Prepaid expenses (Depreciation)e. AR Accrued revenuesa. Debit Unearned Revenue Balance SheetCredit Revenue Earned Income Statementb. Debit Wages Expense Income StatementCredit Wages Payable Balance Sheetc. Debit Accounts Receivable Balance SheetCredit Revenue Earned Income Statementd. Debit Insurance Expense Income StatementCredit Prepaid Insurance Balance Sheete. Debit Depreciation Expense Income StatementCredit Accumulated Depreciation Balance SheetQuick Study 3-4 (15 minutes)a. Insurance Expense ....................................................... 3,000Prepaid Insurance ................................................. 3,000 To record 6-month insurance coverage expired.b. Supplies Expense ......................................................... 4,150Supplies .................................................................. 4,150 To record supplies used during the year.($900 + $4,000 – [?] = $750)Quick Study 3-5 (15 minutes)a. Depreciation Expense—Equipment ............................ 8,400Accumulated Depreciation—Equipment ............. 8,400 To record depreciation expense for the year.($45,000 - $3,000) / 5 years = $8,400b. No depreciation adjustments are made for land asit is expected to last indefinitely.Salaries Expense (400)Salaries Payable (400)To record salaries incurred but not yet paid.[One student earns $100 x 4 days, Mondaythrough Thursday]Quick Study 3-7 (15 minutes)a. Unearned Revenue ........................................................ 22,500Legal Revenue ....................................................... 22,500 To recognize legal revenue earned (30,000 x 3/4).b. Unearned Subscription Revenue ................................ 1,200Subscription Revenue ........................................... 1,200 To recognize subscription revenue earned.[100 x ($24 / 12 months) x 6 months]1. Accrue salaries expense e ga f2. Adjust the Unearned Services Revenue accountto recognize earned revenueb f3. Record the earning of services revenue for whichcash will be received the following periodQuick Study 3-9 (10 minutes)The answer is a.ExplanationThe debit balance in Prepaid Insurance was reduced by $400, implying a $400 debit to Insurance Expense. The credit balance in Interest Payable increased by $800, implying an $800 debit to Interest Expense.The answer is 2.ExplanationInsurance premium errorUnderstates expenses (and overstates assets) by .......... $1,600 Accrued salaries errorUnderstates expenses (and understates liabilities) by .... 1,000The collective effects from this company’s errors follow:Understates expenses by ..................................................... $2,600Overstates assets by ............................................................. $1,600Understates liabilities by ...................................................... $1,000 Quick Study 3-11 (10 minutes)Profit margin = $78,750 / $630,000 = 12.5%Interpretation: For each dollar that records as revenue, it earns 12.5 cents in net income. Miller’s 12.5% is markedly lower than competitors’ average profit margin of 15%—it must improve performance.Quick Study 3-12A (5 minutes)1. B 4. A2. F 5. D3. C 6. EExercise 3-2 (25 minutes)a. Depreciation Expense—Equipment ................................ 16,000Accumulated Depreciation—Equipment..................... 16,000 To record depreciation expense for the year.b. Insurance Expense ........................................................... 5,360Prepaid Insurance* ....................................................... 5,360 To record insurance coverage that expired($6,000 - $640).c. Office Supplies Expense .................................................. 3,422Office Supplies**............................................................ 3,422 To record office supplies used ($325 + $3,480 - $383).d. Unearned Fee Revenue .................................................... 3,000Fee Revenue .................................................................. 3,000 To record earned portion of fee received in advance($15,000 x 1/5).e. Insurance Expense ........................................................... 6,160Prepaid Insurance ......................................................... 6,160 To record insurance coverage that expired.f. Wages Expense ................................................................. 2,700Wages Payable .............................................................. 2,700 To record wages accrued but not yet paid.a. Unearned Fee Revenue .................................................... 5,000Fee Revenue .................................................................. 5,000 To record earned portion of fee received in advance($15,000 x 1/3).b. Wages Expense ................................................................. 7,500Wages Payable .............................................................. 7,500 To record wages accrued but not yet paid.c. Depreciation Expense—Equipment ................................ 17,251Accumulated Depreciation—Equipment..................... 17,251 To record depreciation expense for the year.d. Office Supplies Expense .................................................. 5,682Office Supplies*............................................................. 5,682 To record office supplies used ($240 + $6,102 - $660).e. Insurance Expense ........................................................... 2,700Prepaid Insurance†........................................................ 2,700 To record insurance coverage expired ($4,000 - $1,300).f. Interest Receivable ......................................................... 1,400Interest Revenue ........................................................ 1,400 To record interest earned but not yet received.g. Interest Expense ............................................................. 2,000Interest Payable........................................................... 2,000 To record interest incurred but not yet paid.a. Adjusting entry2009Dec. 31 Wages Expense (825)Wages Payable (825)To record accrued wages for one day.(5 workers x $165)b. Payday entry2010Jan. 4 Wages Expense.......................................................2,475Wages Payable (825)Cash .....................................................................3,300To record accrued and current wages.Wages expense = 5 workers x 3 days x $165Cash = 5 workers x 4 days x $165Exercise 3-5 (15 minutes)a. $ 2,000b. $ 6,607c. $11,987d. $ 1,375Proof: (a) (b) (c) (d) Supplies available – prior year-end ......... $ 350 $1,855 $ 1,576 $1,375 Supplies purchased in current year ........ 2,450 6,307 11,987 6,907 Total supplies available ............................ 2,800 8,162 13,563 8,282 Supplies available – current year-end ..... (800) (6,607) (2,056) (800) Supplies expense for current year........... $2,000 $1,555 $11,507 $7,482a.Apr. 30 Legal Fees Expense ........................................... 4,500Legal Fees Payable ..................................... 4,500 To record accrued legal fees.May 12 Legal Fees Payable ............................................ 4,500Cash ............................................................. 4,500 To pay accrued legal fees.b.Apr. 30 Interest Expense ................................................. 1,900Interest Payable .......................................... 1,900 To record accrued interest expense($5,700 x 10/30).May 20 Interest Payable .................................................. 1,900Interest Expense ................................................. 3,800Cash ............................................................. 5,700 To record payment of accrued and currentinterest expense ($5,700 x 20/30).c.Apr. 30 Salaries Expense ................................................ 4,800Salaries Payable.......................................... 4,800 To record accrued salaries($12,000 x 2/5 week).May 3 Salaries Payable ................................................. 4,800Salaries Expense ................................................ 7,200Cash ............................................................. 12,000 To record payment of accrued andcurrent salaries ($12,000 x 3/5 week).Basis*Basis Basis**Basis Dec. 31, 2007 ........$14,450 $0 2007 ..........$ 850 $15,300 Dec. 31, 2008 ........9,350 0 2008 ..........5,100 0 Dec. 31, 2009 ........4,250 0 2009 .......... 5,100 0 Dec. 31, 2010 ........0 0 2010 .......... 4,250 0$15,300 $15,300 Explanations:*Accrual asset balance equals months left in the policy x $425 per month (monthly cost is computed as $15,300 / 36 months).Months Left Balance12/31/2007 .. 34 $14,45012/31/2008 .. 22 9,35012/31/2009 .. 10 4,25012/31/2010 .. 0 0**Accrual insurance expense equals months covered in the year x $425 per month.Months Covered Expense2007 ............ 2 $ 8502008 ............12 5,1002009 ............12 5,1002010 ............10 4,250$15,300Dec. 31 Accounts Receivable ............................................. 1,980Fees Earned ..................................................... 1,980 To record earned but unbilled fees (30% x $6,600).31 Unearned Fees ........................................................ 4,620Fees Earned ..................................................... 4,620 To record earned fees collected in advance(70% x $6,600).31 Depreciation Expense—Computers ..................... 1,650Accumulated Depreciation-Computers ........ 1,650 To record depreciation on computers.31 Depreciation Expense—Office Furniture ............. . 1,925A ccumulated Depreciation—Office Furniture ... 1,925To record depreciation on office furniture.31 Salaries Expense .................................................... 2,695Salaries Payable.............................................. 2,695 To record accrued salaries.31 Insurance Expense.................................................. 1,430Prepaid Insurance ........................................... 1,430 To record expired prepaid insurance.31 Rent Expense (700)Rent Payable (700)To record accrued rent expense.31 Office Supplies Expense (528)Office Supplies (528)To record use of office supplies.31 Advertising Expense (500)Advertising Payable (500)To record accrued advertising expense.31 Utilities Expense (77)Utilities Payable (77)To record incurred and unpaid utility costs.a. $ 6,039 / $ 52,970 = 11.4%b. $100,890 / $ 471,430 = 21.4%c. $106,880 / $ 301,920 = 35.4%d. $ 67,140 / $1,721,520 = 3.9%e. $ 84,780 / $ 513,800 = 16.5%Analysis and Interpretation: Company c has the highest profitability according to the profit margin ratio. Company c earns 35.4 cents in net income for every one dollar of net sales earned.Exercise 3-10A (30 minutes)a.Dec. 1 Supplies Expense ................................................... 2,000Cash ................................................................. 2,000 Purchased supplies.b.Dec. 2 Insurance Expense ................................................. 1,540Cash ................................................................. 1,540 Paid insurance premiums.c.Dec. 15 Cash ......................................................................... 13,000Remodeling Fees Earned ............................... 13,000 Received fees for work to be done.d.Dec. 28 Cash ......................................................................... 3,700Remodeling Fees Earned ............................... 3,700 Received fees for work to be done.e.Dec. 31 Supplies .................................................................. 1,840Supplies Expense ........................................... 1,840 Adjust expenses for unused supplies.f.Dec. 31 Prepaid Insurance .................................................. 1,200Insurance Expense ......................................... 1,200 Adjust expenses for unexpired coverage($1,540 - $340).g.Dec. 31 Remodeling Fees Earned ..................................... 11,130Unearned Remodeling Fees .......................... 11,130 Adjusted revenues for unfinished projects($13,000 + 3,700 - $5,570).a. Initial credit recorded in the Unearned Fees accountJuly 1 Cash ....................................................................... 2,800Unearned Fees .............................................. 2,800 Received fees for work to be done for Solana.6 Cash ....................................................................... 8,100Unearned Fees .............................................. 8,100 Received fees for work to be done for Haru.12 Unearned Fees ...................................................... 2,800Fees Earned ................................................... 2,800 Completed work for Solana.18 Cash ....................................................................... 7,300Unearned Fees .............................................. 7,300 Received fees for work to be done for Jordan.27 Unearned Fees ...................................................... 8,100Fees Earned ................................................... 8,100 Completed work for customer Haru.31 No adjusting entries required.b. Initial credit recorded in the Fees Earned accountJuly 1 Cash ....................................................................... 2,800Fees Earned ................................................... 2,800 Received fees for work to be done for Solana.6 Cash ....................................................................... 8,100Fees Earned ................................................... 8,100 Received fees for work to be done for Haru.12 No entry required.18 Cash ....................................................................... 7,300Fees Earned ................................................... 7,300 Received fees for work to be done for Jordan.27 No entry required.31 Fees Earned .......................................................... 7,300Unearned Fees .............................................. 7,300 Adjusted to reflect unearned fees for unfinishedjob for Jordan.c. Under the first method (and using entries from a)Unearned Fees = $2,800 + $8,100 - $2,800 + $7,300 - $8,100 = $7,300 Fees Earned = $2,800 + $8,100 = $10,900Unearned Fees = $7,300Fees Earned = $2,800 + $8,100 + $7,300 - $7,300 = $10,9001. I 5. G 9. H2. D 6. C 10. E3. F 7. I 11. H4. B 8. A 12. BProblem 3-2A (35 minutes)Part 1Adjustment (a)Dec. 31 Office Supplies Expense ................................ 12,325Office Supplies ......................................... 12,325 To record cost of supplies used($2,900 + $11,977 - $2,552).Adjustment (b)31 Insurance Expense .......................................... 12,280Prepaid Insurance .................................... 12,280B 290 ($10,440/36 mo.) 9 2,610C 770 ($ 9,240 /12 mo.) 5 3,850Total $12,280Adjustment (c)31 Salaries Expense ............................................. 3,660Salaries Payable....................................... 3,660 To record accrued but unpaid wages(2 days x $1,830).Adjustment (d)Dec. 31 Depreciation Expense—Building ................... 18,875Accumulated Depreciation—Building ... 18,875 To record annual depreciation expense[($800,000 -$45,000) / 40 years = $18,875]Adjustment (e)31 Rent Receivable ............................................ 3,000Rent Earned ........................................... 3,000 To record earned but unpaid Dec. rent.Adjustment (f)31 Unearned Rent .............................................. 5,436Rent Earned ........................................... 5,436 To record the amount of rent earned forNovember and December (2 x $2,718).Part 2Cash Payment for (c)Jan. 6 Salaries Payable ........................................... 3,660Salaries Expense* ........................................ 5,490Cash ....................................................... 9,150 To record payment of accrued andcurrent salaries. *(3 days x $1,830)Cash Payment for (e)15Cash ............................................................... 6,000Rent Receivable .................................... 3,000Rent Earned ........................................... 3,000 To record past due rent for two months.Part 2Adjustment (a)Dec. 31 Insurance Expense ...............................................3,000Prepaid Insurance ...........................................3,000 To record the insurance expired.Adjustment (b)31 Teaching Supplies Expense ................................9,000Teaching Supplies ..........................................9,000 To record supplies used ($11,000 - $2,000).Adjustment (c)31 Depreciation Expense—Equipment ....................10,000Accumulated Depreciation—Equipment ............10,000 To record equipment depreciation.Adjustment (d)31 Depreciation Expense—Profess. Library ...........5,000A ccumul. Depreciation—Profess. Library.........5,000To record professional library depreciation.Adjustment (e)31 Unearned Training Fees .......................................5,000Training Fees Earned .....................................5,000 To record 2 months’ training fees earnedthat were collected in advance.Adjustment (f)31 Accounts Receivable ............................................4,000Tuition Fees Earned........................................4,000 To record tuition earned($1,600 x 2 1/2 months).Adjustment (g)31 Salaries Expense (480)Salaries Payable (480)To record accrued salaries(2 days x $120 x 2 employees).Adjustment (h)31 Rent Expense ........................................................2,178Prepaid Rent ....................................................2,178 To record expiration of prepaid rent.Part 3WELLS TEACHING INSTITUTEAdjusted Trial BalanceDecember 31, 2009Debit Credit Cash .......................................................................... $ 28,064Accounts receivable ................................................ 4,000Teaching supplies ................................................... 2,000Prepaid insurance .................................................... 13,000Prepaid rent 0Professional library ................................................. 33,000 Accumulated depreciation—Professional library ... $ 15,000 Equipment ................................................................ 75,800 Accumulated depreciation—Equipment ................ 25,000 Accounts payable .................................................... 39,500 Salaries payable . (480)Unearned training fees ............................................ 7,500 T. Wells, Capital ....................................................... 71,000 T. Wells, Withdrawals .............................................. 44,000Tuition fees earned .................................................. 115,000 Training fees earned ................................................ 46,000 Depreciation expense—Professional library ........ 5,000 Depreciation expense—Equipment ....................... 10,000Salaries expense ..................................................... 52,480Insurance expense................................................... 3,000Rent expense ............................................................ 26,136Teaching supplies expense .................................... 9,000 Advertising expense ................................................ 8,000Utilities expense....................................................... 6,000 _______ Totals ........................................................................ $319,480 $319,480Part 4WELLS TEACHING INSTITUTEIncome StatementFor Year Ended December 31, 2009RevenuesTuition fees earned ............................................ $115,000Training fees earned .......................................... 46,000Total revenues .................................................... $161,000 ExpensesDepreciation expense—Professional library ... 5,000Depreciation expense—Equipment .................. 10,000Salaries expense ................................................ 52,480Insurance expense ............................................. 3,000Rent expense ...................................................... 26,136Teaching supplies expense ............................... 9,000Advertising expense .......................................... 8,000Utilities expense ................................................. 6,000Total expenses ................................................... 119,616 Net income ............................................................ $ 41,384WELLS TEACHING INSTITUTEStatement of Owner’s EquityFor Year Ended December 31, 2009T. Wells, Capital, December 31, 2008 ................................. $ 71,000 Plus: Net income .................................................................. 41,384112,384 Less: Withdrawals by owner ............................................... 44,000 T. Wells, Capital, December 31, 2009 ................................. $ 68,384Problem 3-3A (Concluded)WELLS TEACHING INSTITUTEBalance SheetDecember 31, 2009AssetsCash ................................................................................. $ 28,064 Accounts receivable ...................................................... 4,000 Teaching supplies .......................................................... 2,000 Prepaid insurance .......................................................... 13,000 Professional library ........................................................ $33,000 Accumulated depreciation—Professional library ....... (15,000) 18,000 Equipment ....................................................................... 75,800 Accumulated depreciation—Equipment ...................... (25,000) 50,800 Total assets ..................................................................... $115,864LiabilitiesAccounts payable ........................................................... $ 39,500 Salaries payable . (480)Unearned training fees .................................................. 7,500 Total liabilities ................................................................ 47,480EquityT. Wells, Capital .............................................................. 68,384 Total liabilities and equity ............................................. $115,864Problem 3-4A (45 minutes) —Part 1Cash ......................................... $ 86,000 $ 86,000 Accounts receivable ........... 15,000 (a) 4,000 19,000Office supplies ...................... 17,800 (b) 8,800 9,000Prepaid insurance ................ 6,040 (c) 2,080 3,960Office equipment .................. 87,000 87,000 Accumulated depreciation—Office equipment ........... $ 24,000 (d) 2,000 $ 26,000 Accounts payable ................ 9,100 (e) 14,900 24,000 Interest payable ..................... (f) 2,500 2,500 Salaries payable ................... (g) 15,000 15,000 Unearned consulting fees .20,000 (h) 7,000 13,000 Long-term notes payable .. 54,000 54,000 K. Jenkins, Capital ............... 46,000 46,000 K. Jenkins, Withdrawals .... 10,000 10,000Consulting feesearned .................................... 165,000 (a)(h)4,0007,000 176,000Depreciation expense—Office equipment ................ (d) 2,000 2,000Salaries expense .................. 67,990 (g) 15,000 82,990Interest expense ................... 1,270 (f) 2,500 3,770 Insurance expense .............. (c) 2,080 2,080Rent expense ........................ 14,540 14,540Office supplies expense .... (b) 8,800 8,800 Advertising expense ........... 12,460 _______ (e) 14,900 ______ 27,360 _______ Totals ........................................ $318,100 $318,100 $56,280 $56,280 $356,500 $356,500 Adjustment description(a) Earned but uncollected revenues.(b) Cost of office supplies used.(c) Cost of expired insurance coverage.(d) Depreciation expense on office equipment.(e) Incurred but unpaid advertising expense.(f) Incurred but unpaid interest expense.(g) Incurred but unpaid salaries expense.(h) Earned revenues previously received in advance.。