matlab符号计算实例
- 格式:pdf
- 大小:94.33 KB
- 文档页数:8
matlab符号运算多项式【提纲】1.MATLAB符号运算简介MATLAB是一款功能强大的数学软件,其中符号运算功能允许用户进行高级数学计算、分析和可视化。
符号运算可以帮助工程师、科学家和数学家在各种领域解决问题,如线性代数、微积分、概率论等。
2.多项式基本概念与MATLAB表示多项式是数学中一个重要的概念,它表示为一个无穷级数,其中包含常数、变量及其幂次。
在MATLAB中,多项式可以用符号表达式表示,如:f(x) = 2x^3 + 4x^2 - 3x + 1。
3.多项式运算实例以下是几个MATLAB中进行多项式运算的实例:- 多项式加法:将两个多项式相加,如f(x) + g(x)。
- 多项式减法:将两个多项式相减,如f(x) - g(x)。
- 多项式乘法:将两个多项式相乘,如f(x) * g(x)。
- 多项式除法:将一个多项式除以另一个多项式,如f(x) / g(x)。
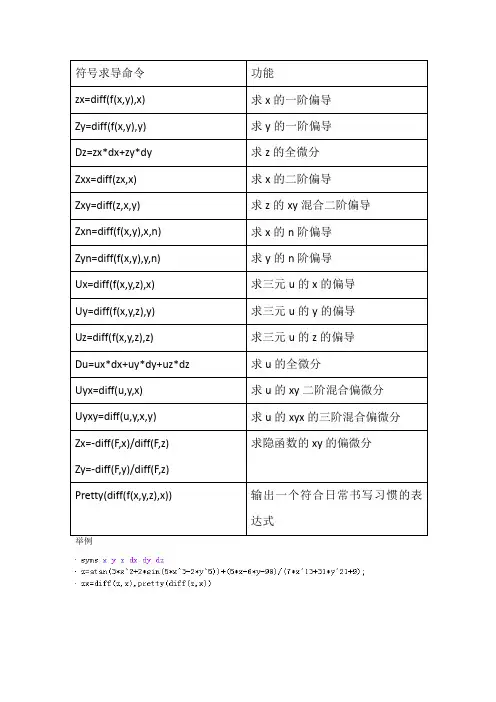
- 多项式求导:对一个多项式求导,如diff(f(x))。
- 多项式积分:对一个多项式进行积分,如int(f(x))。
4.多项式函数与应用MATLAB提供了许多与多项式相关的函数,如:- polyfit:根据一组数据拟合多项式。
- polyval:根据多项式系数计算多项式的值。
- roots:求多项式的根。
- legendre:勒让德多项式。
- laguerre:拉格朗日多项式。
这些函数在信号处理、控制系统、优化等领域具有广泛的应用。
5.总结与建议MATLAB的符号运算功能为多项式计算提供了便捷的工具和函数。
掌握这些功能和函数可以帮助用户在各种应用场景中解决问题。
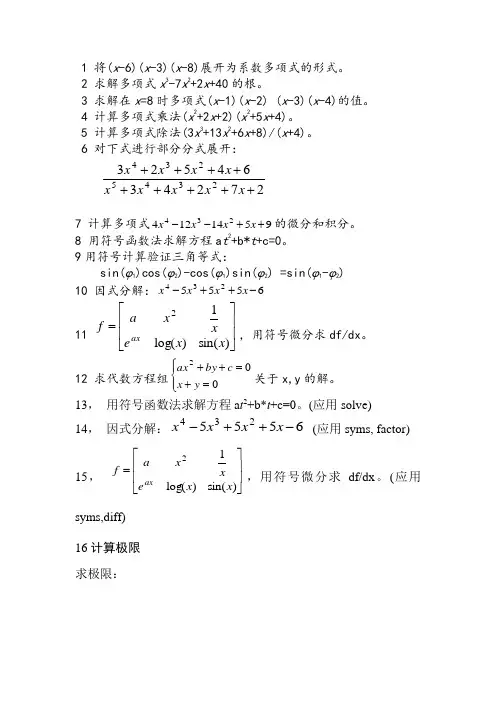
1 将(x -6)(x -3)(x -8)展开为系数多项式的形式。
2 求解多项式x 3-7x 2+2x +40的根。
3 求解在x =8时多项式(x -1)(x -2) (x -3)(x -4)的值。
4 计算多项式乘法(x 2+2x +2)(x 2+5x +4)。
5 计算多项式除法(3x 3+13x 2+6x +8)/(x +4)。
6 对下式进行部分分式展开:27243645232345234+++++++++x x x x x x x x x7 计算多项式9514124234++--x x x x 的微分和积分。
8 用符号函数法求解方程a t 2+b*t +c=0。
9用符号计算验证三角等式:sin(ϕ1)cos(ϕ2)-cos(ϕ1)sin(ϕ2) =sin(ϕ1-ϕ2) 10 因式分解:6555234-++-x x x x 11 ⎥⎥⎦⎤⎢⎢⎣⎡=)sin()log(12x x e x x a f ax ,用符号微分求df/dx 。
12 求代数方程组⎪⎩⎪⎨⎧=+=++002y x c by ax 关于x,y 的解。
13, 用符号函数法求解方程a t 2+b*t +c=0。
(应用solve)14, 因式分解:6555234-++-x x x x (应用syms, factor) 15, ⎥⎥⎦⎤⎢⎢⎣⎡=)sin()log(12x x e x x a f ax ,用符号微分求df/dx 。
(应用syms,diff)16计算极限求极限:n n h n x M hx h x L )1(lim )2(,)ln()ln(lim )1(0-=-+=∞→→ 17 计算导数22d d ,d d ,d d ,sin x y C a y B x y A ax y ====求.18计算不定积分、定积分、反常积分 x x x x I d )22(1222⎰+-+=,x x x x J d cos sin cos 2/0⎰π+=,⎰+∞-=0d e 2x K x .19 符号求和求级数 ∑∞=121n n 的和S, 以及前十项的部分和S1. 20解代数方程和常微分方程例如:求一元二次方程a*x^2+b*x+c=0的根. 21求微分方程x y ='的通解.22求微分方程⎩⎨⎧==+=0)0(' ,1)0('"y y y x y 的特解. 23求微分方程组⎩⎨⎧=+=x y xy x 2''的通解.。
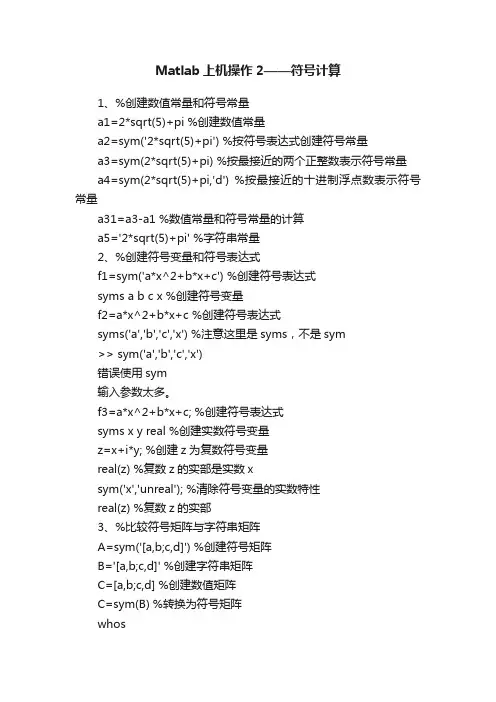
Matlab上机操作2——符号计算1、%创建数值常量和符号常量a1=2*sqrt(5)+pi %创建数值常量a2=sym('2*sqrt(5)+pi') %按符号表达式创建符号常量a3=sym(2*sqrt(5)+pi) %按最接近的两个正整数表示符号常量a4=sym(2*sqrt(5)+pi,'d') %按最接近的十进制浮点数表示符号常量a31=a3-a1 %数值常量和符号常量的计算a5='2*sqrt(5)+pi' %字符串常量2、%创建符号变量和符号表达式f1=sym('a*x^2+b*x+c') %创建符号表达式syms a b c x %创建符号变量f2=a*x^2+b*x+c %创建符号表达式syms('a','b','c','x') %注意这里是syms,不是sym>> sym('a','b','c','x')错误使用sym输入参数太多。
f3=a*x^2+b*x+c; %创建符号表达式syms x y real %创建实数符号变量z=x+i*y; %创建z为复数符号变量real(z) %复数z的实部是实数xsym('x','unreal'); %清除符号变量的实数特性real(z) %复数z的实部3、%比较符号矩阵与字符串矩阵A=sym('[a,b;c,d]') %创建符号矩阵B='[a,b;c,d]' %创建字符串矩阵C=[a,b;c,d] %创建数值矩阵C=sym(B) %转换为符号矩阵whos4、%计算符号矩阵的行列式值、非共轭转置和特征值syms a11 a12 a21 a22A=[a11 a12;a21 a22] %创建符号矩阵det(A) %计算行列式A.' %计算非共轭转置eig(A)%计算特征值5、%符号表达式的代数运算f=sym('2*x^2+3*x+4')g=sym('5*x+6')f+g %符号表达式相加f*g %符号表达式相乘6、%对符号表达式进行任意精度控制并用三种运算方式表示同一符号常量a=sym('2*sqrt(5)+pi')digits %显示默认的有效位数vpa(a) %用默认的位数计算并显示vpa(a,20) %按指定的精度计算并显示digits(15) %改变默认的有效位数vpa(a) %按digits指定的精度计算并显示a1 =2/3 %数值型a2 = sym(2/3) %有理数型digitsa3 =vpa('2/3',32) %VPA型format longa17、%符号变量与数值变量进行转换a1=sym('2*sqrt(5)+pi')b1=double(a1) %转换为数值变量a2=vpa(sym('2*sqrt(5)+pi'),32)b2=numeric(a2) %转换为数值变量b2=numeric(a2)未定义函数或变量'numeric'。
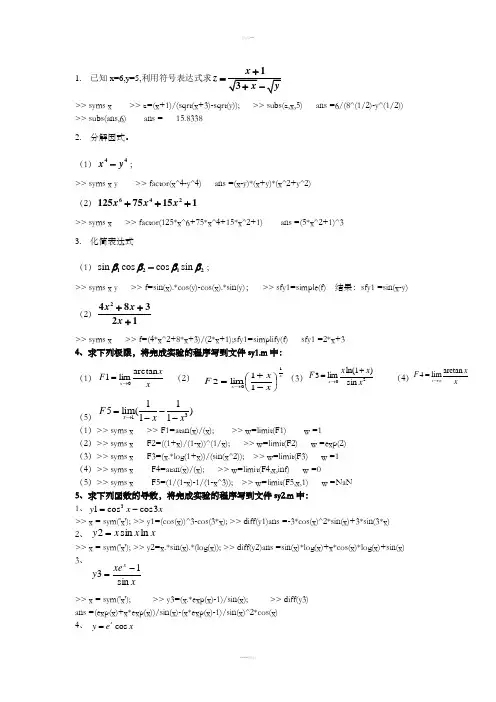
1. 已知x=6,y=5,利用符号表达式求z =>> syms x >> z=(x+1)/(sqrt(x+3)-sqrt(y)); >> subs(z,x,5) ans =6/(8^(1/2)-y^(1/2)) >> subs(ans,6) ans = 15.83382. 分解因式。
(1)x y -44; >> syms x y >> factor(x^4-y^4) ans =(x-y)*(x+y)*(x^2+y^2)(2)x x x +++64212575151 >> syms x >> factor(125*x^6+75*x^4+15*x^2+1) ans =(5*x^2+1)^33. 化简表达式(1)sin cos cos sin ββββ-1212;>> syms x y >> f=sin(x).*cos(y)-cos(x).*sin(y); >> sfy1=simple(f) 结果:sfy1 =sin(x-y)(2)x x x +++248321>> syms x >> f=(4*x^2+8*x+3)/(2*x+1);sfy1=simplify(f) sfy1 =2*x+34、求下列极限,将完成实验的程序写到文件sy1.m 中:(1) (2) (3) (4)(5) (1)>> syms x >> F1=atan(x)/(x); >> w=limit(F1) w =1(2)>> syms x F2=((1+x)/(1-x))^(1/x); >> w=limit(F2) w =exp(2)(3)>> syms x F3=(x.*log(1+x))/(sin(x^2)); >> w=limit(F3) w =1(4)>> syms x F4=atan(x)/(x); >> w=limit(F4,x,inf) w =0(5)>> syms x F5=(1/(1-x)-1/(1-x^3)); >> w=limit(F5,x,1) w =NaN5、求下列函数的导数,将完成实验的程序写到文件sy2.m 中:1、 >> x = sym('x'); >> y1=(cos(x))^3-cos(3*x); >> diff(y1)ans =-3*cos(x)^2*sin(x)+3*sin(3*x)2、 >> x = sym('x'); >> y2=x.*sin(x).*(log(x)); >> diff(y2)ans =sin(x)*log(x)+x*cos(x)*log(x)+sin(x)3、>> x = sym('x'); >> y3=(x.*exp(x)-1)/sin(x); >> diff(y3)ans =(exp(x)+x*exp(x))/sin(x)-(x*exp(x)-1)/sin(x)^2*cos(x)4、 x x x x F 1011lim 2⎪⎭⎫ ⎝⎛-+=→31115lim()11x F x x →=---20sin )1ln(lim 3x x x F x +=→x x F x arctan lim 10→=arctan 4lim x x F x →∞=xx y 3cos cos 13-=xx x y ln sin 2=x xe y xsin 13-=cos x y e x =>> x = sym('x');y=cos(x).*exp(x); >> diff(y) ans =-sin(x)*exp(x)+cos(x)*exp(x)5、 >> x = sym('x');y=x^2.*sin(x); >> diff(y) ans = 2*x*sin(x)+x^2*cos(x)6、求下列函数的积分1、syms x a b c;int(sin(a*x).*sin(b*x).*sin(c*x)) ans =-1/4/(c+a-b)*cos((c+a-b)*x)+1/4/(-c+a-b)*cos((-c+a-b)*x)+1/4/(c+a+b)*cos((c+a+b)*x)-1/4/(-c +a+b)*cos((-c+a+b)*x) 2、>> syms x ;int(x^5+x^3-sqrt(x)/4) ans =1/6*x^6+1/4*x^4-1/6*x^(3/2)3、>> syms x ;int(x.*exp(x)/(x+1)^2,x,0,1) ans =1/2*exp(1)-1 4、 >> syms x y;F=int(int('x/(1+x*y)',x,0,1),y,0,1) F =2*log(2)-15、 由曲面22y x z +=,1=z ,2=z 所围成 >> syms x y z;F=int(int(int('x^2+y^2',x,-inf,inf),y,-inf,inf),z,1,2) F =Inf7、求下列级数的和(1) (2)(1)>> syms n;symsum(2*n-1/2^n,1,Inf) ans =Inf(2)syms n;symsum(1/n*(2*n-1),1,Inf) ans =Inf8、将函数 展开成2-x 的幂级数>> syms x;mtaylor(1/(x^2+5*x-3),x-2) 2sin 2y x x=⎰cxdx bx ax sin sin sin dx x x x )4(35⎰-+⎰+102)1(dx x xe x ⎰⎰+D dxdy xy x 1]1,0[]1,0[⨯=D ⎰⎰⎰Vzdxdydz 11212n n n I ∞=-=∑211(21)n I n n ∞==+∑21()53f x x x =+-。
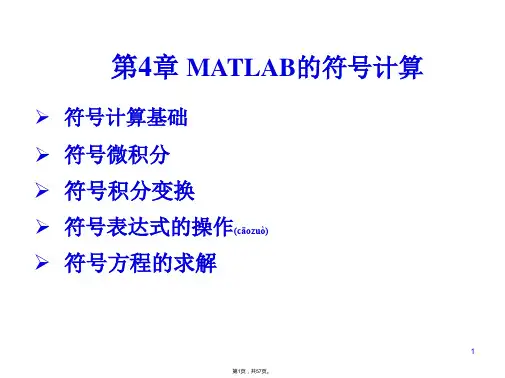
一、背景介绍Matlab是一种强大的数学软件,常用于数学建模、仿真、数据分析等领域。
在工程和科学研究中,求解符号方程是一个常见的问题,Matlab提供了丰富的符号计算工具,可以帮助用户高效地求解符号方程。
二、Matlab符号计算工具1. 符号变量定义在Matlab中,我们可以通过syms命令定义符号变量,使用符号变量进行符号运算。
例如:```matlabsyms x y```2. 求解符号方程Matlab提供了solve函数,可以用来求解符号方程。
solve函数的基本语法如下:```matlabsol = solve(equations, variables)```其中,equations表示要求解的方程组,variables表示待求解的变量。
solve函数会返回符号方程的解。
三、示例接下来,我们通过一个示例来演示如何使用Matlab求解符号方程。
假设我们要求解如下的符号方程:```matlabsyms xeqn = x^2 - 4*x + 3 == 0;sol = solve(eqn, x);disp(sol);```运行以上代码,可以得到方程x^2 - 4*x + 3 = 0的解为x = 1或x = 3。
四、注意事项在使用Matlab求解符号方程时,有一些需要注意的事项:1. 可能存在多解或无解的情况,在求解后需要对解进行检查;2. 符号计算是一种复杂的运算,可能存在数值精度问题,需要注意数值的精确性;3. 在求解复杂的方程组时,可能需要对方程组进行化简或变形,以提高求解效率。
五、总结通过Matlab的符号计算工具,我们可以较为方便地求解符号方程,实现高效的符号计算。
在工程和科学研究中,这些工具能够帮助我们快速解决复杂的数学问题,提高工作效率。
希望本文的介绍和示例能够帮助读者更好地理解和应用Matlab的符号计算工具。
Matlab在求解符号方程方面具有广泛的应用。
通过利用Matlab的符号计算工具,用户可以轻松地进行符号方程的求解和符号计算,并获得高精度的结果。

关于matlab符号计算的综合实例在科学计算领域,matlab是一种非常常用的软件工具,它具有强大的符号计算功能,可以对符号表达式进行求导、积分、解方程等操作,为科学研究和工程设计提供了便利。
本文将通过一些实例,介绍matlab符号计算功能的应用和操作技巧。
一、符号变量的定义和基本运算我们需要明白matlab中符号计算需要先定义符号变量。
在matlab中,可以使用syms命令定义符号变量,比如:syms x y这样就定义了两个符号变量x和y。
接下来,我们就可以进行基本的符号运算,比如加法、减法、乘法和除法,示例代码如下:1. 加法:z = x + y2. 减法:w = x - y3. 乘法:4. 除法:v = x / y通过这些简单的示例,我们可以看到,matlab对于符号变量的基本运算操作和数学运算规则是一致的,只是使用符号变量进行运算,可以得到符号表达式作为结果。
二、符号函数的求导和积分在科学计算中,求导和积分是非常常见的操作,matlab可以对符号函数进行求导和积分操作,示例代码如下:1. 求导:f = x^2 + 3*x + 2df = diff(f, x)2. 积分:F = int(f, x)通过这些示例,我们可以看到,matlab可以对符号函数进行求导和积分操作,并得到相应的结果。
这对于解决一些数学问题和工程问题非三、符号方程的求解在科学研究和工程设计中,经常会遇到需要求解符号方程的情况,matlab提供了符号求解方程的功能,示例代码如下:1. 求解一元方程:syms xeqn = x^2 - 4*x + 3 == 0;sol = solve(eqn, x)2. 求解多元方程:syms x yeqn1 = x + y == 3;eqn2 = x - y == 1;sol = solve([eqn1,eqn2],[x,y])通过这些示例,我们可以看到,matlab可以对符号方程进行求解,并得到相应的结果。
在MATLAB 中,符号方程(symbolic equation )是通过符号计算工具箱(Symbolic Math Toolbox )来处理的。
符号计算允许您使用变量和符号来表示数学表达式,并执行各种代数和微积分操作。
以下是一些MATLAB 中处理符号方程的基本步骤和示例:创建符号变量:使用syms 函数创建符号变量。
例如,syms x y z 将创建三个符号变量x 、y 和z 。
定义符号方程:使用等号(=)将符号表达式定义为方程。
例如,eq = x^2 + y^2 - z^2 == 1将创建一个符号方程eq 。
求解符号方程:使用solve 函数求解符号方程。
例如,solve(eq, x)将求解方程eq 中的x 。
下面是一个具体的示例,展示如何在MATLAB 中创建和求解符号方程:matlab 复制代码%创建符号变量syms xy;%定义符号方程 equ ation =x^2+y^2==1;%求解符号方程solu% 创建符号变量 syms x y; % 定义符号方程 equation = x^2 + y^2 == 1; % 求解符号方程 solutions = solve(equation, x);在上述示例中,我们首先使用syms 函数创建了两个符号变量x 和y 。
然后,我们使用等号(=)创建了一个符号方程equation ,该方程表示一个单位圆。
最后,我们使用solve 函数求解该方程,将结果存储在solutions 变量中。
s =solve(equation, x);syms xy;%定义符号方程equation =x^2+ y^2 == 1; %求解符号方程solutions =solve(equation, x);syms x y; % 定义符号方程 equation = x^2 + y^2 == 1; % 求解符号方程 solutions = solve(equation, x);在上述示例中,我们首先使用syms 函数创建了两个符号变量x 和y 。
matlab阶乘符号
在MATLAB中,阶乘符号使用"!"表示。
阶乘是指将一个正整数n与小于等于n的所有正整数相乘的结果。
例如,n的阶乘可以表示为n!,计算公式为n! = n (n-1) (n-2) ... 3 2 1。
在MATLAB中,你可以使用阶乘符号来计算一个数的阶乘。
下面是一些示例代码:
1. 计算5的阶乘:
result = factorial(5);
disp(result);
运行以上代码,结果将会输出120,即5的阶乘。
2. 计算一个向量中每个元素的阶乘:
vector = [1, 2, 3, 4, 5];
result = factorial(vector);
disp(result);
运行以上代码,结果将会输出一个包含每个元素阶乘的向量。
需要注意的是,阶乘函数在计算大数的阶乘时可能会面临溢出
的问题。
MATLAB提供了`factorial`函数来计算整数的阶乘,但对
于非整数或较大的数值,可以考虑使用其他方法来计算阶乘,如使
用循环或递归。
logo>> randn('state',27)>> startprice=50;>> fracreturnsl=0.00015*randn(200,1)+0.0003;>> x1=[startprice;1+fracreturnsl];>> prices1=cumprod(x1);>> t=(1:length(prices1))';>> randn('state',27)>> fracreturns2=0.0015*randn(200,1)+0.0003;>> x2=[startprices;1+fracreturns2];??? Undefined function or variable 'startprices'.>> x2=[startprice;1+fracreturns2];>> prices=cumprod(x2);whosName Size Bytes ClassL 51x51 20808 double arrayfracreturns2 200x1 1600 double arrayfracreturnsl 200x1 1600 double arrayl1 1x1 8 double arrayl2 1x1 8 double arrayprices 201x1 1608 double arrayprices1 201x1 1608 double arrays 1x1 8 double arraystartprice 1x1 8 double arrayt 201x1 1608 double arrayx1 201x1 1608 double arrayx2 201x1 1608 double arrayGrand total is 4010 elements using 32080 bytes>> plot (fracreturnsl, 'DisplayName', 'fracreturnsl', 'YDataSource', 'fracreturnsl'); figure(gcf) >> hist (fracreturnsl); figure(gcf)>> bar (fracreturnsl, 'DisplayName', 'fracreturnsl', 'YDataSource', 'fracreturnsl'); figure(gcf) >> pie (fracreturnsl); figure(gcf)Warning: Ignoring non-positive data in pie chart.> In pie at 40>> stairs (fracreturnsl, 'DisplayName', 'fracreturnsl', 'YDataSource', 'fracreturnsl'); figure(gcf) >> plot (fracreturnsl, 'DisplayName', 'fracreturnsl', 'YDataSource', 'fracreturnsl'); figure(gcf) >> whosName Size Bytes ClassL 51x51 20808 double arrayfracreturns2 200x1 1600 double arrayfracreturnsl 200x1 1600 double arrayl1 1x1 8 double arrayl2 1x1 8 double arrayprices 201x1 1608 double arrayprices1 201x1 1608 double arrays 1x1 8 double arraystartprice 1x1 8 double arrayt 201x1 1608 double arrayx1 201x1 1608 double arrayx2 201x1 1608 double arrayGrand total is 4010 elements using 32080 bytes>> plot (prices1, 'DisplayName', 'prices1', 'YDataSource', 'prices1'); figure(gcf)>> plot (prices, 'DisplayName', 'prices', 'YDataSource', 'prices'); figure(gcf)>> plot (x1, 'DisplayName', 'x1', 'YDataSource', 'x1'); figure(gcf)>> hist (x1); figure(gcf)>> stem (x1, 'DisplayName', 'x1', 'YDataSource', 'x1'); figure(gcf)>> plot (prices2,'DisplayName','prices2','YDateSource','prices');figure(gef)??? Undefined function or variable 'prices2'.>>>> plot ('prices2','DisplayName','prices2','YDateSource','prices');figure(gef)??? Error using ==> plotMATLAB:Graphics:Plot.>> plot (prices2,'DisplayName','prices2','YDateSource','prices');figure(gcf)??? Undefined function or variable 'prices2'.>> plot (prices2,'DisplayName','prices2','YDateSource','prices2');figure(gcf)??? Undefined function or variable 'prices2'.>> figure; pcolor (x1); figure(gcf)??? Error using ==> surfaceZ must be a matrix, not a scalar or vector.Error in ==> pcolor at 53hh = surface(zeros(size(x)),x,'parent',cax);>> plottools>> plot (prices1, 'DisplayName', 'prices1', 'YDataSource', 'prices1'); figure(gcf)>> plot (fracreturns2, 'DisplayName', 'fracreturns2', 'YDataSource', 'fracreturns2'); figure(gcf) >> plot (prices, 'DisplayName', 'prices', 'YDataSource', 'prices'); figure(gcf)>> plot (fracreturns2, 'DisplayName', 'fracreturns2', 'YDataSource', 'fracreturns2'); figure(gcf)>> plot (fracreturns2, 'DisplayName', 'fracreturns2', 'YDataSource', 'fracreturns2'); figure(gcf) >> plot (t, 'DisplayName', 't', 'YDataSource', 't'); figure(gcf)>> plot (prices1, 'DisplayName', 'prices1', 'YDataSource', 'prices1'); figure(gcf)>> plot (fracreturnsl, 'DisplayName', 'fracreturnsl', 'YDataSource', 'fracreturnsl'); figure(gcf) >> plot (fracreturns2, 'DisplayName', 'fracreturns2', 'YDataSource', 'fracreturns2'); figure(gcf) >> plot (prices, 'DisplayName', 'prices', 'YDataSource', 'prices'); figure(gcf)>> plot (fracreturns2, 'DisplayName', 'fracreturns2', 'YDataSource', 'fracreturns2'); figure(gcf) >> plot (fracreturns2, 'DisplayName', 'fracreturns2', 'YDataSource', 'fracreturns2'); figure(gcf) >> plottoolsWarning: Plot empty.> In legend at 193In insertmenufcn at 53>> logo>> plot (prices, 'DisplayName', 'prices', 'YDataSource', 'prices'); figure(gcf)>> plot (prices1, 'DisplayName', 'prices1', 'YDataSource', 'prices1'); figure(gcf)>> plot (prices, 'DisplayName', 'prices', 'YDataSource', 'prices'); figure(gcf)>> plot (prices1, 'DisplayName', 'prices1', 'YDataSource', 'prices1'); figure(gcf)>> plot (prices1, 'DisplayName', 'prices1', 'YDataSource', 'prices1'); figure(gcf)>> plot (prices, 'DisplayName', 'prices', 'YDataSource', 'prices'); figure(gcf)>>。