雅思图表作文经典例句
- 格式:docx
- 大小:24.45 KB
- 文档页数:7
雅思图表作文经典句型一.上升增长1.…add up to…增加了e.g. The total amount of …added up to 14 billion pounds(14%) in 1994.2.to jump to / to soar to.. 一跃达到/ 猛增到…e.g. The total working days lost soaredto 10 million in 1979.3.…an increase of about…percent as compared with.. 与…相比大约增加了…e.g. In August as many as 39 car accidents were reported, indicating an increase of about 79% as compared with the number of January.4.…to experience an increase/incline …有了增长e.g. Tobacco consumption is experiencing an incline.二.下降,减少1.…to sink/drop/reduce to…减少到…e.g. The rate of strikes sank/dropped to the lowest point in 1979.2.…to experience a decrease/decline …有了减少e.g. Tobacco consumption is experiencing a decrease.注意:修饰上升/减少的副词有:rapidly slowly dramatically respectively 表达上升/减少的最后状态的词有:the highest peak the lowest point 10 million 10%三.起伏1.…to go up and down …起伏不定e.g. The strike rate went up and down during the period from 1952 to 1967.2.There be ups and downs …有起有伏e.g. Between 1972 and 1979, there were several ups and downs in (某方面).四.稳定1.…to remain steady/level/unchanged …保持稳定,几乎不变e.g. The rate of …remained steady(fairly level/almost unchanged) during the four years from 1963 to 1967.2.…to level off (vi.)e.g. After a steady decline for a whole decade, the …rate shows signs of leveling off.注意:修饰起伏或稳定状态的副词有:almost fairly 可以用于表达起伏,稳定状态的句子中的词组或句型:the general situation was not worseningshow indications(迹象)of improvementit can be predicted(预知)that…e.g. The rate of …remained steady during the four years from 1963 to 1967,and it can be predicted that the general situation was not worsening.e.g. The rate of …remained steady during the four years from 1963 to 1967,showing signs of improvement in …五.成正比,反比1.…be in direct /inverse ratio to/with 与…成正比/反比e.g. Male illustrations are in direct ratio to /with the advancement of grades, while female illustrations are in inverse ratio.六.占百分之几,几分之几1….to form/comprise/make up/constitute ….percent …占百分之…e.g. W omen comprise more than 50% of the US. population.e.g. Females make up only 24% of the illustrations whereas males constitute 76%.2.…to form/comprise/constitute a half/third/fourth of……占…的1/2,1/3,1/4e.g. Female illustrious form less than a fourth of the total.3.…account for…percent占百分之几e.g. ……, accounting for approximately 20 percent of…七.倍数1.A be …times as much/many as Be.g. The annual rainfall of Hunan is 5 times as much as that of Sichuan.2.A doubles/is half/triples B A是B的两倍,一半,三倍e.g. The annual rainfall of Jidda doubles that of Janta, but is only half the amount of rain Kuwait receives each year.附一圆盘比例型图表例:一个圆盘显示了大学生在food, books, transportations, entertainment, clothes, unknown中的开销,它们各自占的比例依次是60%,3%,5%,10%,10%,12%,要求你描叙这个圆盘图。
雅思考试图表作文句型、模板描述上升①The period between 10 o 'clock and 12 o'clock saw a slight growth in the number of people in the station, with the number reaching 280 at midday.②The next two hours experiences/ witnesses/ saw a sharp rise again, with 6 pm arriving at 380 people.(在哪段时间。
)表示趋势的短语1.最高点:peak at, reach the highest point at,2.最低点:bottom out at, reach the bottom at, the lowest point at3.达到多少(量):reach, arrive at, amount to, hit, stand at4.预测(会有)多少:predict, expect, forecast句型为:A is predicted/ expected/forecasted to reach …描述下降①From this point onwards, the number plunges to only 100 from 2 pm to 4 pm.②After 6 pm, the number falls again, reaching the lowest point of 130 at 8 pm.(从哪儿/何时起。
)描述不变①At first at 6 am the number of people at the station stands at only 100.②Numbers in the following two hours level off at just under 300 people.⑵ 站上哪点。
雅思作文图表题范文第1篇It is said that countries are becoming similar to each other because of the global spread of the same products, which are now available for purchase almost anywhere. I strongly believe that this modern development is largely detrimental to culture and traditions worldwide.A country’s history, language and ethos are all inextricably bound up in its manufactured artefacts. If the relentless advance of international brands into every corner of the world continues, these bland packages might one day completely oust the traditional objects of a nation, which would be a loss of richness and diversity in the world, as well as the sad disappearance of the manifestations of a place’s character. What would a Japanese tea ceremony be without its specially crafted teapot, or a Fijian kava ritual without its bowl made from a certain type of tree bark?Let us not forget either that traditional products, whether these be medicines, cosmetics, toy, clothes, utensils or food, provide employment for local people. The spread of multinational products can often bring in its wake a loss of jobs, as people urn to buying the new brand, perhaps thinking it more glamorous than the one they are used to. This eventually puts old-school craftspeople out of work.Finally, tourism numbers may also be affected, as travelers become disillusioned with finding every place just the same as the one they visited previously. To see the same products in shops the world over is boring, and does not impel visitors to open their wallets in the same way that trinkets or souvenirs unique to the particular area too.Some may argue that all people are entitled to have access to the same products, but I say that local objects suit local conditions best, and that faceless uniformity worldwide is an unwelcome and dreary prospect.Heres my full answer:The line graphs show the average monthly amount that parents in Britain spent on their children’s sporting activities and the number of British children who took part in three different sports from 2008 to is clear that parents spent more money each year on their children’s participation in sports over the six-year period. In terms of the number of children taking part, football was significantly more popular than athletics and 2008, British parents spent an average of around £20 per month on their children’s sporting activities. Parents’ spending on children’s sports increased gradually over the following six years, and by 2014 the average monthly amount had risen to just over £ at participation numbers, in 2008 approximately 8 million British children played football, while only 2 million children were enrolled in swimming clubs and less than 1 million practised athletics. The figures for football participation remained relatively stable over the following 6 years. By contrast, participation in swimming almost doubled, to nearly 4 million children, and there was a near fivefold increase in the number of children doing athletics.剑桥雅思6test1大作文范文,剑桥雅思6test1大作文task2高分范文+真题答案实感。
雅思图表作文模板句Para1. This is a table / chart / (line线状bar柱状pie饼状)graph which demonstrate / illustrate / reveal /depict /privide information about............. Para2. (1)Obvious /Apparent from the graph is that ...rank the first/highest,while/whereas ....turn out to be the lowest(2)It is exhibited/shown in the table that.....(3)It can be seen from the table that.....Para3.(1)饼.柱图A,which accounts for...%,ranks the first;then next is B with...%;followed by C,constituting...%;finally it comes D.E.F at...%...%and...%respectively(2)特殊变化(不变,增长或下降多的)①It is worth mentioning that....②It must be pointed out that....③More striking/suprising is that....Para4.To conclude /In conclusion/overallPara5. this is a graph which illustrates...这个图表向我们展示了...Para6 .this table shows the changing proportion of a &b from...to...该表格描述了...年到...年间a与b的比例关系。

范文9篇1。
The graph shows the fluctuation in the number of people at London underground station over the course of a day。
According to the graph there is a sharp increase between 6 and 8am in the morning, with 400 people using the station at 8:00am。
After this, the numbers fall dramatically to less than 200 at 10 o’clock。
Between 11:00am and 3:00pm, the number of people rises and falls evenly with a plateau around lunch time of just under 300 people using the station。
Numbers then decline, with the lowest number being recorded at 4。
00 in the afternoon。
There is then a rapid rise between 4pm and 6pm during the evening rush hour with a peak of 380people at 6pm。
After 7pm numbers fall significantly, with only a slight increase again just after 8pm, tailing off after 9pm。
The graph shows that the station is most crowded in the early morning and early evening rush-hour periods。
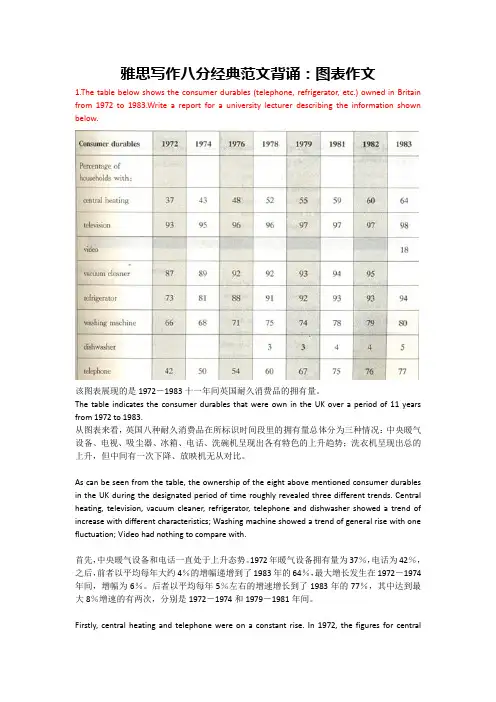
雅思写作八分经典范文背诵:图表作文1.The table below shows the consumer durables (telephone, refrigerator, etc.) owned in Britain from 1972 to 1983.Write a report for a university lecturer describing the information shown below.该图表展现的是1972-1983十一年间英国耐久消费品的拥有量。
The table indicates the consumer durables that were own in the UK over a period of 11 years from 1972 to 1983.从图表来看,英国八种耐久消费品在所标识时间段里的拥有量总体分为三种情况:中央暖气设备、电视、吸尘器、冰箱、电话、洗碗机呈现出各有特色的上升趋势;洗衣机呈现出总的上升,但中间有一次下降、放映机无从对比。
As can be seen from the table, the ownership of the eight above mentioned consumer durables in the UK during the designated period of time roughly revealed three different trends. Central heating, television, vacuum cleaner, refrigerator, telephone and dishwasher showed a trend of increase with different characteristics; Washing machine showed a trend of general rise with one fluctuation; Video had nothing to compare with.首先,中央暖气设备和电话一直处于上升态势。
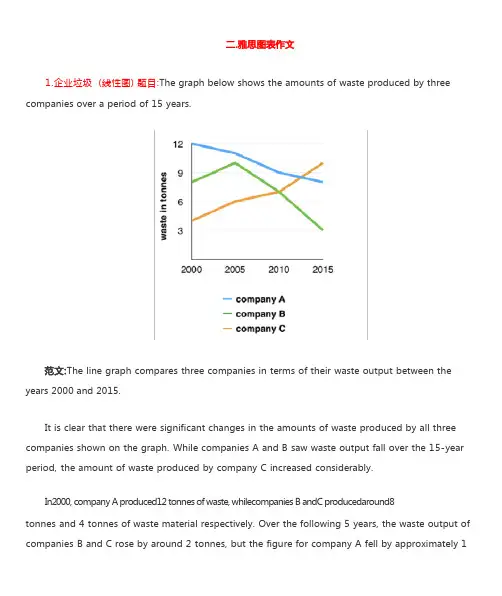
1.企业垃圾 (线性图) 题目:The graph below shows the amounts of waste produced by three companies over a period of 15 years.years 2000 and 2015.It is clear that there were significant changes in the amounts of waste produced by all three companies shown on the graph. While companies A and B saw waste output fall over the 15-year period, the amount of waste produced by company C increased considerably.In2000, company A produced12 tonnes of waste, whilecompanies B andC producedaround8tonnes and 4 tonnes of waste material respectively. Over the following 5 years, the waste output of companies B and C rose by around 2 tonnes, but the figure for company A fell by approximately 1tonne.From 2005 to 2015, company A cut waste production by roughly 3 tonnes, and company B reduced its waste by around 7 tonnes. By contrast, company C saw anincrease inwaste productionof approximately 4 tonnes over the same 10- year period. By 2015, company C’swaste output hadrisento10tonnes, while the respective amounts of waste fromcompanies A andB haddroppedto8 tonnes and only 3 tonnes.(192 words, band 9)这条线图对三家公司的废物产出从 2000 年到 2015 年进行了比较。
雅思图表作文数据描述例句表示上升和下降的说法:1.The proportion of the people who were divorced went up from2.5% in 1981 to 7.5% in 1991, rising further to 8% in 2001.2.The crop yields worldwide in 1990 were 15% up on those of 1985.3. The number of shoppers during the Christmas period plunged by up to 23 per cent since then on.4. After five years of steady decline, the high-school drop-out rate started to rise.5. Oil consumption grew steadily from 1980 to 2000, apart from in 1990, when there was a drop of 5 per cent.6. House prices fell as much as 40% between 1980 and 1985, compared with the period 1986 to 1990, when prices roughly doubled.7. Arable land was being lost at the rate of over 38 thousand square miles per year throughout the 1980s.8. Exports topped $10 billion in 2006, with those to Asia Pacific in excess of $2 billion.9. The smoking rate in young girls was on the rise, similar to that among adult women.10. Motorcycle casualities were in decline, down from a total of 54,037 in 1995 to 38,090 in 2000.11. Gender equality would lead to 13.4 million fewer homeless children, a 13% reduction.12. Inflation is likely to moderate through the early months of 2007.13. The number of married couples showed a significant decline, accounting for 50.7% of the adult population, compared with 68% in 1971.14. The smaller gap between movie-goers and television viewers reflected a 5% drop in the number of people who g to the cinema and a 1.2% increase in those who enjoy watching TV at home.表示占据的说法:15. V olunteers constitute nearly half of the work force of the health care sector.16. While Asians account for 11% of the American population, Hispanics comprise 8%.17. Women make up 52 % of the population of Britain.\18.18. Landfill is composed of 36% municipal waste, 24% commercial and industrial waste and 40% construction waste.表示倍数的说法:19. Rent as a percentage of the household expenditure more than doubled between 1974 and 1998, from 5% to 12%.20. Britons were twice as likely to die from hear attacks as Italians and three times as Chinese.21. Women working as childminders in the under-35 age group in 1995 were almost twice as many as in 1990.22. Television was twice as popular as washing machine in 1990, with close to 10% of households owning one TV set at home.23. Young people used the Internet more than three times as often as the general population in 1999.24. The study found that people who earned more than $100,000 received nearly 50% more junk mails than lower carners.25. It also found that those on higher incomes lost on average four times more money than other victims in property-related crime.26. China’s agricultural trade deficit against US jumped 1.5 times to $ 35 billion over the five-year period.读数据的方法:27. A quarter of the customers were African origin.28. Some 700 migrants arrived to live in Australia every week in 2005.29. Of course UK residents who traveled overseas, some 210,000 went to America.30. The overall UK population was some 58 million in 2001, 17% higher than in 1951.31. With an estimated 100 million international migrants worldwide, the proportion of people living outside their country of birth approached 2% of the world’s population in 2002.32. Americans spent a total of $ 12.5 billion on gifts in 2005 alone, with $6.5 billion of that on toys.33. An aggregate of 40,000 households bought new vehicles, three times more than the number in 2004.34. The per-capita spending of visitors in China stood at 1,000 US dollars of so in 2000, a year-on-year rise of one percent.35. Indonesia is still an impoverished country, with the population below poverty line exceeding half a billion.36. The number of people living on less than $1 a day in Asia dropped by nearly a quarter of a billion people between 1990 and 2002.37. Two-parent families now work an average of almost 400 more hours a year than they did 20 years ago.38. There were 100,000 more people working on a full-time basis in 2004 than in 1994.39. It is shown in the chart that up to two million children were orphaned in 2002 in Africa, half a million higher than the 2001’s record figure.40. It was discovered that less than a fifth of the public money went to education.41. Two-fifths of the population are suffering different levels of obesity.42. Between half and two-thirds of smokers did of something other than smoking.43. More than one-third of the British population has trouble sleeping from time to time.44. In total, 2,400 magazines were sold within a week---200 a day---more than half of which were for female reader.45. Currently, approximately 6,000 languages still exist, the majority of which are under threat.46. Cohabiting couples made up one in ten of the population in 1990---double the number a decade earlier.47. A staggering four in ten students had the experience of using marijuana.48. Fewer than three in ten people were ethnic minorities.49. According to the survey, a billion and a half of the world’s citizens had no access to electricity in the year 2004, and almost as many lacked electricity in 2005.50. 89% of drinks containers in Britain are recycled---far higher than the European average of 20% to 40%.51. The world population is projected to grow from 6 billion in 1999 to 9 billion by 2042, an increase of 50% that will require 43 years.52. Just 18% of smokers were planning to give up smoking, while a further 42.4% said that they would “possibly” do so.53. As many as 78% of men were doing administrative work, whereas women who were working as sales and customer services staff rose to a record 75%.54. About 42% of students chose science as their subject, 40% engineering and the rest arts.55. 40% of respondents said that students should be responsible for university fees, another 40% considered it the responsibility of the government, and the remaining 20% viewed it as a shared responsibility.56. The number of people enrolling for adult education courses increased by about 5% in 1999, lower than those for 1995 and 1996, when 1.5 million and 1.8 people respectively were enrolled.表示时间的说法:57. Since then, growth had started to accelerate, up to 3% on average annually between 1995 and 2000.58. Consumer spending rose 0.5% in Nov. after an increase of 0.3% a month earlier.59. The industrial output growth had slowed to 2% by 2005.60. By the end of 2005, nearly 30% of commuters used public transport, a slight increase on the figures for 2003.61. Britain’s GDP is expected to surpass that of France by the end of 2010.62. In 1993, 60% of Vietnam’s population was classified as being under the internationally-accepted poverty line, but that figure had fallen to less than 20% by 2004.63. From the 1970s onwards, the volume of exports underwent a period of growth.64. For twenty years or so, there was an upward trend in the number of deaths caused by heart disease.65. There was a steady increase in the enlistment of the armed force in Vietnam over the period 1970 to 1980.66. The secondary school enrolment rate sank considerably after an increase of 10% during the period from the mid-1980s to the early 1990s.67. Although 70% of the smokers said they wanted to quit smoking, a mere 3% of them were successful in those given years.68. By age 15, Americans are less likely to smoke than Europeans, although the 10-to-13-year-olds in America are likely to smoke as European 10-to13-year-olds.69. Someone who starts smoking aged 15 is three times more likely to die of cancer due to smoking than someone who starts in late20s.70. Overall, 11% of people aged between 35 and 45 in the UK said they were not in good health.71. The PCs sold dipped 30% to 12.3 million in 2001, before a substantial increase in the following three years.72. Prior to a surge to a record high in 1983, food supplies stagnated for nearly ten years.73. After experiencing alarming increases during the second half of the 1990s, juvenile delinquency was at its lowest level for at least five years.74. The reported crime rate dropped more than 5%, compared to the same time in 2005.75. Carbon dioxide emissions were rising by les than 2% annually up to the year 1999, but now rising at 4% or so per year.76. The popularity of some activities, such as jigsaw puzzle, declined noticeably as the age increases.77. There was a downward trend in the years 1998 and 1999.78. Over the course of the last century, the global population rose form under two billion to just over six billion.79. Australia’s share of Japanese tourist market shrank from 9% to 2% in just a 10-year period.表示平稳或波动的说法:80. The population reached a plateau in 1990, before declining suddenly in 2001.81. The annual population growth rate fluctuated between 1% and 2% during the ten-year period.82. There were strong fluctuations in birth rates throughout the five years from 1995 to 2000.83. In spite of a growth in the working population, the unemployment rate was flat at 7.8%.84. The output rose and fell within a narrow range between 41.2 million tons and 51.2 million tons.85. The number of young people obtaining qualifications remained static (slightly above 30%).86. LED TV prices remained steady for three years in a row apart from (despite, except) a slump in 2003.87. The mobile phone owner growth remained constant and averaged, 1% per year in both the US and the UK up to 2003.88. Enrolments rose dramatically to more than half a million and remained around that figure in 1965.89. The unemployment rate stabilized at a higher level by around 1995.90. Industrial production continued to stagnate, after 12 years of tremendous growth.91. There had been slight oscillations in temperature throughout the 1970s and 1980s.表示历史值的说法:92. UK trade deficit with China rose almost 10% to 3 billion, a ten-year high.93. The proportion of single-parent families reached and all-time record of 15%.94. Auckland received non more than 200 mm of rain per month on average in 1990, a new low in the twenty-year period.95. The total number of regular Internet users experienced an unprecedented rise in 2002, its sixth annual rise in a row.96. Britain’s crime rate peaked at 9% or so in 1999.97. The greatest increase was in the proportion on the people who are overweight, 15% up form 8% in 1989.98. Unemployment figures remained high, ranging from 12,5% to 15%.99. Youngsters spent a mere 5% of their pocket money on cigarettes in 2003, the fourth lowest on record.排列比较的说法:100. The US ranked in the world’s top five as a car manufacturer in 1985, but slipped to seventh in 1990 and plummeted to tenth in 1995.101. Japan led other countries in life expectancy (81.2 years); Australia and Canada followed behind, 80.55 years and 80.2 years respectively.102. The latest figures show that China has come second in terms of GDP, following the lead of the United States and narrowly beating Japan into third place.103. France has risen two places to number four in the OECD countries, behind America, Japan and Britain.104. Saturn is the second largest planet after Jupiter, with a diameter nearly ten times that of Earth.105. In terms of GDP, Mexico, which did not appear in the top20 in2000, came in at 14th in 2005.106. While the Asian countries compare favorably with their European counterparts, several have dropped in ranking. 107. Practical crafts was the most popular subject area, with an enrolment rate of 45%, closely followed by physical education and sport.108. The US was ahead with an increase of 10% and China came second with 8%.109. China is the world’s most populous country, with a population of more than 1.4 billion, far ahead of India, with 1 billion people.110. China overtook America in 199 and became the largest export country.111. In 1999, Australia ranked second, behind the USA, in terms of domestic waste generation.112. The population growth in the UK was lower than the European Union average of 23% and far below the growth in the United States (80%) over the same period.113. Students made up the biggest proportion of employees in low paid occupations (65%), while high school students were most likely to have a professional job (40%).114. While the number of full-time female workers grew, that of full-time male workers declined.115. Whereas developing countries more than doubled car emissions, from 3 billion to 6.2 billion, industrialized countries cut theirs by half, form 4 billion down to 2 billion.116. The population of France is only marginally larger than that of Britain.117. The drop in 1995 was at odds with the sharp rise in 1999.118. With regard to government spending on education, there was a sharp reduction during the five-year-long period (223 million in 1989 versus 11o million in 1994).119. The income differences between sexes even out with age.120. In Africa, there are around 14 women living with HIV for every 10 men.121. The proportion of homeowners was as high as 78% in 1989, in marked contrast to a mere 35% a decade earlier. 122. Women were more likely to be part-time workers throughout the 1990s, with more than two out of five women working part-time, compared with one in ten men.123. The jobless rate in 1990 was 4%, the lowest level in more than ten years, as against 10% in 1980.124. Among the leading reasons why an adult considered education in 2004, 65% said that it was helpful, while 24% chose it simply because they loved studying.125. The average American produces 6 tones of carbon dioxide, a Chinese 0.7 tones and an Indian 0.25 tones.。

完整版)雅思经典图表作文范文XXX in fast food and sit-down restaurants.As can be seen from the charts。
XXX over the years。
In 1970.only 25% of a family's food budget was spent on eating out。
but this figure rose to almost 50% in 2000.This trend is likely dueto the XXX.The graph shows that the number of meals eaten in fast food restaurants has increased significantly compared to sit-down restaurants。
In 1980.the average person ate 20 meals in fast food restaurants and 60 meals in sit-XXX。
by 2000.the average person ate 60 meals in fast food restaurants and only 20 meals in sit-XXX fast-XXX society。
XXX.XXX。
XXX a negative one。
as it allows XXX。
it is XXX.Over the past three decades。
XXX。
In 1970.only 10% of the food budget was XXX。
but by 1980.this had increased to 15%。
In 1990.the pXXX 35%。
and in 2000.it rose again to 50%。
The n of family restaurant meals has also changed over the years。
1.首先,从1月份55%:45%的女生与男生比例起步,我们看到连续三个月女生比例的大幅增长,到5月份,这一比例已经变为75%:25%。
Firstly, starting from a 55%:45% female and male student ratio in January, we witnessed a substantial increase in the percentages of female students for three consecutive months and till May, this ratio had become 75%:25%.2.首先,托雅的月营业额从1月份的25万起步,在接下来的7个月里连续不断攀升,于8月份达到顶峰的485万。
Firstly, starting from ¥250,000 in January, the monthly sales volume of Toya experienced constant growths for 7 months in a row and peaked at ¥4.85 million in August.3.首先,托雅从1月份的10名全职教师起步,先后经历了11名、14名、20名、25名、40名,最后增长到了12月份的48名。
To begin with, starting from 10 fulltime teachers in January, the number of Toya teachers increased gradually to 11, 14, 20, 25, 40, and eventually reached 48 in December.4.首先,托福项目的招生量从1月份的18人起步,平稳上升3个月后,从5月份开始呈现强劲增长势头,达到了7月份的峰198人。
Firstly, starting from 18 students in January, the enrollment of TOEFL learners increased steadily for three months in a row and began to gain a stronger momentum of increase from May, finally peaking at 198 in July.5.八月份托福项目的招生跳水到了12人,但接着在九月份开始反弹回到48人,接下来的十月份再次加速提升到98人。
雅思图表作文数据描述例句表示上升和下降的说法:1.The proportion of the people who were divorced went up from2.5% in 1981 to 7.5% in 1991, rising further to 8% in 2001.(离婚在1991年人民的比例从2.5%去1981年到7.5%,在2001年进一步上升到8%。
)2.The crop yields worldwide in 1990 were 15% up on those of 1985. (1990年的全世界谷物收获量比1985年增长了15%)3. The number of shoppers during the Christmas period plunged by up to 23 per cent since then on. (1990年的全世界谷物收获量比1985年增长了15%)4. After five years of steady decline, the high-school drop-out rate started to rise. (在五年平稳的衰落以后,高中退学率开始上涨)5. Oil consumption grew steadily from 1980 to 2000, apart from in 1990, when there wasa drop of 5 per cent. (从1980年到2000年石油消耗平稳地增长,1990年除外,下降了5%.)6. House prices fell as much as 40% between 1980 and 1985, compared with the period 1986 to 1990, when prices roughly doubled.7. Arable land was being lost at the rate of over 38 thousand square miles per year throughout the 1980s.8. Exports topped $10 billion in 2006, with those to Asia Pacific in excess of $2 billion.9. The smoking rate in young girls was on the rise, similar to that among adult women.(青年女子的抽烟率在逐渐增长,类似于成年妇女).10. Motorcycle casualities were in decline, down from a total of 54,037 in 1995 to 38,090 in 2000.11. Gender equality would lead to 13.4 million fewer homeless children, a 13% reduction.12. Inflation is likely to moderate through the early months of 2007.13. The number of married couples showed a significant decline, accounting for 50.7% of the adult population, compared with 68% in 1971.14. The smaller gap between movie-goers and television viewers reflected a 5% drop in the number of people who g to the cinema and a 1.2% increase in those who enjoy watching TV at home. 常看电影的人和电视观众之间的更小的差距,反映在喜欢去电影院的人数下降了5%,而喜欢在家看电视的则增加了1.2%.表示占据的说法:15. V olunteers constitute nearly half of the work force of the health care sector. (志愿者构成几乎是卫生保健部门的劳动人口的一半)。
雅思图表作文经典句型参考雅思图表作文经典句型参考1.the table shows the changes in the number of...over the period from...to... 该表格描述了在.。
年之.。
年间.。
数量的变化。
2.the bar chart illustrates that... 该柱状图展示了.。
3.the graph provides some interesting data regarding... 该图为我们提供了有关.。
有趣数据。
4.the diagram shows ... 该图向我们展示了.。
5.the pie graph depicts .... 该圆形图提醒了.。
6.this is a cure graph which describes the trend of... 这个曲线图描述了.。
的趋势。
7.the figures/statistics show ... 数据说明.。
8.the tree diagram reveals how... 该树型图向我们提醒了如何.。
9.the data/statistics show ... 该数据可以这样理解.。
10.the data/statistics/figures lead us to the conclusion that... 这些数据资料令我们得出结论.。
11.as is shown/demonstrated/exhibited in thediagram/graph/chart/table... 如下图.。
12.aording to the chart/figures... 根据这些表.。
13.as is shown in the table... 如表格所示.。
14.as can be seen from the diagram,great changes have taken place in... 从图中可以看出,.。
雅思4类图表作文范文
一、柱状图。
哇塞,看这柱状图,某城市的私家车数量可是像火箭一样往上
冲啊!五年前才5万辆,现在直接飙到15万辆了,涨得比房价还快!不过话说回来,公共交通那边就不太好过了,以前每天80万人次,
现在只剩下60万了,看来大家都更喜欢自己开车出门啊。
二、折线图。
话说这折线图,看得我心情都跟着起伏了。
那国家失业率啊,
前几年涨得跟股票似的,从4%一路飙升到6%,让人看了都捏把汗。
不过好在后来稳住了,还往下掉了点,虽然没回到从前,但好歹也
算个好兆头吧。
1.我们可以从图表上看出:托雅的女生比例远远高于男生所占比例。
As can be seen from the chart, the percentage of female students was far higher than that of male students at Toya.2.从图表反映的情况来看:读雅思的人数远远超过读托福的,同时,读托福的人数一直呈现平稳上升趋势。
As can be seen from the chart, those who chose to study for IELTS far outnumbered those choosing to study for TOEFL. Meanwhile, the number of those who chose to study for TOEFL was on a steady rise.3.从图表反映的情况来看:托雅学生在饭店用餐的频率在不同的月份呈现出了相应的波动趋势。
As can be seen from the diagram, the frequency of Toya students eating at restaurants revealed a trend of fluctuations in different months.4.从图表反映的情况来看:托雅男教师所承担的每周工作量要高于女教师的。
As can be seen from the charts, the weekly workload borne by male teachers outweighed that of female teachers at Toya.6.从整个图表反映的情况来看:托雅教师的收入状况呈现出了稳步增长的总态势。
As can be seen from the chart, the income of Toya teachersrevealed a general trend of steady rise.7.图表显示:托雅广告投入呈现出逐渐下降的趋势,然而有趣的是,营业收入却呈现出大幅度的攀升。
雅思图表作文模板句Para1. This is a table / chart / (line线状bar柱状pie饼状)graph which demonstrate / illustrate / reveal /depict /privide information about............. Para2. (1)Obvious /Apparent from the graph is that ...rank the first/highest,while/whereas ....turn out to be the lowest(2)It is exhibited/shown in the table that.....(3)It can be seen from the table that.....Para3.(1)饼.柱图A,which accounts for...%,ranks the first;then next is B with...%;followed by C,constituting...%;finally it comes D.E.F at...%...%and...%respectively(2)特殊变化(不变,增长或下降多的)①It is worth mentioning that....②It must be pointed out that....③More striking/suprising is that....Para4.To conclude /In conclusion/overallPara5. this is a graph which illustrates...这个图表向我们展示了...Para6 .this table shows the changing proportion of a &b from...to...该表格描述了...年到...年间a与b的比例关系。
雅思图表作文经典句型30句1.我们能够从图表上看出托雅的女生比率远远高于男生所占比率。
As can be seen from the chart, the percentage of female studentswas far higher than that of male students at Toya.2.从图表反应的状况来看读雅思的人数远远超出读托福的同时读托福的人数向来体现安稳上涨趋向。
As can be seen from the chart, those who chose to study for IELTSfar outnumbered those choosing to study for TOEFL. Meanwhile, thenumber of those who chose to study for TOEFL was on a steady rise.3.从图表反应的状况来看托雅学生在饭馆用餐的频次在不一样的月份体现出了相应的颠簸趋向。
As can be seen from the diagram, the frequency of Toya studentseating at restaurants revealed a trend of fluctuations in differentmonths.4.从图表反应的状况来看托雅男教师所肩负的每周工作量要高于女教师的。
As can be seen from the charts, the weekly workload borne by maleteachers outweighed that of female teachers at Toya.5.从整个图表反应的状况来看托雅总部以及五个分校的营业收入都体现出了迅速的增加趋向。
As can be seen from the chart, the sales of Toya Headquarter andthe five branch schools all revealed a trend of fast increase acrossthe board.6.从整个图表反应的状况来看托雅教师的收入状况体现出了稳步增加的总态势。
图表作文经典例句图表作文主要注意两个方面:•读题读图的顺序:掌握良好的读题读图习惯是图表作文考试时迅速准确答题的关键。
大部分考生在复习备考的时候,奖注意力放在数字描述上,到了考场迫不及待地套用句子,结果写的复杂而又不够清晰,很少能够获得好的分数;而掌握好的读图习惯,才可以在变化多端的图表和貌似杂乱无章的数据中迅速找到切入点。
•数字的描述和句子的结构:用恰当和丰富的表达解释数据,将句子写得简洁而不出现语法错误,这些是确保图表作文高分的关键。
图表作文经典例句表示“上升和下降”的说法1.The proportion of the people who were divorced went up from2.5% in1981 to 7.5% in 1991,rising further to 8% in 2001.2.The crop yields worldwide in 1990 were 15% up on those of 1985.3.The number of shoppers during the Christams period plunged by up to23 per cent since then on.4.After five years of steady decilne,the high-school drop-out rate torise.5.Oil consumption grew steadily from 1980 to 2000,apart from in1990,when there was a drop of 5 per cent.6.House prices fell as much as 40% between 1980 and 1985,compared withthe period 1986 to 1990,when prices roughly doubled.7.Arable land was being lost at the rate of over 38 thousand square milesper year througout the 1980s.8.Exports topped $10 billion in 2006,with those to Asia Pacific in excessof $2 billoin.9.The smoking rate in young girls was on the rise,similar to that amongadult women.10.Motorcycle casualties were in decline,down from a total of 54,037 in1995 to 38,090 in 2000.11.Gender equality would lead to 13.4 million fewer homeless childern,a13%reduction.12.Inflation is likely to moderate through the early months of 2007.13.The number of married couples showed a significant decline,accountingfor 50.7% of the adult population ,compared ith 68% in 1971.14.The smaller gap between movie-goers and television viewers reflecteda 5% drop in the number of people who go to the cinema and a 1.2% increasein those who enjoy watching TV at home.表示“占据”的说法:15.Volunters constitute nearly half of the work force of the health caresector.16.While Asians account for 11 per cent of the Americanpopulation ,Hispanics comprise 8 per cent.17.Women make up 52 per cent of the population of Britain.ndfill is composed of 36% municipal waste ,24% commercial andindustrial waste and 40% construction waste.表示“倍数”的说法:19.Rent as a percentage of the household expenditure more than doubledbetween 1974 and 1998,from 5% to 12%.20.Britons were twice as likely to die from heart attacks as Italians andthree times as Chinese.21.Women work as childminders in the under-35age group in 1995 were almosttwice as many as in 1990.22.Television was twice as popular as washing machine in 1990,with closeto 10 per cent of househols owning one TV set at home.23.Young people used the Internet more than three times as often as thegeneral population in 1999.24.The study found that people who earned more than $100,000 receivednearly 50% more junk mails than lower earners.25.It also found that those on higher incomes lost on average four timesmore money than other victims in property-related crime.26.China’s agricultural trade deficit against US jumped 1.5 times to $35billion over the five-year period.读数据的方法:27.A quarter of the customers were African origin.28.Some 700 migrants arrived to live in Australia every week in 2005.29.Of those UK residents who traveled overseas,some 210,000 went toAmerica.30.The overall UK population was some 58 million in 2001,17% higher thanin 1995.31.With an estimated 100 million international migrans worldwide,theproportion of people living outside their country of birth approached2 per cent of the world’s population in 2002.32.Americans spent a total of $12.5 billion on gifts in 2005 alone ,with$6.5 billion of that on toys.33.An aggregate of 40,000 households bought new vehicles,three times morethan the number in 2004.34.The per-capita apending of vistors in China stood at 1,000 US dollarsor so in 2000, a year-on-year rise of one per cent.35.Indonesia is still an impoverished country,with the population belowpoverty line exceeding half a billion.36.The number of people living on less than $1 a day in Asia dropped bynearly a quarter of a billion people between 1990 and 2002.37.Two-parent families now work an average of almost 400 more hours a yearthan they did 20 years ago.38.There were 100,000 more people working on full-time basis in 2004 thanin 1994.39.It is shown in the chart that up to two million children were orphanedin 2002 in Africa,half a million higher than the 2001’s record figure.40.It was discovered that less than a fifth of the public money went toeducation.41.Two-fifths of the population are suffering different levels ofobesity.42.Between half and two-thirds of somkers die of something other thansmoking.43.More than one-third of the British population has trouble sleeping fromtime to time.44.In total,1,400 magazines were sold within a weekz—200 a day—more thanhalf of which were for female readers.45.Currently, approximately 6,000 languages still exist,the majority ofwhich under threat.46.Cohabiting couples made up one in ten of the population in 1999—doublethe number a decade earlier.47.A staggering four in ten students had the experience of usingmarijuana.48.Fewer than three in ten people were ethnic minorities.49.According to the survey ,a billion and a half of the world’s had noaccess to electricity in the year 2004, and almost as many lacked electricity in 2005.50.80% of drinks containera in Britain are recycled—far higher than theEuropean average of 20% to 40%.51.The world population is projected to grow from 6 billion in 1999 to9 billion by 2042.an increase of 50 per cent that will require 43 years.52.Just 18% of smokers were planning to give up smoking,while a further42.4% said that they would “possibly” do so.53.As many as 78% of men were doing administrative work,whereas women whowere working as sales and customer services staff rose to a record 75%.54.About 42 per cent of students chose science as their subject, 40 percent engineering and the rest arts.55.40% of respondents said that students should be responsible foruniversity fees,another 40% considered it the responsibility of the government,and the remaining 20% viewed it as a shared responsibility.56.The number of people enrolling for adult education courses increasedby about 5% in 1999,lower than those for 1995 and 1996, when 1.5 million and 1.8 million people respectively were enrolled.表示“时间”的说法:57.Since then, growth had started to accelerate,up to 3 per cent on averageannually between 1995 and 2000.58.Consumer spending rose 0.5% in November after an increase of 0.3% amonth earlier.59.The industrial output growth had slowed to 2% by 2005.60.By the end of 2005,nearly 30% of commuters used public transport, aslight increase on the figures for 2003.61.Britain’s GDP is expected to surpass that of France by the end of 2010.62.In 1993,60% of Vietnam’s population was classified as being under theinternationally-accepted poverty line, but that figure had fallen to less than 20% by 2004.63.From the 1970s onwards,the volume of exports underwent a period ofgrowth.64.For twenty years or so,there was an upward trend in the number of deathscaused by heart disease.65.There was a steady increase in the enlistment of the armed force inVietnam over the period 1970 to 198066.The secondary school enrolment rate sank considerably after anincrease of 10 per cent during the period from the mid-1980s to the early 1990s.67.Although 70 per cent of the smokers said they wanted to quit smoking,amere 3 per cent of them were successful in those given years.68.By age 15,Americans are less likely to smoke than Europeans,althouhgthe 10-to-13-year-olds in America are as likely to smoke as European 10-to-13-year-olds.69.Someone who starts smoking aged 15 is three times more likely to dieof cancer due to smoking than someone who starts in late 20s.70.Overall,11% of people aged between 35 and 45 in the UK said that theywere not in good health.71.The PCs sold dipped 30% to 12.3 million in 2001, before a substantialincrease in the following three years.72.Prior to a surge to record high in 1983,food supplies stagnated fornearly ten years.73.After experiencing alarming increase during the second half of the1990s,juvenile delinquency was at its lowest level for at least five years.74.The reported crime rate dropped more than 5%,compared to the same timein 2005.75.Carbon dioxide emissions were rising by less than 2% annually up tothe year 1999,but now rising at 4% or so per year.76.The popularity of some activities,such as jigsaw puzzle ,declinednoticeably as the age increases.77.There was a downward trend in the years 1998 and 1999.78.Over the course of the last century, the global population rose fromunder two billion to just over six billion.79.Australia’s share of Japanese tourist market shrank from 9% to 2% injust a 10-year period.表示“平稳”或者“波动”的说法:80.The population reached a plateau in 1990,before declining suddenly in2001.81.The annual population growth rate fluctuated between 1% and 2% duringthe ten-year period.82.There were strong fluctuations in birth rates throughout the five yearsfrom 1995 to 2000.83.In spite of a growth in the working population,the unemployment ratewas flat at 7.8%.84.The output rose and fell within a narrow range between 41.2 milliontons and 51.2 million tons.85.The number of the young people obtaining qualificationsremainedstatic(slightly above 30%).86.LCD TV prices remained steady for three years in a row apartfrom(despite,except) a slump in 2003.87.The mobile phone owner growth remained constant and averaged,1 per centper year in both the US and the UK up to 2003.88.Enrolments rose dramatically to more than half a million and remainedaround that figure in 1965.89.The unemployment rate stabilised at a higher level by around 1995.90.Industrial production continued to stagnate,after 12 years oftremendous growth.91.There had been slight oscillations in temperature throughout the 1970sand 1980s.表示历史值的说法: trade deficit with China rose almost 10% to 3 billion , a ten-yearhigh.93.The proportion of single-parent families reached an all-time recordof 15%.94.Auckland received no more than 200 mm of rain per month on average in1990,a new low in the twenty-year period.95.The total number of regular Internet users experienced anunprecedented rise in 2002,its sixth annual rise in a row.96.Britain’s crime rate peaked at 9% or so in 1999.97.The greatest increase was in the proportion of the people who areoverweight ,15% up from 8% in 1989.98.Unemployment figures remained high,ranging from 12.5% to 15%.99.Youngsters spent a mere 5% of their pocket money on cigarettes in2003,the fourth lowest on record.排列比较的说法:100.The US ranked in the world’s top five as a car manufacturer in 1985,but slipped to seventh in 1990 and plummeted to tenth in 1995.101.Japan led other countries in life expectancy (81.2 years);Australia and Canada followed behind,80.55 years and 80.2 years respectively. 102.The latest figures show that China has come second in terms of GDP,following the lead of the United States and narrowly beating Japan into third place,103.France has risen two places to number four in the OECD countries,behind America,Japan and Britain.104.Saturn is the second largest planet after Jupiter,with a diameter nearly ten times that of Earth.105.In the terms of GDP,Mexico ,which did not appear in the top 20 in 2000,came in at 14th in 2005.106.While the Asian countries compare favourably with their European counterparts,several have dropped in ranking.107.Practical crafts was the most popular subject area,with an enrolment rate of 45%,closely followed by physical education and sport. 108.The US was ahead with an increase of 10% and China came second with 8%.109.China is the world’s most populous country,with a population of more than 1.4 billion ,far ahead of India,with 1 billion people.110.China overtook America in 1999 and became the largest export country. 111.In 1999,Australia ranked second ,behind the USA , in terms of domestic waste generation.112.The population growth in the UK was lower than the European Union average of 23% and far below the growth in the United States(80%) over the same period.113.Students made up the biggest proportion of employees in low paid occupations(65%),while high school students were most likely to havea professional job(40%).114.While the number of full-time female workers grew ,that of full-time male workers declined.115.Whereas developing countries more than doubled car emissions,from 3 billion to 6.2 billion,industrialised countries cut theirs byhalf,from 4 billion down to 2 billion116.The population of France is only marginally larger than that of Britain.117.The drop in 1995 was at odds with the sharp rise in 1999.118.With regards to government spending on education ,there was a sharp reduction during the five-year-long period(223 million in 1989 versus 110 million in 1994).119.The income differences between sexes even out with age.120.In Africa,there are around 14 women living with HIV for every 10 men. 121.The proportion of homeowners was as high as 78% in 1989, in marked contrast to a mere 35% a decade earlier.122.Women were more likely to be part-time workers throughout the 1990s,with more than two out of five women working part-time,compared with one in ten men.123.The jobless rate in 1990 was 4% ,the lowest level in more than ten years ,as against 10% in 1980.124.Among the leading reasons why an adult considered education in 2004,65% said that it was helpful,while 24% chose it simply because they loved studying.125.The average American produces 6 tonnes of carbon dioxide, a Chinese0.7 tonnes and an Indian 0.25 tonnes.。