曼昆宏观经济学第七版英文课件第八章
- 格式:ppt
- 大小:2.08 MB
- 文档页数:5


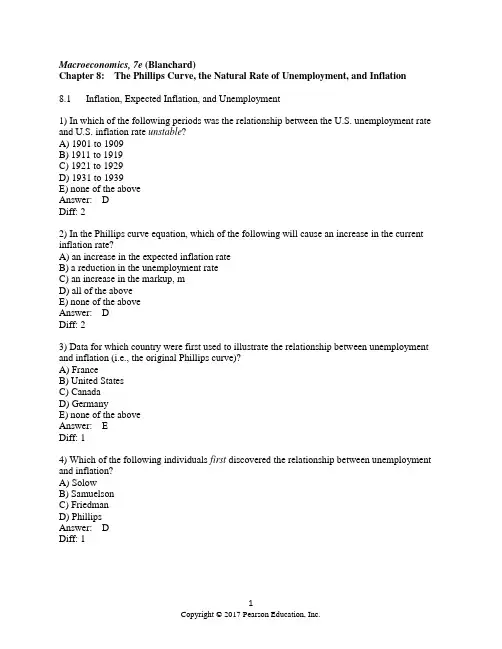
Macroeconomics, 7e (Blanchard)Chapter 8: The Phillips Curve, the Natural Rate of Unemployment, and Inflation8.1 Inflation, Expected Inflation, and Unemployment1) In which of the following periods was the relationship between the U.S. unemployment rate and U.S. inflation rate unstable?A) 1901 to 1909B) 1911 to 1919C) 1921 to 1929D) 1931 to 1939E) none of the aboveAnswer: DDiff: 22) In the Phillips curve equation, which of the following will cause an increase in the current inflation rate?A) an increase in the expected inflation rateB) a reduction in the unemployment rateC) an increase in the markup, mD) all of the aboveE) none of the aboveAnswer: DDiff: 23) Data for which country were first used to illustrate the relationship between unemployment and inflation (i.e., the original Phillips curve)?A) FranceB) United StatesC) CanadaD) GermanyE) none of the aboveAnswer: EDiff: 14) Which of the following individuals first discovered the relationship between unemployment and inflation?A) SolowB) SamuelsonC) FriedmanD) PhillipsAnswer: DDiff: 15) Which of the following individuals first discovered the relationship between unemployment and inflation for the United States?A) Solow and FriedmanB) Samuelson and SolowC) Friedman and PhillipsD) Friedman and PhelpsAnswer: BDiff: 16) Explain what is meant by the "wage-price" spiral.Answer: The wage-price spiral refers to the effects of low unemployment on inflation. Specifically, when the unemployment rate falls, the nominal wage will rise. As W rises, firms' costs increase causing them to increase prices. As prices rise, workers will later ask for increases in the nominal wage. This increase in W again causes firms' costs and prices to rise and the process repeats itself.Diff: 17) Based on the 'early incarnation' of the Phillips curve, explain what effect an increase in the unemployment rate will have on the inflation rate.Answer: An increase in u will cause a reduction in W. As W falls, firms' costs fall. As firms' costs fall, they will reduce the price level. This reduction in the price level represents, in this case, deflation.Diff: 28.2 The Philips Curve and Its Mutations1) Since approximately 1970, the most stable Phillips-type relationship for the United States has been between which of the following?A) the rate of inflation and the change in the unemployment rateB) the unemployment rate and the change in the rate of inflationC) the change in the unemployment rate and the change in the rate of inflationD) the inverse of the unemployment rate and the rate of inflationE) the unemployment rate and the rate of inflationAnswer: BDiff: 22) Which of the following assumptions best characterized the assumption about how individuals formed expectations of inflation by the early 1970s?A) Expected inflation for the current year was smaller than the previous year's inflation rate.B) Expected inflation for the current year was approximately equal to the previous year's inflation rate.C) Expected inflation for the current year was less than the previous year's inflation rate.D) Expected inflation for the current year equal to the average inflation rate over the past five years.E) Expected inflation for the current year equal to the average inflation rate over the past ten years.Answer: BDiff: 23) When inflation has not been very persistent, as was the case in the United States before the mid-1960s, we can expect thatA) the expected price level for a given year will equal the previous year's actual price level.B) the current inflation rate will not depend heavily on past years' inflation rates.C) lower unemployment rates will be associated with higher inflation rates.D) all of the aboveE) none of the aboveAnswer: DDiff: 24) When inflation has been persistent, as was the case in the United States during the 1970s, low unemployment rates will likely be associated withA) low natural rates of unemployment.B) high natural rates of unemployment.C) low but stable rates of inflation.D) high but stable rates of inflation.E) increases in the inflation rate.Answer: EDiff: 25) For this question, assume that individuals form expectations of inflation according to the following equation πe t= θπt-1. From 1970 on, the value of θ for this equationA) increased over time and approached 1.B) decreased over time and approached zero.C) remained constant at zero.D) remained constant at negative one.E) none of the aboveAnswer: ADiff: 26) For this question, assume that the Phillips curve equation is represented by the following equation:πt - πt-1 = (m + z) - αu t. A reduction in the unemployment rate will causeA) a reduction in the markup over labor costs (i.e., a reduction in m).B) an increase in the markup over labor costs.C) an increase in the inflation rate over time.D) a decrease in the inflation rate over time.E) none of the aboveAnswer: DDiff: 27) For this question, assume that the expected rate of inflation is a function of past year's inflation. Also assume that the unemployment rate has greater than the natural rate of unemployment for a number of years. Given this information, we know thatA) the rate of inflation will approximately be equal to zero.B) the rate of inflation should neither increase nor decrease.C) the rate of inflation should steadily increase over time.D) the rate of inflation should steadily decrease.E) the inflation rate will be approximately equal to the natural rate of unemployment. Answer: DDiff: 28) The original Phillips curve implied or assumed thatA) the markup over labor costs was zero.B) the expected rate of inflation would be zero.C) the actual and expected rates of inflation would always be equal.D) all of the aboveE) none of the aboveAnswer: BDiff: 29) For this question, assume that the Phillips curve equation is represented by the following equation:πt - πt-1 = (m + z) - αu t. Given this information, the natural rate of unemployment will be equal toA) m + z.B) (m + z - α).C) α(m + z).D) 0.E) none of the aboveAnswer: EDiff: 210) For this question, assume that the Phi llips curve equation is represented by the following: πt - πt-1 = (m + z) - αu t. Which of the following will cause a reduction in the natural rate of unemployment?A) an increase in mB) an increase in zC) an increase in αD) an increase in actual inflationE) an increase in expected inflationAnswer: CDiff: 211) For this question, assume that the Phillips curve equation is represented by the following: πt - πt-1 = (m + z) - αu t. Which of the following will not cause an increase in the natural rate of unemployment?A) a reduction in mB) a reduction in zC) an increase in αD) an increase in the expected rate of inflationE) all of the aboveAnswer: DDiff: 212) Use the following Phillips curve equation to answer this question: πt - πt-1 = (m + z) - αu t. Which of the following will cause an increase in the natural rate of unemployment?A) a reduction in mB) an increase in zC) an increase in αD) a reduction in expected inflationE) none of the aboveAnswer: BDiff: 213) In which of the following decades did the Phillips curve break down for the U.S.?A) 1940sB) 1950sC) 1960sD) none of the aboveAnswer: DDiff: 114) Assume that expected inflation is based on the following: πe t= θπt-1. An increase in θ will causeA) an increase in the natural rate of unemployment.B) a reduction in the natural rate of unemployment.C) no change in the natural rate of unemployment.D) inflation in period t to be more responsive to changes in unemployment in period t. Answer: CDiff: 215) Assume that expected inflation is based on the following: πe t= θπt-1. If θ = 0, we know thatA) a reduction in the unemployment rate will have no effect on inflation.B) low rates of unemployment will cause steadily increasing rates of inflation.C) high rates of unemployment will cause steadily declining rates of inflation.D) the Phillips curve illustrates the relationship between the level of inflation rate and the level of the unemployment rate.Answer: DDiff: 216) Assume that expected inflation is based on the following: πe t= θπt-1. If θ = 1, we know thatA) a reduction in the unemployment rate will have no effect on inflation.B) low rates of unemployment will cause steadily increasing rates of inflation.C) the actual unemployment rate will not deviate from the natural rate of unemployment.D) the Phillips curve illustrates the relationship between the level of inflation rate and the level of the unemployment rate.Answer: BDiff: 217) Suppose policy makers underestimate the natural rate of unemployment. In a situation like this, policy makers might implement a policy thatA) attempts to maintain output below the natural level of output.B) results in deflation.C) both A and BD) results in steadily rising inflation.Answer: DDiff: 218) During which decade did the original Phillips curve break down? Also, briefly explain why the original Phillips curve broke during this period.Answer: The original Phillips curve broke down in the United States in the 1970s. First, the United States was affected by oil shocks that would cause an increase in both inflation and the unemployment rate. Second, individuals changed the way they formed expectations of prices. Rather than assume that this year's price level would be equal to last year's price level (i.e., zero expected inflation), individuals started to assume that previous inflation would persist.Diff: 219) Explain how the original Phillips curve differs from the expectations-augmented Phillips curve (or the modified, or accelerationist Phillips curve).Answer: The original Phillips curve did not take into account the effects of changes in expected inflation on inflation. The expectations-augmented Phillips curve did allow for changes in expected inflation to affect actual inflation.Diff: 28.3 The Philips Curve and the Natural Rate of Unemployment1) Which of the following will not cause an increase in the natural rate of unemployment?A) an increase in mB) an increase in zC) an increase in the expected inflation rateD) a reduction in mE) none of the aboveAnswer: CDiff: 22) Since 1970, the evidence for the U.S. suggests that the average rate of unemployment required to keep inflation constant has beenA) between 1% and 2%.B) between 2% and 3%.C) between 3% and 4%.D) between 9% and 10%.E) none of the aboveAnswer: EDiff: 23) The evidence for the U.S. suggests that the natural rate of unemployment hasA) increased by more than 5% since the 1960s.B) increased by 1 to 2% since the 1960s.C) decreased from 2000-2007, lower than it had been in the 1980s.D) decreased by more than 5% since the 1960s.E) fluctuated over time since the 1960s.Answer: CDiff: 14) When a worker's nominal wage is indexed, the nominal wage is usually automatically adjusted based on movements in which of the following variables?A) productivityB) the price of the firm's productC) the average wage in the countryD) the average wage in the industryE) none of the aboveAnswer: EDiff: 15) If a country experiences persistently low inflation, which of the following tends NOT to occur?A) wage indexation will become less importantB) nominal wages will be set for shorter periods of timeC) the markup over labor costs will decreaseD) all of the aboveAnswer: ADiff: 26) Which of the following will tend to occur as a result of a reduction in the proportion of a country's workers who have indexed wages?A) the unemployment rate will be relatively low.B) the unemployment rate will be relatively high.C) the inflation rate will be relatively low.D) a given change in the unemployment rate will cause a relatively smaller change in the inflation rate.E) none of the aboveAnswer: DDiff: 27) Which of the following does not represent a "labor market rigidity" to which critics refer when discussing unemployment in Europe?A) generous unemployment insuranceB) restrictive monetary and fiscal policiesC) a high degree of employment protectionD) relatively high minimum wagesE) none of the aboveAnswer: BDiff: 18) Suppose policy makers overestimate the natural rate of unemployment. In situations like these, policy makers will likely implement policies that result inA) less unemployment than necessary.B) an unemployment rate that is "too low."C) a lower inflation rate than necessary.D) a steadily increasing inflation rate.E) overly expansionary monetary and fiscal policy.Answer: CDiff: 29) Which of the following is one possible explanation for the change in the natural rate of unemployment in the United States during the 1970s?A) contractionary fiscal policyB) an increase in the proportion of labor contracts that were indexedC) contractionary monetary policyD) all of the aboveE) none of the aboveAnswer: EDiff: 210) Which of the following will most likely cause a change in the natural rate of unemployment?A) changes in monetary policyB) changes in fiscal policyC) changes in expected inflationD) all of the aboveE) none of the aboveAnswer: CDiff: 211) An increase in the price of oil will likely cause which of the following?A) increase the markup in the Phillips curve equationB) increase the sum "m + z" in the Phillips curve equationC) increase the natural rate of unemploymentD) all of the aboveE) none of the aboveAnswer: DDiff: 212) As the proportion of labor contracts that index wages to prices declines, we would expect thatA) a reduction in the unemployment rate will now have a smaller effect on inflation.B) the natural rate of unemployment will increase.C) the natural rate of unemployment will decrease.D) nominal wages will become more sensitive to changes in unemployment.Answer: ADiff: 213) Suppose the Phillips curve is represented by the following equation: πt - πt-1 = 20 - 2u t. Given this information, we know that the natural rate of unemployment in this economy isA) 10%.B) 20%.C) 6.5%.D) 5%.E) none of the aboveAnswer: ADiff: 214) Suppose the Phillips curve is represented by the following equation: πt - πt-1 = 20 - 2u t. Given this information, which of the following is most likely to occur if the actual unemployment in any period is equal to 6%?A) the rate of inflation will tend to increaseB) the rate of inflation will be constantC) the rate of inflation will tend to decreaseD) none of the aboveAnswer: ADiff: 215) Based on your understanding of the Phillips curve, explain what happens to actual inflation (relative to expected inflation) when the actual unemployment rate is either above or below the natural rate of unemployment.Answer: When the actual unemployment rate is equal to the natural rate of unemployment, we know that actual inflation and expected inflation must be equal. In such a case, all else fixed, inflation will not change. If the actual unemployment rate were to fall below the natural rate, inflation would increase. So, the natural rate of unemployment rate may also be referred to the non-accelerating-inflation rate of unemployment. If the opposite occurs, inflation will fall below expected.Diff: 216) Briefly comment on the predictions of economists Milton Friedman and Edmund Phelps about the ability to exploit a trade-off between inflation and unemployment.Answer: Both Friedman and Phelps (separately) argued that there might be a temporarytrade-off between inflation and unemployment. However, both argued that this trade-off could not be exploited permanently. Eventually, expectations of inflation would adjust.Diff: 217) A number of factors are believed to have caused changes in the natural rate of unemployment in the United States during the 1990s. Briefly comment on each of these factors.Answer: There are a number of candidates here: decrease in monopoly power, decreasing role of unions, aging U.S. population, increased prison population, increased number of workers on disability, and unexpectedly high rate of productivity growth.Diff: 218) Based on your understanding of the Phillips curve, is it possible for the unemployment rate to increase while inflation increases? Explain.Answer: This can occur when negative supply shocks occur. That is, we would observe this when factors cause the natural rate of unemployment to rise (e.g. during the 1970s). This would cause an increase in u and an increase in inflation.Diff: 28.4 A Summary and Many Warnings1) The data suggest that in the European Union countries, the natural rate of unemploymentA) is now higher than in the U.S.B) is no longer a relevant concept.C) has steadily declined over the past two decades.D) will soon exceed the percentage of the labor force that is working.E) has become less "natural," since it is now almost entirely determined by the policies of a few large corporations.Answer: ADiff: 12) During the Great Depression, the actual unemployment rate in the U.S. ________, and the natural rate apparently ________.A) increased; decreasedB) increased; remain unchangedC) increased; increased as wellD) decreased; increasedE) decreased; remained unchangedAnswer: CDiff: 23) Which of the following explains why the original Phillips curve relation disappeared or, as some economists have remarked, "broke down" in the 1970s?A) Individuals assumed the expected price level for the current year would be equal to the actual price level from the previous year.B) Individuals assumed that expected inflation would be zeroC) Individuals changed the way they formed expectations of inflation.D) Monetary policy became contractionary.E) More labor contracts became indexed to changes in inflation.Answer: CDiff: 24) Which of the following situations generally exists when deflation occurs?A) Inflation and unemployment are both increasing.B) Inflation and unemployment are both decreasing.C) The price level is decreasing.D) The rate of inflation is falling from, for example, 10% to 3%.E) The natural rate of unemployment is zero.Answer: CDiff: 15) As of 2009, what was the last year that U.S. experienced deflation?A) 1933B) 1955C) 1973D) 1991E) 2001Answer: BDiff: 16) During the 1980s and early 1990s, it was believed that the natural rate of unemployment in the U.S. was equal toA) 4%.B) 4.5%.C) 5%.D) 6.5%.E) 7%.Answer: DDiff: 17) Which of the following does not explain the relatively low price inflation compared to the higher wage inflation in the U.S. during the 1990s?A) the appreciation of the dollarB) a reduction in benefits paid to workersC) an increase in the natural rate of unemploymentD) a reduction in the price of oilAnswer: CDiff: 28) In the Phillips curve equation, which of the following will cause a reduction in the current inflation rate?A) a reduction in the expected inflation rateB) an increase in the unemployment rateC) a reduction in the markup, mD) all of the aboveE) none of the aboveAnswer: DDiff: 29) Suppose policy makers underestimate the natural rate of unemployment. In situations like these, policy makers will likely implement policies that result inA) more unemployment than necessary.B) an unemployment rate that is "too high."C) a higher inflation rate than necessary.D) a steadily decreasing inflation rate.E) overly contractionary monetary and fiscal policy.Answer: CDiff: 210) Explain how a reduction in the proportion of contracts that are indexed affects the relationship between changes in the unemployment rate and inflation.Answer: As the proportion of labor contracts that are indexed falls, the effects of changes in unemployment on inflation would fall. A reduction in u will cause an increase in inflation. When inflation rises in a period, some contracts (those that are indexed) will call for an immediate increase in wages further increasing inflation within that period. As indexation becomes less prevalent, that secondary effect (caused by the indexed contracts) on inflation will be reduced. Diff: 211) Explain how the unexpectedly high rate of productivity growth at the end of the 1990s affected inflation and unemployment during this period.Answer: The unexpectedly high rate of growth of productivity would cause firms' costs to drop. This would cause (if unexpected) a reduction in unemployment. So, we would observe a simultaneous drop in u and drop in inflation.Diff: 212) Explain how changes in the proportion of contracts that are indexed affect how a given change in monetary policy will affect economic activity.Answer: An increase in nominal money growth will increase the real money supply causing an increase in economic activity. As the proportion of labor contracts that are indexed increases, the effects of changes in unemployment on inflation would increase. A reduction in u will cause an increase in inflation. When inflation rises in a period, some contracts (those that are indexed)will call for an immediate increase in wages further increasing inflation within that period. As indexation becomes more prevalent, that secondary effect on inflation will be magnified. This magnification of the inflation effect will cause the real money supply to increase by a smaller amount and, therefore, reduce the output effects of a given monetary expansion.Diff: 213) Based on the 'early incarnation' of the Phillips curve, explain what effect a decrease in the unemployment rate will have on the inflation rate.Answer: An decrease in u will cause a rise in W. As W rises, firms' costs increase. As firms' costs increase, they will raise the price level. This increase in the price level represents, in this case, inflation.Diff: 214) Why has the U.S. natural rate of unemployment fallen since the early 1990s?Answer: Researchers have offer a number of explanations: Increased globalization and stronger competition between US and foreign firms may have led to a decrease in monopoly power and a decrease in the markup; The nature of the labor market has changed; the aging of the US population; an increase in the prison population and the increase in the number of workers on disability.Diff: 215) Explain the natural unemployment rate and its relationship to inflation rate.Answer: The natural unemployment rate is the unemployment rate at which the inflation rate remains constant. When the actual unemployment rate exceeds the natural rate of unemployment, the inflation rate typically decreases; when the actual unemployment rate is less than the natural unemployment, the inflation rate typically increases.Diff: 216) What is the difference between deflation and disinflation?Answer: Deflation refers to a decrease in the price level, or equivalently, negative inflation. Disinflation is a decrease in the inflation rate.Diff: 117) How will the crisis affect the natural rate of unemployment?Answer: There is an increasing worry that the increase in the actual unemployment rate may eventually translate into an increase in the natural unemployment rate. Workers who have been unemployed for a long time may lose their skills, or their morale, and become unemployable, leading to a higher natural rate.Diff: 2。


第8章 经济增长Ⅱ:技术、经验和政策跨考网独家整理最全经济学考研真题,经济学考研课后习题解析资料库,您可以在这里查阅历年经济学考研真题,经济学考研课后习题,经济学考研参考书等内容,更有跨考考研历年辅导的经济学学哥学姐的经济学考研经验,从前辈中获得的经验对初学者来说是宝贵的财富,这或许能帮你少走弯路,躲开一些陷阱。
以下内容为跨考网独家整理,如您还需更多考研资料,可选择经济学一对一在线咨询进行咨询。
一、判断题1.如果MPK n g δ-=+,则该式所对应的资本存量是资本存量黄金律。
( ) 【答案】T【解析】资本的黄金律水平是使消费最大化的稳定状态的k 值。
考虑人口增长和技术进步,人均消费可写为:()()c f k n g k ***=-++δ,根据人均消费最大化的一阶条件可得:MPK n g δ-=+。
2.根据索洛增长模型,一国GDP 的增长率主要取决于该国的技术进步率。
( ) 【答案】F【解析】根据索洛增长模型,一国GDP 的增长率取决于劳动、资本投入以与技术进步。
3.在考虑人口增长和技术进步的索洛模型中,稳态意味着()()sf k n g k δ=++。
( ) 【答案】T【解析】稳态意味着持平投资等于储蓄,考虑人口增长和技术进步,()()sf k n g k δ=++。
4.根据内生经济增长模型,投资可以导致一国的长期增长。
( ) 【答案】T【解析】投资使得一国的资本存量增加,而资本存量的增加会促进经济增长。
内生经济增长模型中,资本边际收益是非递减的,因此投资可以导致一国的长期增长。
5.内生增长模型可以写作Y AK =,其中,A 为常数。
( ) 【答案】T 【解析】不存在资本边际递减是该公式的主要特征,因此符合内生增长理论的假设条件,可以作为内生增长模型的一种特例。
6.内生增长模型与索洛增长模型的主要区别在于前者假定一个总资本的边际报酬不递减。
( )【答案】T【解析】内生增长理论将资本这一要素广义化,不但用来指物质资本,同时还包括人力资本,它通过生产者“知识溢出”和人力资本的“外部利益”的作用,使得投资收益递增,从而避免了资本积累收益递减的倾向,从而使得资本边际报酬不递减。