Minitab教材
- 格式:ppt
- 大小:5.60 MB
- 文档页数:255


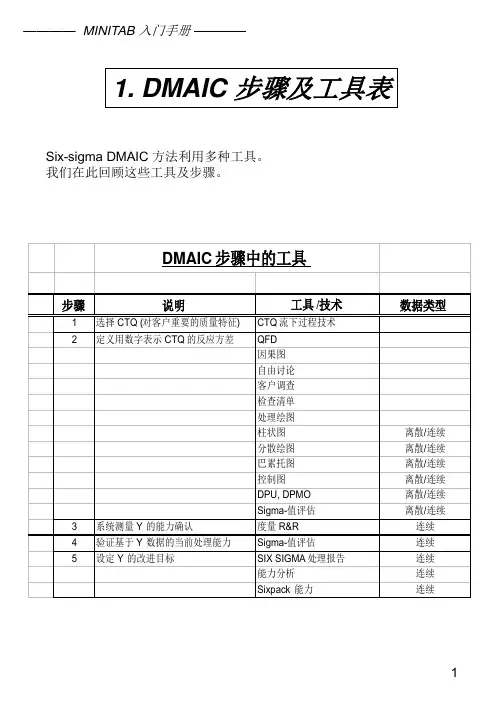


Minitab软件操作一一.制作图表Histogram直方图案例1.11. 数据见下表2. 打开Graph的Histogram3. 出现一个对话框光标在Graph的X栏1中鼠标双击左边的C1 Time to Failure则Time to Failure显示在Graph的X栏1中然后点击OK二. 使用图表摘要和正态测试评价分布性质 一 案例2.1数据Time to Failure 如下表a) 点击StatBasic Statistics Display Descriptive Statisticsb) 出现对话框选择C1 Time to Failure双击或点击下方Select 填入Variables栏中c) 然后点击Graphs键出现新的对话框选择Histogram of data, with normal curve”栏点击OK键关闭此对话框Time to 20 1955 1959 1966 887 198Variable Minimum Maximum Q1 Q3Time to 175 **** **** 2690二案例2.21. 打开工作表出现对话框按路径C:\Program Files\Mtbdemo\Data 文件类型为Minitab (*.mtw)打开Pulse文件2. 再打开对话框如下值0.05拒绝假设H组群是正态的Results for: Pulse.MTWDescriptive Statistics: Pulse2Variable N Mean Median TrMean StDev SE Mean Pulse2 92 80.00 76.00 78.85 17.09 1.78Variable Minimum Maximum Q1 Q3Pulse2 50.00 140.00 68.00 87.00三案例2.3值0.05不能拒绝H假设H假设组群是正态的四案例2.41. 工作表同案例2.1点击Basic Statistics Normality Test2. 出现对话框五案例2.5值0.05不能拒绝H假设H假设组群是正态的值0.05拒绝假设H组群是正态的六案例2.61. 引出工作表Exh_aov.MTW点击Stat Basic Statistics Display Descriptive Statistics出现对话框选择C1 Durability入Variables栏中C2 Carpet入By variable栏中并选择点图和箱图如下2. 点击OK OK输出文本数据及图表如下Results for: Exh_aov.MTWDescriptive Statistics: Durability by CarpetVariable Carpet N Mean Median TrMean StDev Durabili 1 4 14.48 13.52 14.48 3.162 4 9.74 8.63 9.74 3.573 4 12.808 12.895 12.808 1.5064 4 17.01 18.66 17.01 5.69Variable Carpet SE Mean Minimum Maximum Q1 Q3 Durabili 1 1.58 11.94 18.95 12.11 17.822 1.78 7.03 14.66 7.07 13.51使用Brush 工具在图表上识别数据点先点击Editor 再点击EditorBrush 2会出现Brushing 框指向Dotplot图中的一个点或若干点则Brushing框中会出现该点或这些点的行数3若要该点或这些点的其他详细信息可以再点击右键的Set ID Variables出现对话框选择Use columns栏并在空白框中填写所需要的详细信息的列号4此时再指向Dotplot图中的点则输出为三.使用柏拉图因果图时间序列图和运行图分析不良数据一案例3.1计数1. 打开工作表Defects.MTW点击Stat Tables Tally打开对话框选择C3 Describe填入Variables栏中并选择Display的Counts2. 点击OK输出文本数据如下Results for: Defects.MTWTally for Discrete Variables: DescribeDescribe CountConnector 1Dent 2Finish 2O-Ring 2Poor Seal 1Scratch 1Screw 1N= 10二案例3.2柏拉图1. 打开工作表Exh_qc.MTW点击Stat Quality Tools Pareto Chart出现对话框选择C17Flaws填入Chart defects data in:栏中三案例3.3因果图1. 打开工作表Exh_qc.MTW 点击Stat Quality Tools Cause-and-Effect 出现对话框在左边框中选择相应项目填入右边的Causes 栏中并填写需要的空白栏见下表3.41. 打开工作表Falls.MTW点击Graph Time Series Plot出现对话框在左边框中选择相应项目填入右边的Causes栏中并填写需要的空白栏见下表五案例3.5运行图1. 打开工作表Fastener.MTW 点击Stat Quality Tools Run Chart 出现对话框选择左边框内的C2 Weights 填入右边Single column 栏中并选择5为分组的大小即在Subgroupsize 栏中填写5四. 案例4.1定制图表1. 打开工作表Sales.MTW 点击Graph Chart 打开对话框点击Function 的下拉键选择Mean 选择C2 Sales 填入右边的Y 栏和C3 Store 填入X 栏中点击Data display 中的For each 的下拉键选择Group 选择C1 Qtr 填入Group variables 栏中一 案例5.1使用t-tests 和置信区间测试零假设1. 打开Furnace1.MTW 工作表点击Stat Basic Statistics 1-Sample t 打开对话框选择C3 Temp 填入右边Variables 框中在右下方Test mean 栏中填入30作为测试的平均值值0.05不能拒绝H 假设H 假设平均值等于302. 点击OK 输出数据文本如下 Results for: Furnace1.MTW One-Sample T: TempTest of mu = 30 vs mu not = 303.点击StatBasic Statistics1-Sample t出现的对话框中的Graphs 选择Boxplot ofdata5. 点击Stat Basic Statistics Display Descriptive Statistics 打开对话框选择C3 Temp 为变量点击Graphs 打开新对话框选择Histogram of data, with normal curve 和Graphical summary二使用Power 分析评价假设测试的Powerpower 的含义The probability of rejecting the null hypothesis where it is false. 推翻无用假设的可能性1. 打开Furnace1.MTW 工作表点击Stat Power and Sample Size 1-Sample t 打开对话框在Sample sizes 栏中填写11Differences 栏中填写42. 点击OK输出文本数据如下Results for: Furnace1.MTWPower and Sample Size1-Sample t TestTesting mean = null (versus not = null)Calculating power for mean = null + differenceAlpha = 0.05 Sigma = 9.75SampleDifference Size Power4 11 0.23413. 修改对话框中内容Sample sizes栏为空白Differences栏不变Power values栏中填写0.80 0.85 0.90 0.95四组数字见下表4. 点击OK输出文本数据如下Power and Sample Size1-Sample t TestTesting mean = null (versus not = null)Calculating power for mean = null + differenceAlpha = 0.05 Sigma = 9.75Sample Target ActualDifference Size Power Power4 49 0.8000 0.80344 56 0.8500 0.85454 65 0.9000 0.90284 80 0.9500 0.9520六. t -测试和比例测试t-Tests and Tests of Proportions一 使用one-sample t-test 评价过程平均值与目标值之间的差异案例6.11. 打开Furnace1.MTW 工作表点击StatBasic Statistics Normality Test打开对话框值0.05不能拒绝H 假设H 假设样本数据是正态分布的3. 点击Stat Basic Statistics 1-Sample t打开对话框选择C3 Temp填入右边的Variables 栏中并在Test mean 栏中填写30作为目标值以作比较4. 点击OK输出文本数据如下Results for: Furnace1.MTWOne-Sample T: TempTest of mu = 30 vs mu not = 30Temp 11 31.27 9.76 2.94Variable 95.0% CI T P值0.05不能拒绝H二使用two-sample t-test评价两个样本平均值之间的差异案例6.21. 打开Grades.MTW 工作表点击Stat Basic Statistics Normality Test打开对话框2. 选择C1 Verbal或选择C2 Math填入Variables栏中备注以上P值都大于0.05不能拒绝H0假设样本数据应是正态分布4. 点击Stat Basic Statistics2-Variances打开对话框点击Samples in different columns选择C1 Verbal填入First栏中和C2 Math填入Second栏中再点击Options打开新对话框Confidence level栏中为955. 点击OK OK输出数据文本和图表如下Results for: Grades.MTWTest for Equal VariancesLevel1 VerbalLevel2 MathConfLvl 95.0000Bonferroni confidence intervals for standard deviationsLower Sigma Upper N Factor Levels65.7962 73.2099 82.4255 200 Verbal59.6284 66.3471 74.6989 200 MathF-Test (normal distribution)Test Statistic: 1.218P-Value : 0.166Levene's Test (any continuous distribution)Test Statistic: 1.702P-Value : 0.193Test for Equal Variances: Verbal vs Math2-Sample t选择C1 Verbal填入First栏中和C2 Math填入Second栏中再点击Graphs 打开新对话框选择Dotplots of data和Boxplots of data7. 点击OK OK输出图表和数据文本如下Verbal 200 595.7 73.2 5.2Math 200 649.5 66.3 4.7Difference = mu Verbal - mu MathEstimate for difference: -53.8895% CI for difference: (-67.62, -40.14)T-Test of difference = 0 (vs not =): T-Value = -7.71 P-Value = 0.000 DF = 394 三使用paired t-test 评价成对观察值之间的差异案例6.31. 打开Grades.MTW 工作表点击Stat Basic Statistics Paired t打开对话框选择C1Verbal 填入First sample 及C2 Math 填入Second sample 点击Graphs打开新对话框选择Dotplot of difference 和Boxplot of difference2. 点击OK OK 输出文本数据及图表如下Results for: Grades.MTWPaired T-Test and CI: Verbal, MathPaired T for Verbal - MathN Mean StDev SE MeanVerbal 200 595.65 73.21 5.18Math 200 649.53 66.35 4.69Difference 200 -53.88 84.22 5.9695% CI for mean difference: (-65.62, -42.14)T-Test of mean difference = 0 (vs not = 0): T-Value = -9.05 P-Value = 0.000四使用 1 Proportion 测试评价某比例值与目标值之间的差异案例 6.4 1. 打开Grades.MTW 工作表点击Stat Basic Statistics 1 Proportion 打开对话框选择Summarized data在Number of trials 栏中填写2956和Number of successes栏填写241点击Options 打开新对话框Confidence level 栏中为95.0Test proportion 为0.072. 点击OK OK 输出文本数据如下Test and CI for One ProportionTest of p = 0.07 vs p not = 0.07ExactSample X N Sample p 95.0% CI P-Value1 241 2956 0.081529 (0.071913, 0.091983) 0.017。

Minitab应用培训武钢党校管院信息工程教研部2011年10月目录第一章Minitab基本介绍 (4)§1。
1 MINITAB的作用 (4)§1.2 MINITAB的视窗 (4)§1。
3 MINITAB的基本操作 (7)§1。
4启动及关闭MINITAB (12)第二章基本质量图表在Minitab中应用 (13)§2。
1 3D散点图及其在Minitab中的应用 (13)§2。
2 直方图及其在Minitab中的应用 (15)§2。
3 箱线图及其在Minitab中的应用 (18)§2。
4 饼图及其在Minitab中的应用 (20)§2。
5 时间序列图及其在Minitab中的应用 (23)第三章测量系统分析 (26)§3.1 可重复测量的测量系统R&R 研究(交叉Crossed) (26)§3。
2 不可重复测量(破坏性测试)的测量系统R&R (嵌套Nested) (29)§3。
3 计数型属性量具研究和MINITAB操作 (32)第四章假设检验与回归 (35)§4.1单样本Z检验 (35)§4.2单样本T检验 (38)§4。
3双样本T检验 (40)§4。
4配对T检验 (42)§4。
5相关分析 (43)§4.6一元回归 (45)第五章SPC过程统计控制 (48)§5。
1 Xbar—R Chart(均值极差图) (48)§5。
2 Xbar—S Chart(均值标准差图) (50)§5。
3 P Chart(不合格品率图) (50)§5.4 NP Chart(不合格品数图) (52)§5.5 C Chart(不合格点数图) (53)第六章过程能力分析 (56)§6.1计量数据的过程能力分析 (56)§6.2计数数据的过程能力分析 (58)第一章Minitab基本介绍§1。