【材料研究方法】光谱分析(英文)
- 格式:pdf
- 大小:579.45 KB
- 文档页数:9


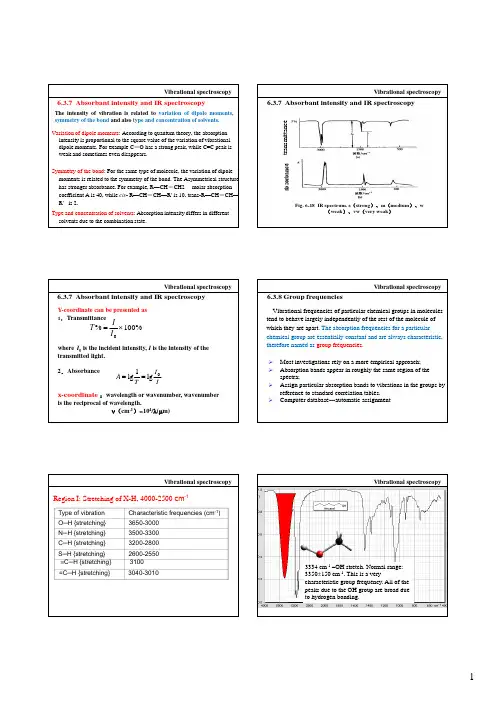
Vibrational spectroscopy6.3.7 Absorbant intensity and IR spectroscopyt r a n s m i t t a n c e Fig. 6-18 IR spectrum. s (strong )、m (medium )、w(weak )、vw (very weak )a b s o r b a n c eVibrational spectroscopy3334 cm -1–OH stretch. Normal range: 3350±150 cm -1. This is a verycharacteristic group frequency. All of the peaks due to the OH group are broad due to hydrogen bonding.Vibrational spectroscopy 3390 cm-1–NH2antisymmetric stretch.Normal range: 3300±100 cm-1. Muchweaker adsorption than the OH stretchin hexanol.Vibrational spectroscopy 3290cm-1–NH2symmetric stretch. 2°amines have only one NH stretch, and3°amines have none.Vibrational spectroscopy Spectral interpretation always starts at the high end, because there are the best group frequencies and they are the easiest to interpret. No peaks appear above 3000 cm-1, the cut-off for unsaturated C-H. the four peaks below 3000 cm-1 are saturated C-H stretching modes.Vibrational spectroscopy 3050 ±50 cm-1 corresponds to the aromatic orunsaturated C(sp2)-H stretch. Always above3000 cm-1. These bands are not assigned tospecific vibrational modes.Vibrational spectroscopy 3080cm-1=CH3080 cm1 2 antisymmetric stretch. An absorption above 3000 cm-1 indicates the presence of an unsaturation (double or triple bond or an aromatic ring).Vibrational spectroscopy 2247 cm-1 C≡N stretch. Normal range:2250±10 cm-1 , lowered 10-20 cm-1when conjugated. Compare to the C ≡Cstretch in 1-heptyne (3000 cm-1).Vibrational spectroscopy 1742 cm-1, -C=O stretch. In small ring esters, this vibration is shifted to higher frequency by coupling to the stretch ofthe adjacent of O-C and C-C bonds. The amount of coupling depends on the O-C(O)-C angle. As with other carbonyl groups, conjugation lowers the frequency.Vibrational spectroscopy 1642 cm-1, C=C stretch. Normalrange:164020cm-1for cis andrange: 1640±20 cm for cis andvinyl, 1670±10 cm-1for trans, tri andtetra substituted. Trans-2-hexene(overlay menu) has only a very weakabsorption, because there is verylittle dipole change when an internaldouble bond stretches (it is nearlysymmetric).Vibrational spectroscopyThe broad peak at approximately 1460 cm-1is actually two overlapping peaks. At1640±10 cm-1, the antisymmetric bend ofthe CH3group absorbs. This is a degenerage bend (one shown).Vibrational spectroscopy At 1375 ±10cm-1, the CH3 symmetric bend (also called the“umbrella” bend) absorbs. This peak is very useful becauseit is isolated from the other peaks. Compare the spectrum ofcyclohexane. The most prominent difference between thetwo spectra is the absence of a CH3 symmetric bend in thecyclohexane spectrum./cm-11715 1800 1828 1928。

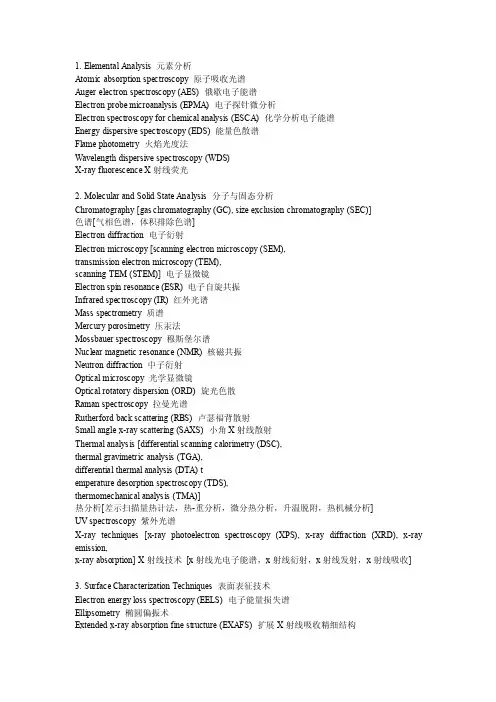
1. Elemental Analysis 元素分析Atomic absorption spectroscopy 原子吸收光谱Auger electron spectroscopy (AES) 俄歇电子能谱Electron probe microanalysis (EPMA) 电子探针微分析Electron spectroscopy for chemical analysis (ESCA) 化学分析电子能谱Energy dispersive spectroscopy (EDS) 能量色散谱Flame photometry 火焰光度法Wavelength dispersive spectroscopy (WDS)X-ray fluorescence X射线荧光2. Molecular and Solid State Analysis 分子与固态分析Chromatography [gas chromatography (GC), size exclusion chromatography (SEC)]色谱[气相色谱,体积排除色谱]Electron diffraction 电子衍射Electron microscopy [scanning electron microscopy (SEM),transmission electron microscopy (TEM),scanning TEM (STEM)] 电子显微镜Electron spin resonance (ESR) 电子自旋共振Infrared spectroscopy (IR) 红外光谱Mass spectrometry 质谱Mercury porosimetry 压汞法Mossbauer spectroscopy 穆斯堡尔谱Nuclear magnetic resonance (NMR) 核磁共振Neutron diffraction 中子衍射Optical microscopy 光学显微镜Optical rotatory dispersion (ORD) 旋光色散Raman spectroscopy 拉曼光谱Rutherford back scattering (RBS) 卢瑟福背散射Small angle x-ray scattering (SAXS) 小角X射线散射Thermal analysis [differential scanning calorimetry (DSC),thermal gravimetric analysis (TGA),differential thermal analysis (DTA) temperature desorption spectroscopy (TDS),thermomechanical analysis (TMA)]热分析[差示扫描量热计法,热-重分析,微分热分析,升温脱附,热机械分析]UV spectroscopy 紫外光谱X-ray techniques [x-ray photoelectron spectroscopy (XPS), x-ray diffraction (XRD), x-ray emission,x-ray absorption] X射线技术[x射线光电子能谱,x射线衍射,x射线发射,x射线吸收]3. Surface Characterization Techniques 表面表征技术Electron energy loss spectroscopy (EELS) 电子能量损失谱Ellipsometry 椭圆偏振术Extended x-ray absorption fine structure (EXAFS) 扩展X射线吸收精细结构Helium (or atom) diffractionLateral (or frictional) force microscopy (LFM) 横向(摩擦)力显微镜Low-energy electron diffraction (LEED) 低能电子衍射Magnetic force microscopy (MFM) 磁力显微镜Near-edge x-ray adsorption fine structure (NEXAFS) 近边X射线吸收精细结构Near field scanning 近场扫描Reflection high-energy electron diffraction (RHEED) 反射高能电子衍射Scanning tunneling microscopy (STM) 扫描隧道显微镜Scanning force microscopy (SFM) 扫描力显微镜Secondary ion mass spectroscopy (SIMS) 二次离子质谱Surface enhanced raman spectroscopy (SERS) 表面增强拉曼光谱Surface extended x-ray adsorption fine structure (SEXAFS) 表面扩展X射线吸收精细结构Surface force apparatus 表面力仪器。

Vibrational spectroscopy6.3.1 Fundamentals of vibrational spectroscopyDefinition Vibrational spectroscopy:is concerned with the d t ti f t iti detection of transitions between energy levels in molecules that result from stretching and bending vibrations of the interatomic bonds.asymmetricalVibrational spectroscopyKinds of vibrational spectroscopy ¾Infra-red spectroscopy(more sensitive to polarized group)6.3.1 Fundamentals of vibrational spectroscopysymmetrical¾Raman spectroscopy (moresensitive to non-polarized)Both methods are concerned with vibrations in molecules , they differ in the manner in which interaction with the exciting radiation occurs .Linear PE: (a) IR, (b)RamanFig. 6-14 Dipole moment of HClVibrational spectroscopyVibrating of Disulfide carbonSymmetrical stretchingInfrared inactive 6.3.2 Infrared spectroscopyAsymmetrical stretchingBendingInfrared activeInfrared inactive Fig. 6-15 Vibration of Disulfide carbonm1lowHigh/cm-1High/cm-1lowVibrational spectroscopy Methylbenzene(甲苯)2005.2 S. Guv =0 represents the ground state v =l the excited vibrational state6.3.3 Raman spectroscopy(1)(2)(3)Vibrational spectroscopy ¾The essential prerequisite for Raman scattering is a change in the polarizability of the bond when vibrations occur.Polarizability may be thought of as a measure of 6.3.3 Raman spectroscopy¾Polarizability may be thought of as a measure of theFig. 6-16 Motion state of linear molecules Degrees of freedom (H2O) : 3×3−6 = 3Vibraitonal modes (methylene group):2926cm-1(s)asνAsymmetricalsν: 2853 cm Symmetricalδ:1468 cm-1(m) δr:720 cm-1(CH1306~1303cm-1(w)γt :1250cmscissoring rocking waggingHexaneFour peakspSpectral interpretation always starts at the high end, because there are the best group frequencies and they are the easiest to interpret. No peaks appear above 3000 cm-1, the cut-off for unsaturated C-H. the four peaks below 3000 cm-1 are saturated C-H stretching modes.HexaneThe peak at 2962 cm-1 isassigned to the antisymmetricassigned to the antisymmetricstretch of the CH3group. Thisvibration is always found inthe range 2962±10 cm-1. thereare actually two degenerateantisymmetric stretchingmodes (only one shown).HexaneAt 2926cm-1, the CH2antisymmetric stretchabsorbs.Normal range:2926±10 cm-1.HexaneAt 2872cm-1, the CH3symmetric stretchabsorbs.Normal range:2872±10 cm-1.HexaneAt2853-1,the CHAt 2853cm, the CH2symmetric stretchabsorbs.Normal range:2853±10 cm-1.Vibrational spectroscopy Hexane1470cm-1This is the C-H bendingregion, expanded to show thenearly overlapping peaks forthe CH3and CH2bends.Vibrational spectroscopyHexanerocking When four or more CH2groups arein a chain, a vibration at 720±10cm-1corresponds to concertedrocking of all of the CH2’s.Vibrational spectroscopyHexanol3334 cm-1–OH stretch. Normal range: 3350±150 cm-1.This is a very characteristic group frequency. All of thepeaks due to the OH group are broad due to hydrogenbonding.Vibrational spectroscopy Hexanol 1430 cm -1–OH bend . Normal range: 1400±100 cm -1. This broad peak is buried under the CH bending modes.Vibrational spectroscopyHexanol660 cm -1–OH wag. While not a group frequency, this is another band due to the OH.Vibrational spectroscopy Aromatic ring expansion (Methylbenzene )At 1601 cm -1, thesymmetric ring strethch absorbs. Normal range: 1590±10 cm -1. This ib ti h di lOnly notsymmetrically substituted.vibration has a dipole change (and absords in IR) only when notsymmetrically substituted. The intensity of this band also varies with thesubstituent. Compare to p-xylene from the overlay menu.Vibrational spectroscopyAromatic ring expansion (Methylbenzene )At 1500cm -1, a different ring stretch absorbs. Range: 1500±10cm -1. Variable intensityVibrational spectroscopy 6.3.6 Comparing of IR and Raman SpectroscopyasymmetricalsymmetricalFig. 6-17 Linear PE: (a) IR, (b) Raman。

光谱分析仪分析流程英文回答:Spectroscopy is a technique used to analyze the interaction between matter and electromagnetic radiation.It provides valuable information about the composition, structure, and properties of materials. Spectroscopy instruments, known as spectrometers, are used to measure and analyze the intensity and wavelength of electromagnetic radiation.The analysis process using a spectrometer typically involves several steps. Here is a general outline of the spectroscopy analysis workflow:1. Sample Preparation: The first step is to prepare the sample for analysis. This may involve cleaning, grinding, or diluting the sample depending on its nature. It is essential to ensure that the sample is representative and homogeneous.2. Instrument Calibration: Before starting the analysis, the spectrometer needs to be calibrated. Calibrationinvolves measuring known reference samples to establish a baseline for accurate measurements. This step ensures that the instrument is properly adjusted and provides reliable results.3. Measurement: Once the sample is prepared and the instrument is calibrated, the measurement can begin. The sample is placed in the spectrometer, and the instrument measures the intensity of the radiation at different wavelengths. The resulting data is called a spectrum.4. Data Analysis: After obtaining the spectrum, thenext step is to analyze the data. This involvesinterpreting the peaks, patterns, and intensities in the spectrum. Various mathematical and statistical techniques can be applied to extract meaningful information from the data.5. Identification and Quantification: Based on theanalysis of the spectrum, the next step is to identify and quantify the components present in the sample. This can be done by comparing the obtained spectrum with reference spectra or using spectral databases. Quantification involves determining the concentration or amount of each component.6. Data Reporting: Finally, the analysis results are documented and reported. This includes summarizing the findings, presenting the spectra and their interpretations, and providing any additional relevant information. The report may also include recommendations or further analysis suggestions.Spectroscopy analysis can be performed using various techniques such as UV-Vis spectroscopy, infrared spectroscopy, Raman spectroscopy, and nuclear magnetic resonance spectroscopy, among others. Each technique hasits specific principles and applications, but the general analysis workflow remains similar.中文回答:光谱分析仪是一种用于分析物质与电磁辐射相互作用的技术。

中英⽂对照(材料研究⽅法) Optical microscopy 光学显微镜 XRD (X-ray diffraction) X射线衍射 TEM Transmission Electron Microscopy 透射电⼦显微镜 SEM Scanning Electron Microscopy 扫描电⼦显微镜注:扫描电⼦显微镜和透射电⼦显微镜的成像原理完全不同,它是使⽤从样品表⾯激发出的各种物理信号来调制成像的。
resolution 分辨率 focal point 焦点 focal distance 焦距 Depth of field 景深 depth of focus 焦长 Aberrations 偏差,差错 Astigmatism 像散 Spherical aberration 球差 Chromatic aberration ⾊差 x射线和γ射线区别:Gamma rays are now usually distinguished by their origin: X-rays are emitted by definition by electrons outside the nucleus, while gamma rays are emitted by the nucleus. Spectroscopy 光谱 Residual strain/stress 参与应⼒ Neutron beam 中⼦束 Laue pattern 劳埃衍射花样 Debye pattern 德拜衍射花样 The structure of crystalline 晶体结构 Primitive cell 原胞 smallest possible unit cell Unit cell 单胞 arbitrarily chosen but in practical always highest possible symmetry, so as many right angles as possible Crystal structure = lattice + basis 晶体结构 = 点阵 + 基元 7 crystal systems(7个晶系): according to symmetry(对称性) 7 lattice systems (7个点阵系统): according to lattice cubic ⽴⽅ hexagonal 六⽅ tetragonal 四⽅ trigonal 三 orthorhombic 正交晶系 monoclinic 单斜 triclinic 三斜 HCP 密排六⽅ Diffraction intensity 衍射强度。
光谱学英语一、单词1. spectrum(复数:spectra)- 英语释义:A band of colors, as seen in a rainbow, produced by separation of theponents of light by their different degrees of refraction according to wavelength.- 用法:可以用作名词,如“The spectrum of light includes colors f rom red to violet.”(光谱包括从红色到紫色的颜色。
) - 双语例句:The visible spectrum is just a small part of the electromagnetic spectrum.(可见光谱只是电磁光谱的一小部分。
)2. spectroscopy- 英语释义:The study of the interaction between matter and radiated energy, especially in terms of the frequencies present in a spectrum of the radiation.- 用法:作名词,例如“Spectroscopy is widely used in chemical analysis.”(光谱学在化学分析中被广泛应用。
)- 双语例句:Infrared spectroscopy can be used to identify different chemicalpounds.(红外光谱学可用于识别不同的化合物。
)3. wavelength- 英语释义:The distance between successive crests of a wave, especially points in a sound wave or electromagnetic wave.- 用法:名词,如“Each color has a different wavelength.”(每种颜色都有不同的波长。
分析化学专业英语词汇引言分析化学作为化学领域的重要分支之一,在实验室中发挥关键作用。
掌握与分析化学相关的英语词汇对于专业人士至关重要。
本文将介绍一些常见的分析化学专业英语词汇,帮助读者更好地理解和应用这些术语。
基本概念1.分析化学 (Analytical Chemistry): 一门通过利用实验方法和仪器设备来揭示物质组成和特性的科学。
2.样品 (Sample): 被选中用于分析或实验的物质。
3.分析 (Analysis): 通过实验手段对样品进行检验和测量以获取定性和定量的信息。
4.示性 (Indicator): 溶液中使用的化学物质,能够通过改变颜色、产生沉淀等方式指示物质之间发生的反应。
5.仪器 (Instrument): 用于进行化学分析的设备或仪器,如光谱仪、质谱仪等。
常见分析方法1.光谱分析 (Spectroscopic Analysis): 利用与物质相互作用的电磁辐射进行分析的方法,如紫外可见光谱、红外光谱等。
2.色谱分析 (Chromatographic Analysis): 通过物质在固定相和移动相之间的分配系数差异实现分离和分析的方法,如气相色谱、液相色谱等。
3.质谱分析 (Mass Spectrometry): 通过测量物质离子质量-电荷比来进行分析的方法,可用于物质的结构鉴定和定量分析。
4.电化学分析 (Electrochemical Analysis): 利用电化学技术进行分析的方法,如电位滴定、电化学计量等。
5.化学计量法 (Volumetric Analysis): 通过加滴定液或碰撞试剂进行浓度确定的分析方法,如酸碱滴定、氧化还原滴定等。
分析仪器和设备1.气相色谱仪 (Gas Chromatograph): 一种用于气相色谱分析的设备,能够对复杂混合物进行定性和定量分析。
2.液相色谱仪(Liquid Chromatograph): 一种用于液相色谱分析的设备,广泛应用于药学、环境和化学领域。
Content目录1 Purpose目的2 Reference编制依据3 Application scope适用范围:4 The requirement of qualification of personnel for spectrum analysis光谱分析人员资质的要求:5 The inspection and testing procedure and requirements检验程序及要求:6 To sign and issue the inspection and testing report and management of the information and document.检验报告签发及资料管理。
7 The flow chart of spectrum analysis inspection procedure1 Purpose目的To assure the inspection result of spectrum analysis is accurate and real and to meet the requirement of relevant regulations issued by the State during the project installation.为保证工程安装中光谱分析检验结果准确、可靠,满足国家有关规范的要求。
2 Reference编制依据2.1 GB50235-97《Code for Construction and acceptance of industrial metallic piping》GB50235-97《工业金属管道工程施工及验收规范》2.2 DL5007-92《Technical regulation of construction and acceptance of power project》DL5007-92《电力建设施工及验收技术规范》2.3 《Manual of metal material for boiler& pressure vessel》《锅炉压力容器金属材料手册》2.4 《Physics identification of metal》《金属物理鉴别》2.5 《Specification of spectrometer and AC arc generator》《看谱镜及交流电弧发生器使用说明书》3 Application scope适用范围3 .1 Physics and chemical inspection and testing are used by the method of spectrum analysis for the manufacturing and installation in Nanhai project .适用于南海项目制造、安装工程,采用光谱分析方法的理化检验。
Vibrational spectroscopy
6.3.1 Fundamentals of vibrational spectroscopy
Definition Vibrational spectroscopy:is concerned with the d t ti f t iti detection of transitions between energy levels in molecules that result from stretching and bending vibrations of the interatomic bonds.
asymmetrical
Vibrational spectroscopy
Kinds of vibrational spectroscopy ¾Infra-red spectroscopy
(more sensitive to polarized group)6.3.1 Fundamentals of vibrational spectroscopy
symmetrical
¾Raman spectroscopy (more
sensitive to non-polarized)Both methods are concerned with vibrations in molecules , they differ in the manner in which interaction with the exciting radiation occurs .
Linear PE: (a) IR, (b)
Raman
Fig. 6-14 Dipole moment of HCl
Vibrational spectroscopy
Vibrating of Disulfide carbon
Symmetrical stretching
Infrared inactive 6.3.2 Infrared spectroscopy
Asymmetrical stretching
Bending
Infrared active
Infrared inactive Fig. 6-15 Vibration of Disulfide carbon
m1
low
High/cm-1
High/cm-1
low
Vibrational spectroscopy Methylbenzene(甲苯)
2005.2 S. Gu
v =0 represents the ground state v =l the excited vibrational state
6.3.3 Raman spectroscopy
(1)
(2)
(3)
Vibrational spectroscopy ¾The essential prerequisite for Raman scattering is a change in the polarizability of the bond when vibrations occur.
Polarizability may be thought of as a measure of 6.3.3 Raman spectroscopy
¾Polarizability may be thought of as a measure of the
Fig. 6-16 Motion state of linear molecules Degrees of freedom (H2O) : 3×3−6 = 3
Vibraitonal modes (methylene group)
:2926cm-1(s)as
ν
Asymmetrical
s
ν: 2853 cm Symmetrical
δ:1468 cm-1(m) δr:720 cm-1(CH
1306~1303cm-1(w)γ
t :1250cm
scissoring rocking wagging
Hexane
Four peaks
p
Spectral interpretation always starts at the high end, because there are the best group frequencies and they are the easiest to interpret. No peaks appear above 3000 cm-1, the cut-off for unsaturated C-H. the four peaks below 3000 cm-1 are saturated C-H stretching modes.
Hexane
The peak at 2962 cm-1 is
assigned to the antisymmetric
assigned to the antisymmetric
stretch of the CH3group. This
vibration is always found in
the range 2962±10 cm-1. there
are actually two degenerate
antisymmetric stretching
modes (only one shown).Hexane
At 2926cm-1, the CH2
antisymmetric stretch
absorbs.Normal range:
2926±10 cm-1.
Hexane
At 2872cm-1, the CH3
symmetric stretch
absorbs.Normal range:
2872±10 cm-1.Hexane
At2853-1,the CH
At 2853cm, the CH2
symmetric stretch
absorbs.Normal range:
2853±10 cm-1.
Vibrational spectroscopy Hexane
1470cm-1This is the C-H bending
region, expanded to show the
nearly overlapping peaks for
the CH3and CH2bends.
Vibrational spectroscopy
Hexane
rocking When four or more CH2groups are
in a chain, a vibration at 720±10
cm-1corresponds to concerted
rocking of all of the CH2’s.
Vibrational spectroscopy
Hexanol
3334 cm-1–OH stretch. Normal range: 3350±150 cm-1.
This is a very characteristic group frequency. All of the
peaks due to the OH group are broad due to hydrogen
bonding.
Vibrational spectroscopy Hexanol 1430 cm -1–OH bend . Normal range: 1400±100 cm -1. This broad peak is buried under the CH bending modes.
Vibrational spectroscopy
Hexanol
660 cm -1–OH wag. While not a group frequency, this is another band due to the OH.
Vibrational spectroscopy Aromatic ring expansion (Methylbenzene )
At 1601 cm -1, the
symmetric ring strethch absorbs. Normal range: 1590±10 cm -1. This ib ti h di l
Only not
symmetrically substituted.
vibration has a dipole change (and absords in IR) only when not
symmetrically substituted. The intensity of this band also varies with the
substituent. Compare to p-xylene from the overlay menu.
Vibrational spectroscopy
Aromatic ring expansion (Methylbenzene )
At 1500cm -1, a different ring stretch absorbs. Range: 1500±10cm -1. Variable intensity
Vibrational spectroscopy 6.3.6 Comparing of IR and Raman Spectroscopy
asymmetrical
symmetrical
Fig. 6-17 Linear PE: (a) IR, (b) Raman。